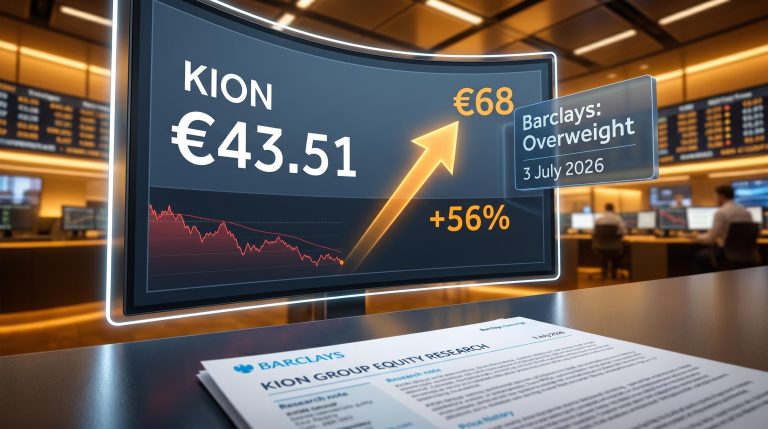
Why Barclays Sees 56% Upside in a Beaten-Down Automation Stock
1 hr ago
Approximately $136 billion flowed into cash funds in a single week, the largest rush to safety since January 2026. Yet U.S. equity funds recorded their sixth consecutive week of net inflows. That contradiction, defensive capital allocation running alongside a buoyant equity tape, is the signal worth examining. Bank of America’s weekly fund flow report for the week ending 8 May 2026 captures a market where institutional money is moving in two directions at once: toward safety at the asset-class level and toward U.S. stocks at the regional level. The data, combined with BofA’s proprietary Bull and Bear Indicator and a shift in central bank policy direction, offers a layered picture of where risk appetite stands and what threshold would change the assessment. What follows is a breakdown of the specific flow figures, what they signal about sentiment, and the macro variable that could accelerate the move toward a formal sell signal.
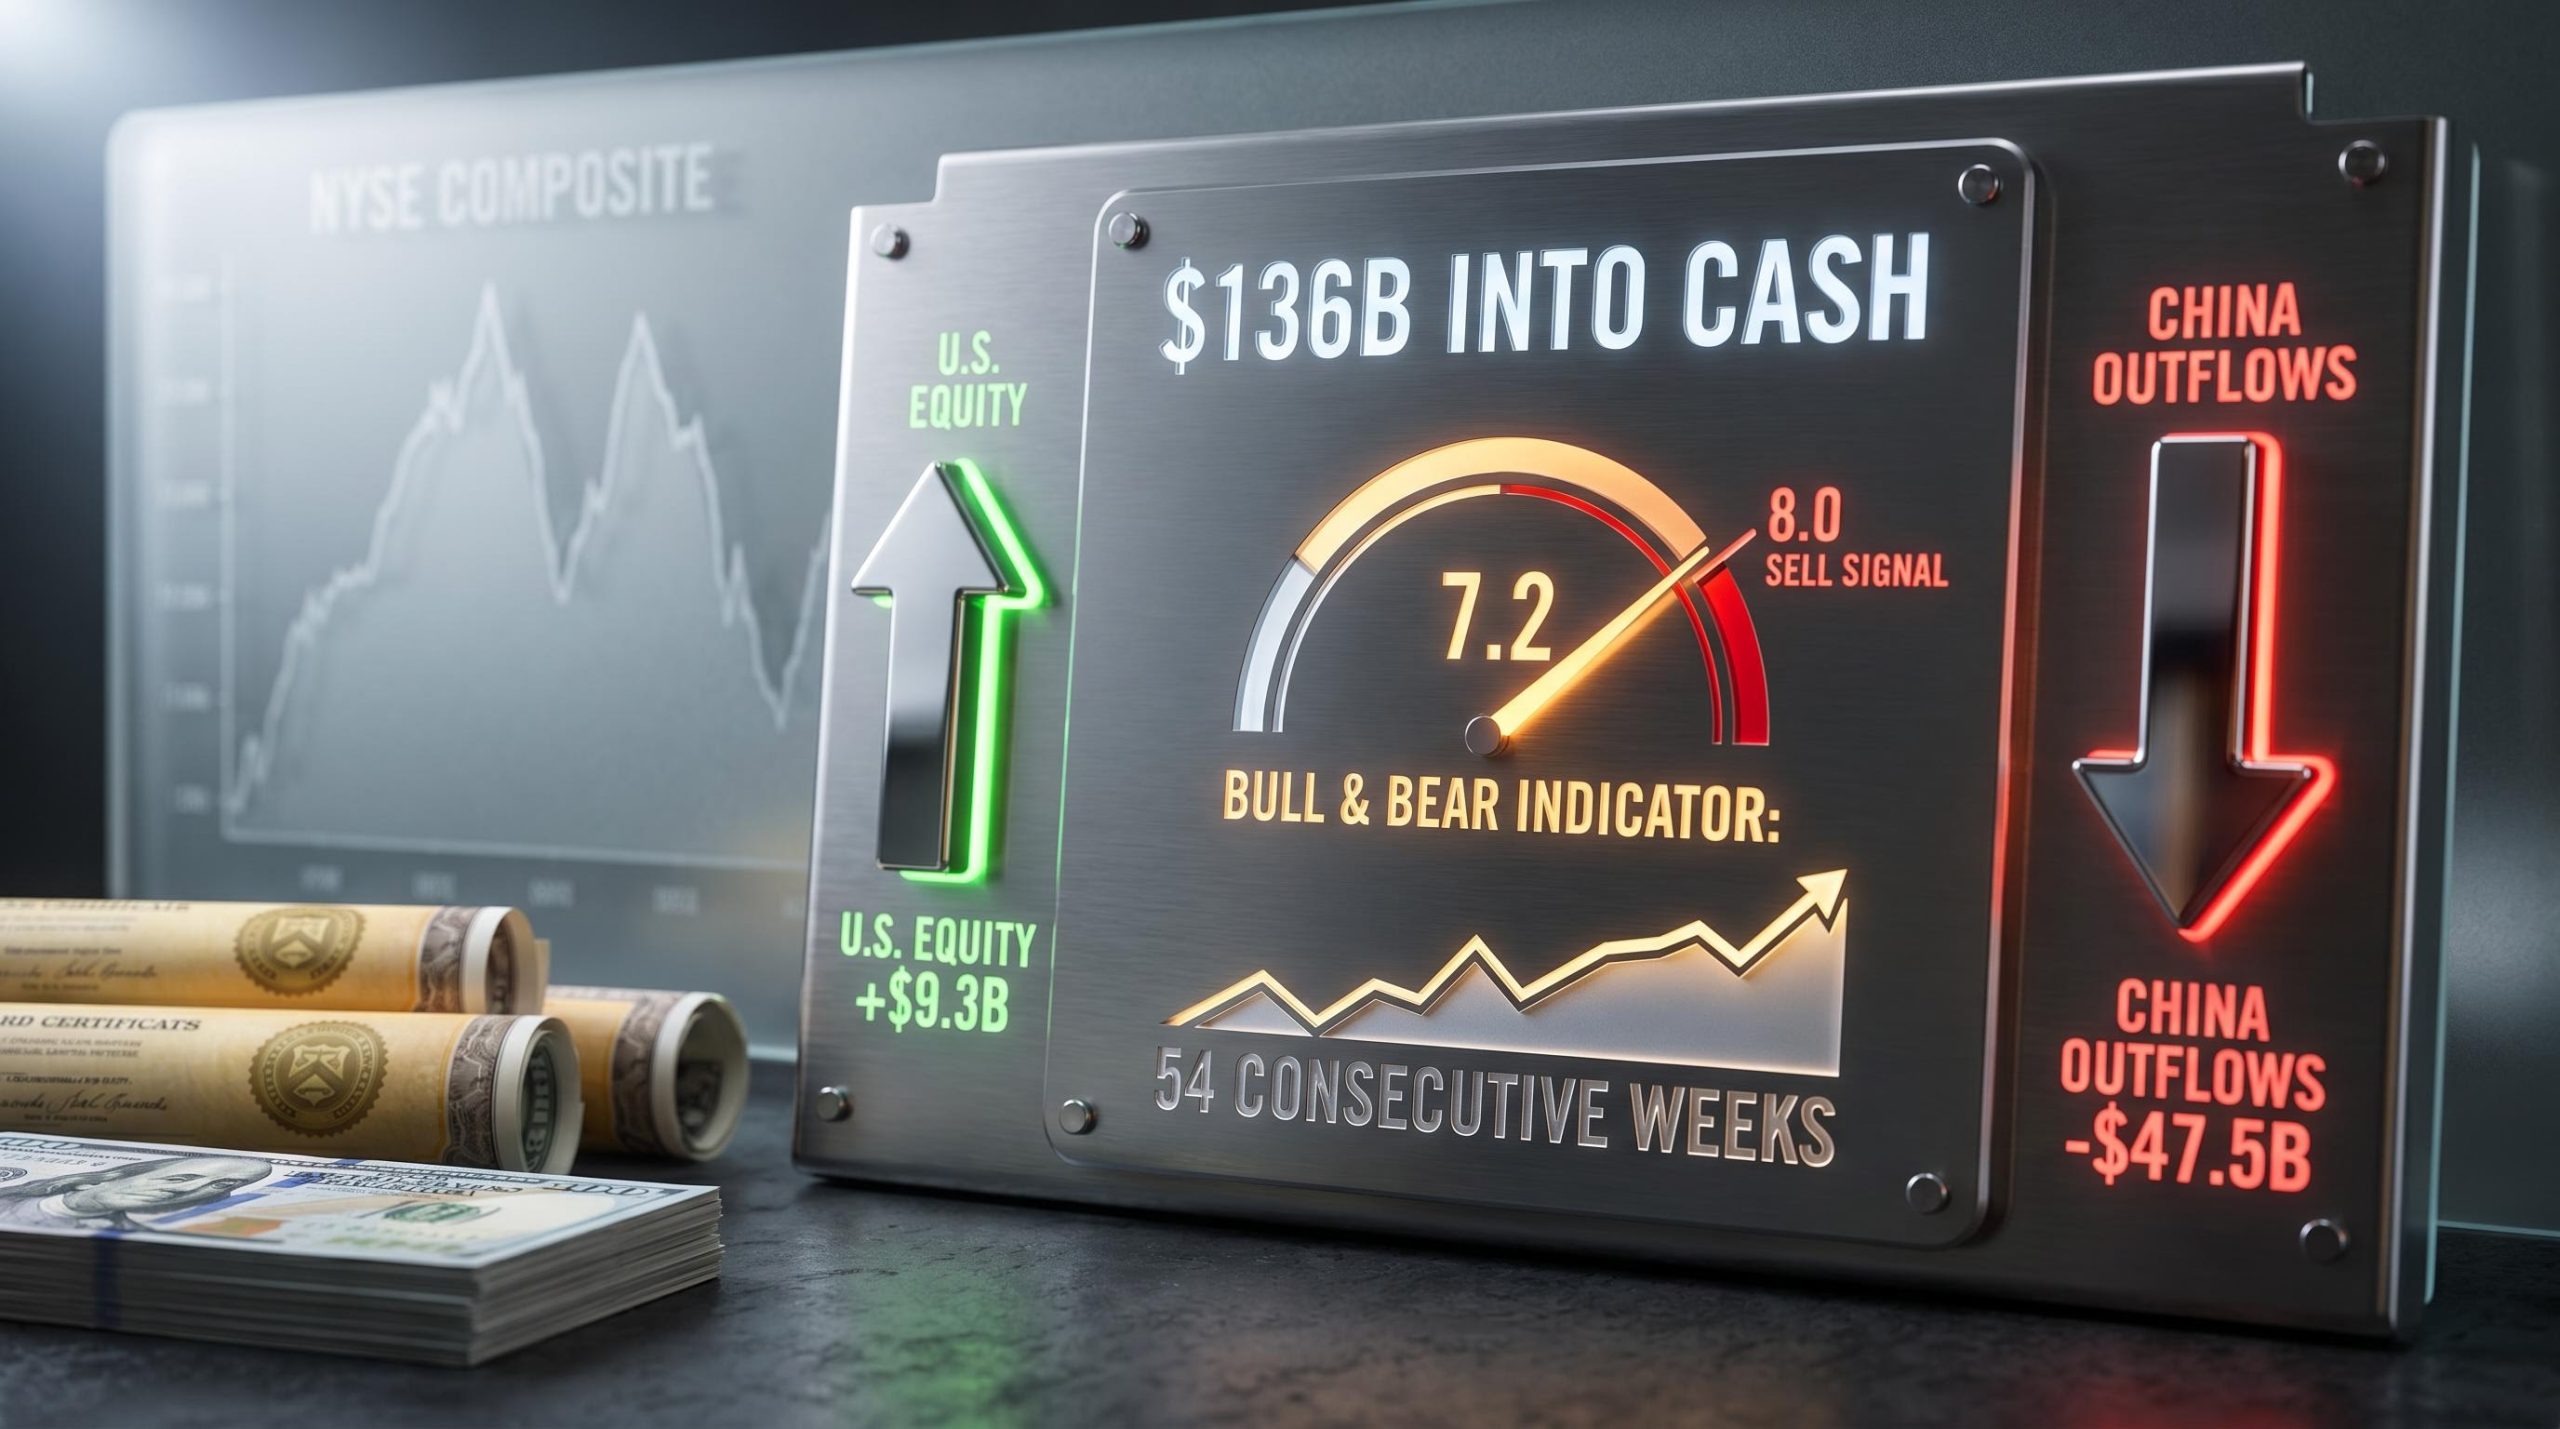
$136 billion into cash funds in a single week, the largest inflow since January 2026.
The scale of the defensive move is difficult to dismiss. But the full rotational picture is more nuanced than the cash headline suggests.
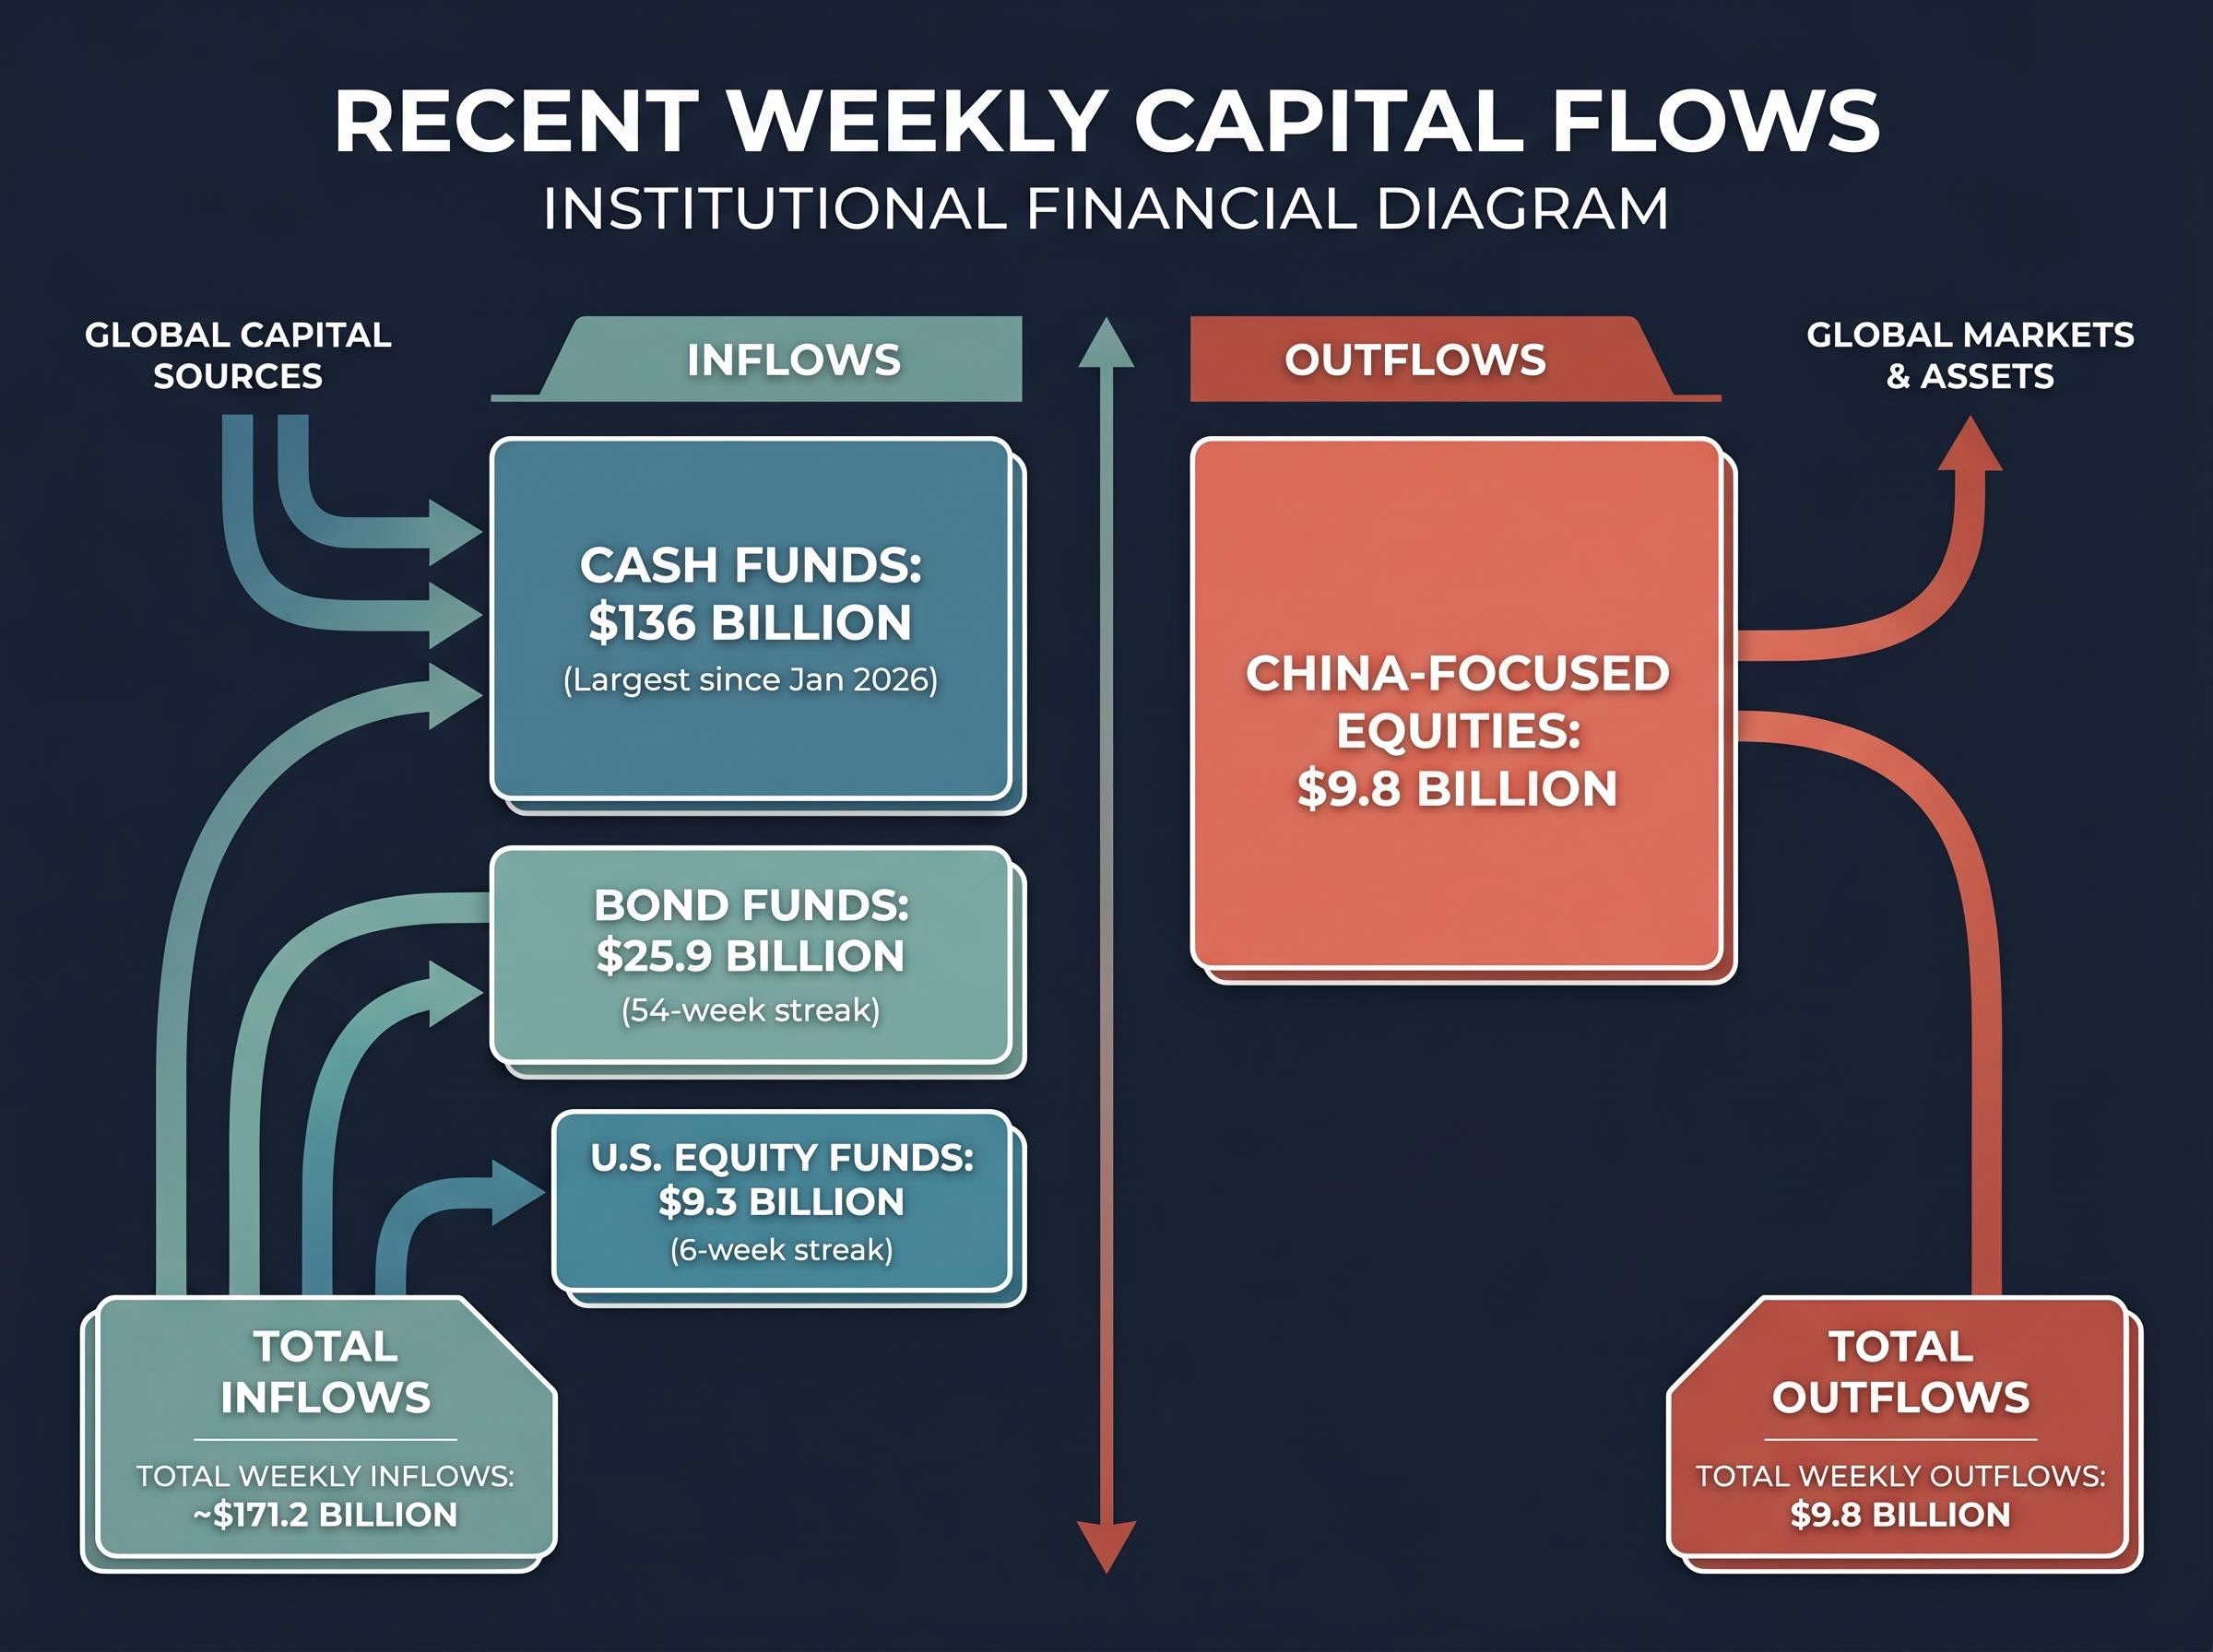
The contrast matters. Cash and bonds absorbed more than $160 billion in combined inflows, yet equities still attracted net new capital. That net figure, however, is almost entirely a U.S. story. Strip out the $9.3 billion flowing into U.S. equity funds and the rest of the global equity universe is in net redemption territory. The surface looks constructive; the composition tells a more defensive story.
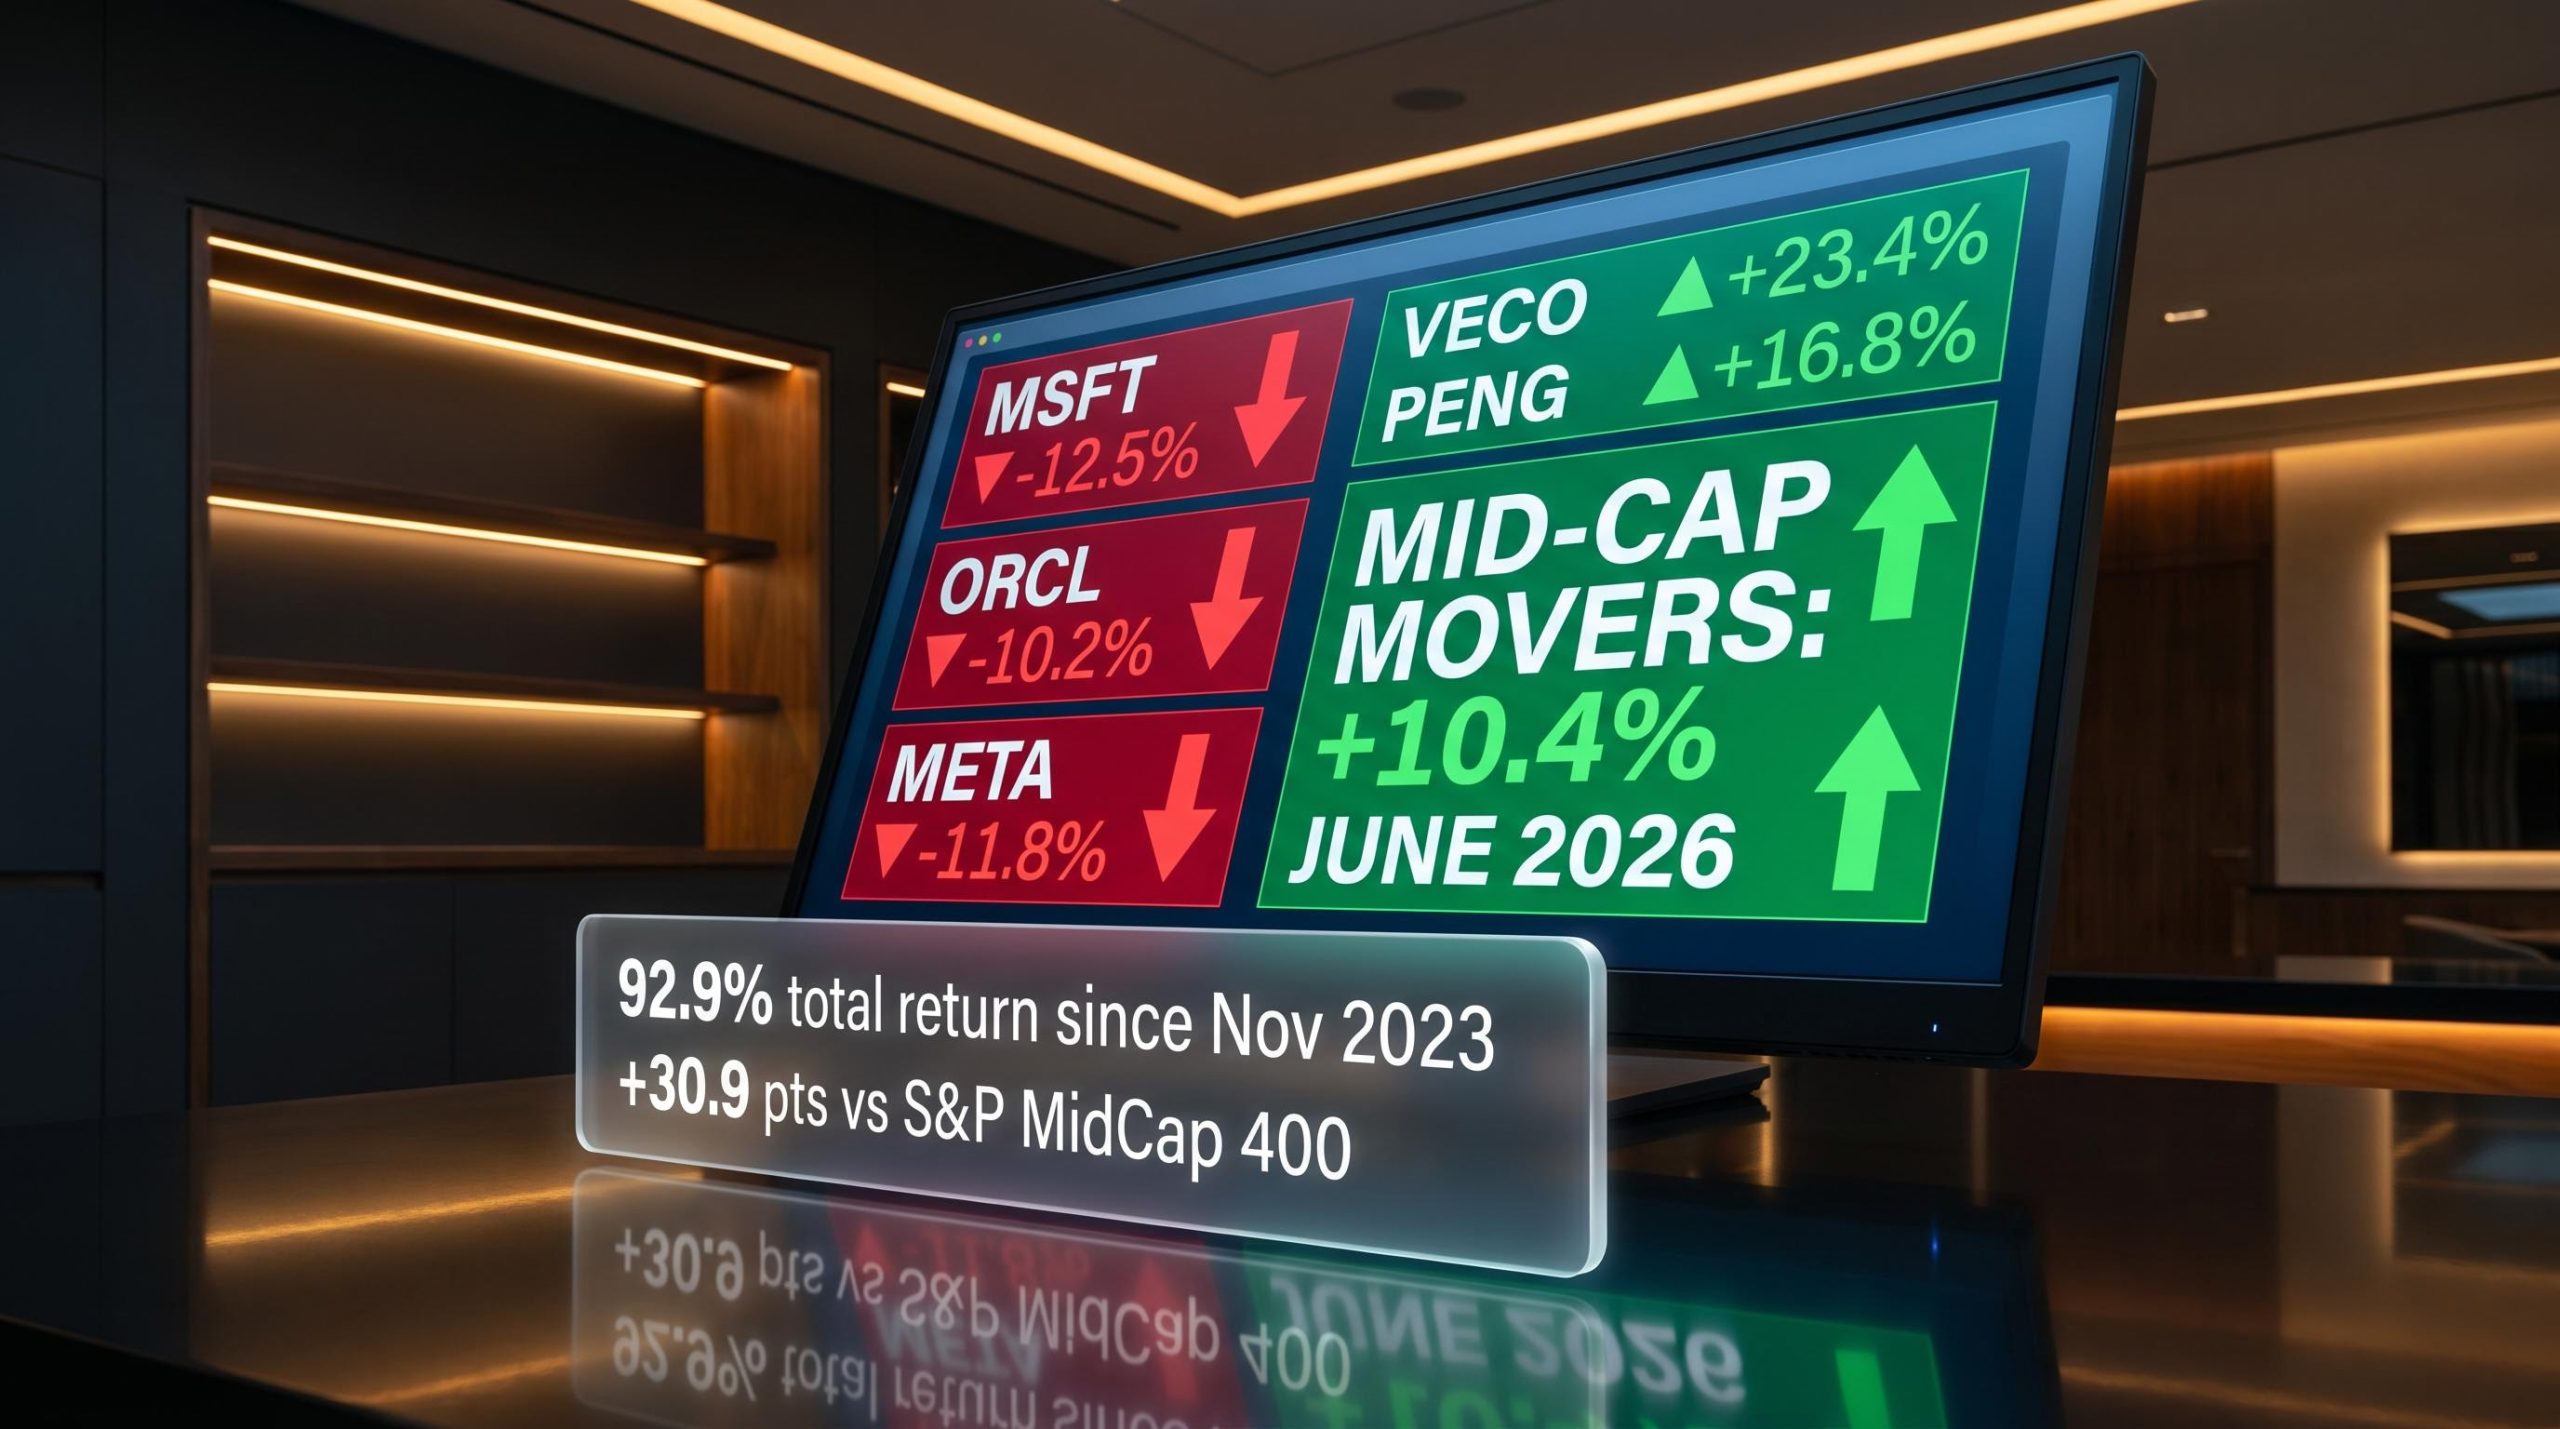
Market breadth in April 2026 reinforces the composition argument embedded in the flow data: the S&P 500 posted a 98th-percentile monthly return while only 23% of its constituents outperformed the index, a 5-percentage-point gap between cap-weighted and equal-weighted performance that mirrors the divergence between the U.S. equity headline inflow and the defensive cash positioning running alongside it.
The single-week figures are sharp. The cumulative picture is sharper. Over the past six weeks, approximately $47.5 billion has left China-focused equity funds, a sustained directional shift that distinguishes this move from short-term noise.
In the most recent week alone, China-focused funds saw approximately $9.8 billion in outflows. Broader emerging market equities recorded approximately $11.6 billion in redemptions, the steepest weekly figure since January 2026.
| Region / Segment | Weekly Outflow | Context |
|---|---|---|
| China-focused equities | $9.8 billion | Six-week cumulative: $47.5 billion |
| Emerging markets (overall) | $11.6 billion | Steepest weekly outflow since January 2026 |
| European equities | $11.3 billion | Cumulative over four weeks |
| Consumer sector funds | $1.1 billion | Largest redemption since December 2025 |
European equity funds have now shed approximately $11.3 billion over four weeks, while consumer sector funds recorded approximately $1.1 billion in redemptions, the largest since December 2025. These are not isolated moves. When China, broader EM, Europe, and a cyclical sector like consumer discretionary are all in net outflow simultaneously, the data describes a coordinated risk-off rotation across regions and segments.
Fund flow analysis tracks net capital movement across asset classes, regions, and investment vehicles. It captures where money is going, not where prices are heading. That distinction is worth emphasising: flow data functions as a sentiment proxy, revealing how institutions are positioning rather than predicting what markets will do next.
When cash and bond inflows surge while equity indices continue to climb, the gap between positioning and price becomes the signal. Sustained inflows into defensive assets indicate institutional risk aversion even when headlines suggest markets are behaving normally. The 54-week bond inflow streak is an example: no single week in that run was dramatic on its own, but the cumulative direction represents a structural preference for fixed income that has persisted across multiple market environments.
For context, the Investment Company Institute (ICI) reported long-term fund net outflows of approximately -$16.84 billion for the week ending 29 April 2026, a verifiable data point that aligns with the broader risk-off pattern.
The ICI weekly fund flow data provides the primary benchmark for tracking net capital movements across long-term mutual funds, with the institute’s methodology distinguishing between equity, bond, and hybrid fund categories in a way that makes cross-week comparisons directly comparable.
A practical approach to reading a weekly flow report involves four steps:
One limitation deserves attention: aggregate flows can mask significant divergences between active and passive strategies, and attribution of flows to specific catalysts requires care.
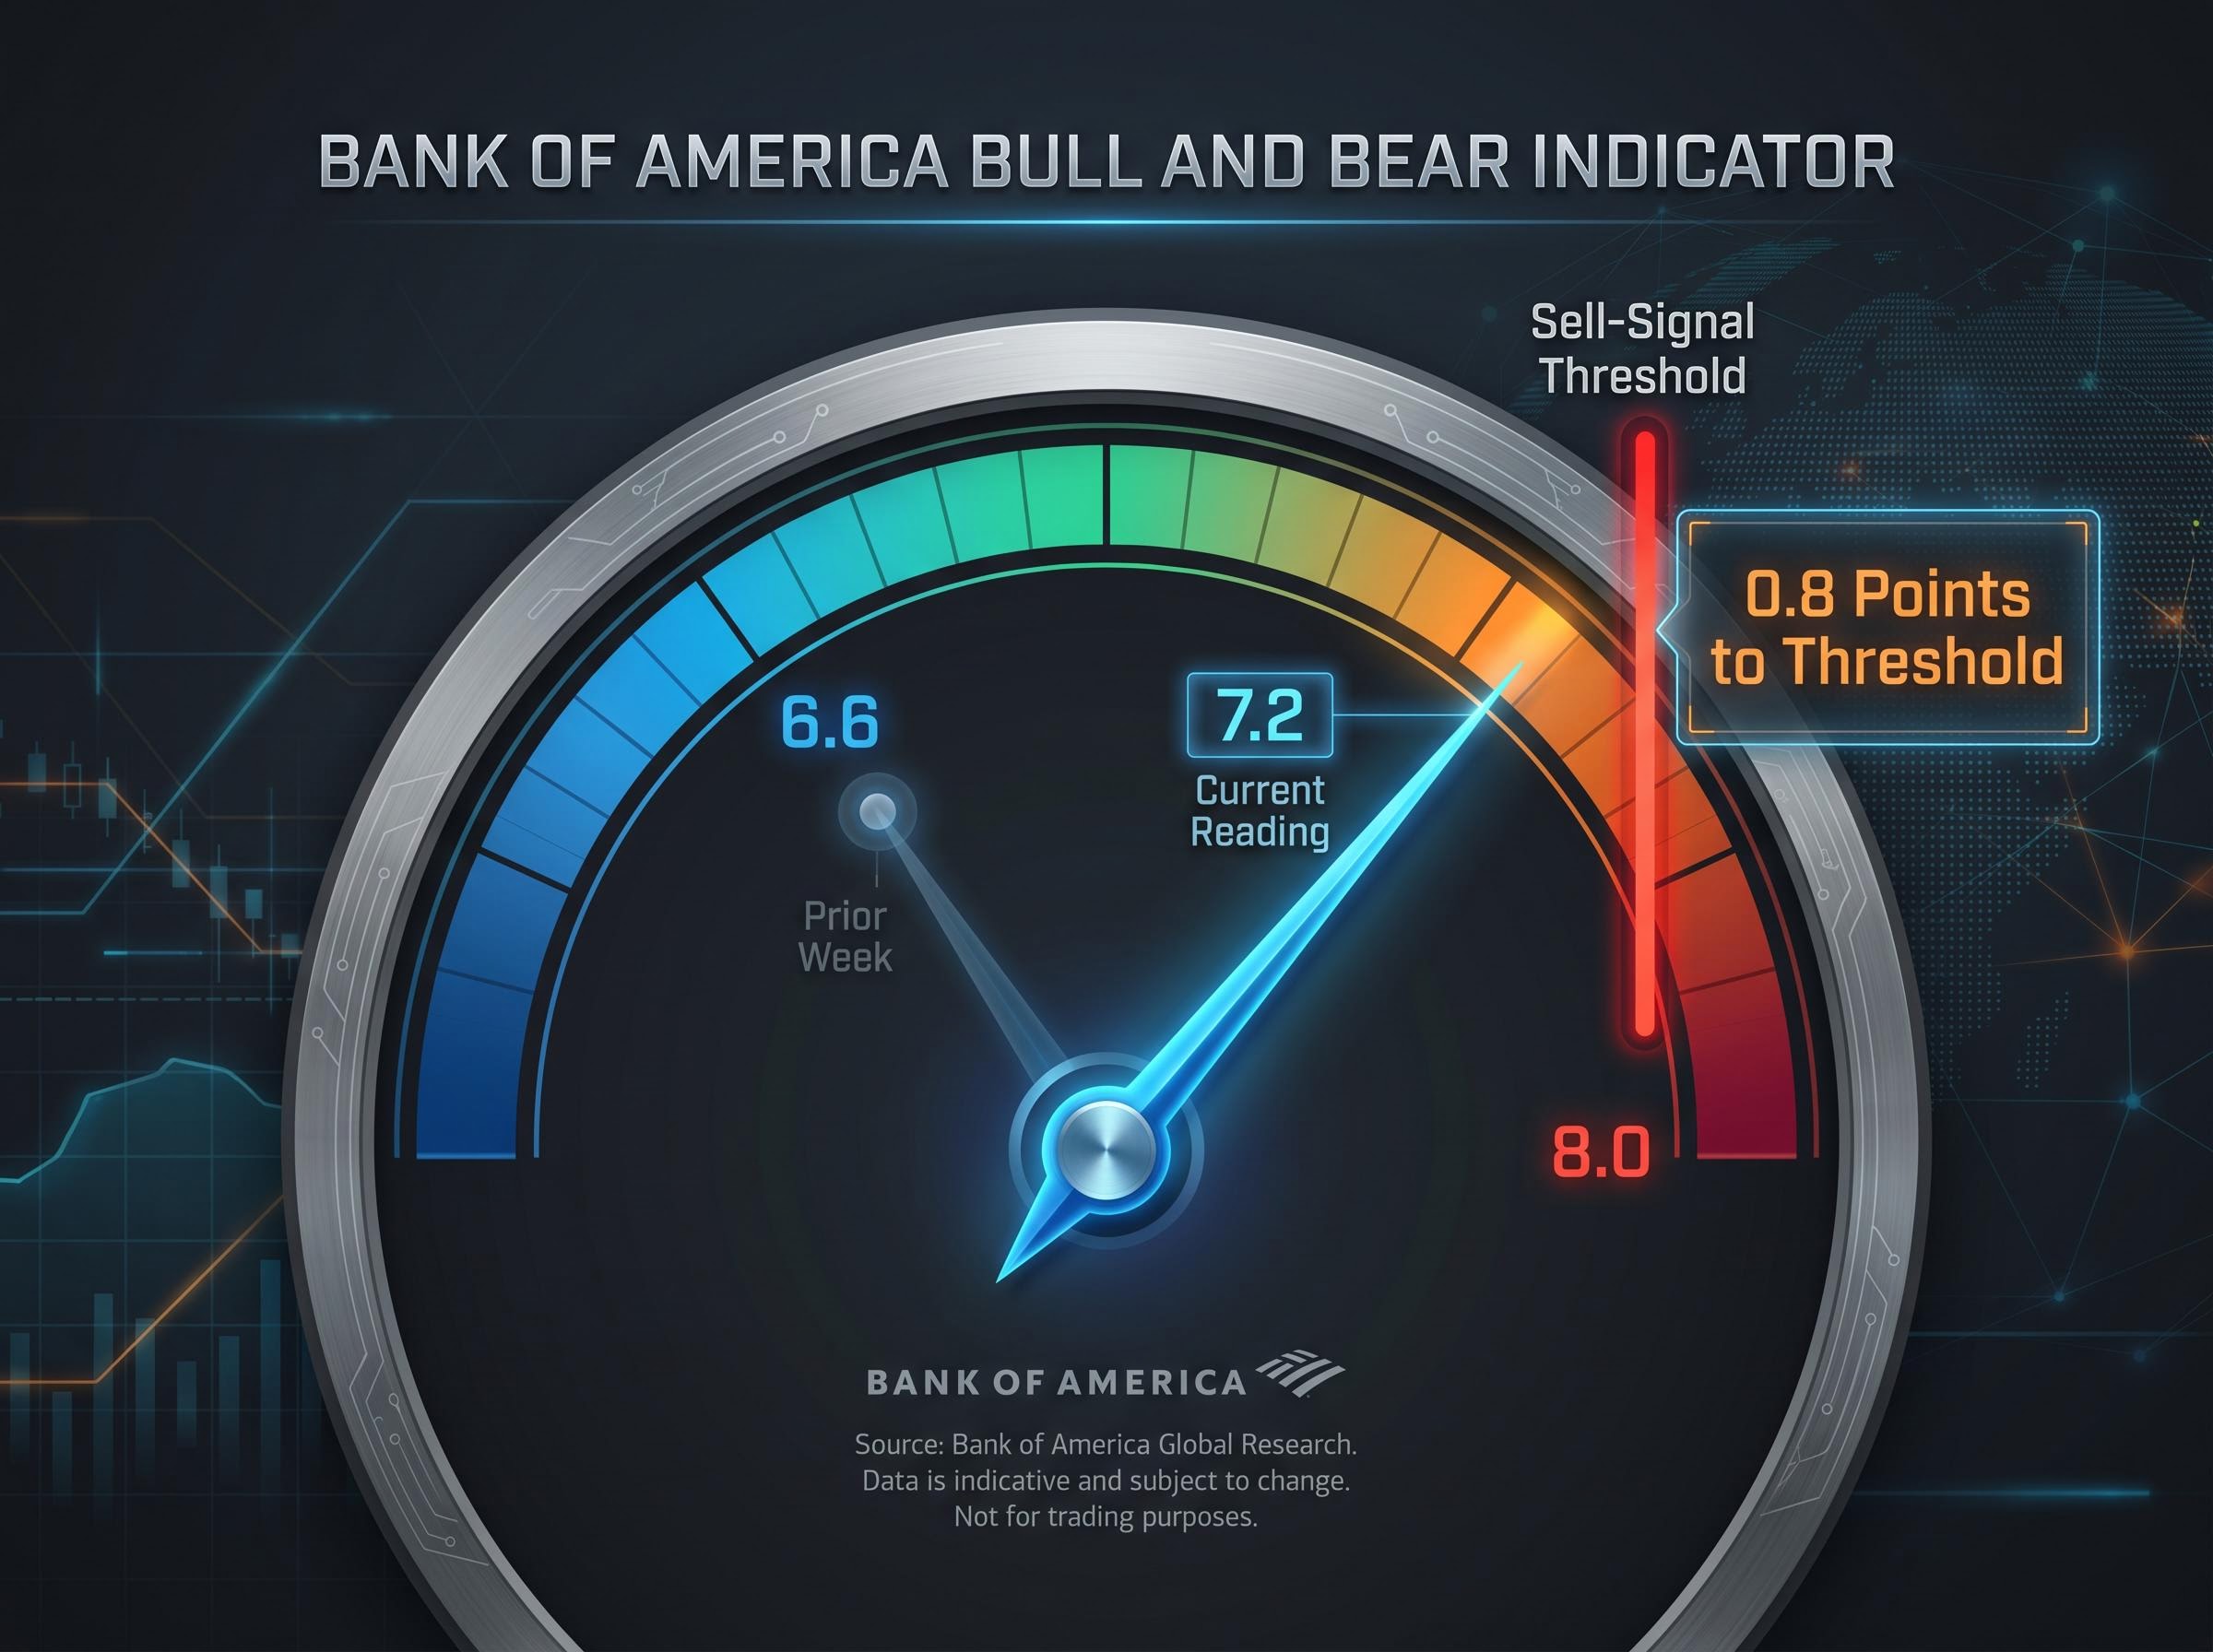
Bank of America’s Bull and Bear Indicator rose to 7.2 in the latest reading, up from 6.6 the prior week. The firm’s contrarian sell-signal threshold sits at 8.0.
The Bull and Bear Indicator at 7.2 is 0.8 points from the 8.0 sell-signal threshold. The indicator remains in elevated but not extreme territory.
The indicator aggregates multiple inputs, including fund flows, positioning data, and market breadth. The sustained 54-week bond inflow streak and the scale of cash inflows both feed into its calculation. At 6.6, the reading suggested warming sentiment. At 7.2, it signals that optimism has moved meaningfully closer to the zone where BofA’s framework historically flags tactical risk.
The gap between 7.2 and 8.0 is narrow enough to close in one or two weeks of strong equity inflows and further risk-on positioning. It is also wide enough that a reversal in flows, or a geopolitical disruption, could stall the advance. The reading does not prescribe action; it marks a proximity to a threshold that has, in prior cycles, preceded periods of elevated drawdown risk.
BofA’s Bull and Bear Indicator is not the firm’s only sentiment gauge approaching a critical threshold: the Sell Side Indicator held at 55.6% in April 2026, sitting just 1.9 percentage points below the 57.5% sell signal level, and its implied 12-month S&P 500 return of approximately 13% coexists with a warning that only 23% of index constituents outperformed the benchmark in April.
For the first time since November 2023, developed market central bank rate hikes have outpaced rate cuts. The Bank of Japan’s move to 0.75% and the broader stalling of easing cycles across developed economies have shifted the policy balance.
The April 29 FOMC dissent, where four committee members publicly diverged on the appropriate policy path for the first time in years, made the rate-hold decision significantly more informative than the rate itself: three hawkish dissenters against a single dovish one reveals a committee leaning toward further tightening, not toward the easing cycle that the prior year’s positioning had anticipated.
The macro conditions underpinning this shift are visible in the data:
These three figures describe an environment where monetary easing has stalled and, in some economies, reversed. BofA strategist Michael Hartnett has flagged this inflection as the backdrop for a specific technical risk scenario.
Hartnett has identified the NYSE composite, rather than the S&P 500, as the preferred broad market health indicator. The NYSE composite captures a wider set of listed securities, including financials, industrials, and utilities that the more technology-concentrated S&P 500 may underweight. In the current rate environment, where the policy shift affects rate-sensitive sectors disproportionately, the broader index offers a more complete picture. BofA has flagged a double-peak (double-top) formation in the NYSE composite as a near-term risk scenario, a pattern where the index approaches but fails to exceed a prior high, historically associated with subsequent pullbacks when accompanied by tightening monetary conditions.
The week ending 8 May 2026 produced a clear picture: $136 billion into cash, a 54-week bond inflow streak, $47.5 billion in cumulative China outflows over six weeks, and U.S. equity funds still attracting capital with the S&P 500 near ~7,377. The Bull and Bear Indicator sits at 7.2, 0.8 points from the sell threshold.
None of this constitutes a sell signal. All of it constitutes a monitoring framework. Three items belong on the weekly watchlist:
The market’s surface remains constructive. The capital flows beneath it are more cautious than the indices suggest. The threshold that would change the assessment is specific, measurable, and one week’s data away from either confirming or receding.
For investors wanting to translate the monitoring framework into portfolio action, our dedicated guide to investing during rate hikes covers how to recalibrate exposure toward high-margin, low-debt equities with strong pricing power, which sectors have historically held up best when developed market central banks are tightening in unison, and how to deploy dollar-cost averaging to manage volatility during a directional policy shift.
This article is for informational purposes only and should not be considered financial advice. Investors should conduct their own research and consult with financial professionals before making investment decisions. Past performance does not guarantee future results. Financial projections are subject to market conditions and various risk factors.
Fund flow analysis tracks net capital movement across asset classes, regions, and investment vehicles to reveal how institutions are positioning, functioning as a sentiment proxy rather than a direct price predictor. Sustained inflows into defensive assets like cash and bonds can signal institutional risk aversion even when equity indices appear stable.
Bank of America's Bull and Bear Indicator aggregates multiple inputs including fund flows, positioning data, and market breadth into a single sentiment reading, with a contrarian sell-signal triggered when the indicator reaches 8.0. As of the week ending 8 May 2026, the indicator stood at 7.2, placing it 0.8 points from that threshold.
Approximately $47.5 billion has left China-focused equity funds over six consecutive weeks, a cumulative and sustained directional shift that analysts distinguish from short-term noise and interpret as a structural risk-off rotation away from emerging markets. In the most recent week alone, China-focused funds recorded $9.8 billion in outflows, the same week broader emerging market equities shed $11.6 billion.
A practical approach involves comparing current figures against the prior four-to-eight-week average to distinguish signal from noise, identifying directional clusters where multiple asset classes move together, checking streak length for structural signals, and cross-referencing flows with macro context such as central bank decisions and inflation data. One important limitation is that aggregate flows can mask significant divergences between active and passive strategies.
For the first time since November 2023, developed market central bank rate hikes have outpaced rate cuts, a policy inflection that stalls the easing environment equity markets had previously anticipated. Bank of America strategist Michael Hartnett has flagged this shift as the backdrop for a potential double-peak formation in the NYSE composite, a pattern historically associated with pullbacks when accompanied by tightening monetary conditions.