How to Value Stocks When the Future Looks Nothing Like Today
23 mins ago

At approximately $375 per share, every projected return outcome for Tesla under a bear-case scenario is negative. Under a bull-case scenario, annualised returns could reach 35% over a decade. Same company, same stock, same entry price. The difference is entirely which future materialises.
Tesla’s post-Q1 2026 valuation debate is one of the most instructive live case studies in modern stock valuation analysis. With a forward price-to-earnings (P/E) ratio near 180x, negative free cash flow guidance of $7.5 billion to $9 billion for 2026, and a robotaxi service running on 30+ unsupervised vehicles across three U.S. cities, the stock is pricing in a transformation that has not yet happened. That tension between current fundamentals and future optionality is exactly where valuation gets hard, and where most investors make their most consequential errors.
This guide uses Tesla’s real numbers to teach a transferable framework: how to build bull and bear scenarios, how to stress-test the assumptions inside each, and why the price paid at entry is often the single most consequential variable in any investment decision. The methodology that follows can be applied to any company in transition, not just Tesla.
Apply a P/E ratio to Tesla’s current earnings and the output is a number that looks absurd. At roughly 180x forward earnings, the stock trades at nine to eighteen times the multiple assigned to traditional automakers like Ford and GM, which sit in the 10-20x range. It also trades at three to six times the multiple assigned to broad technology companies, which typically occupy the 30-50x band.
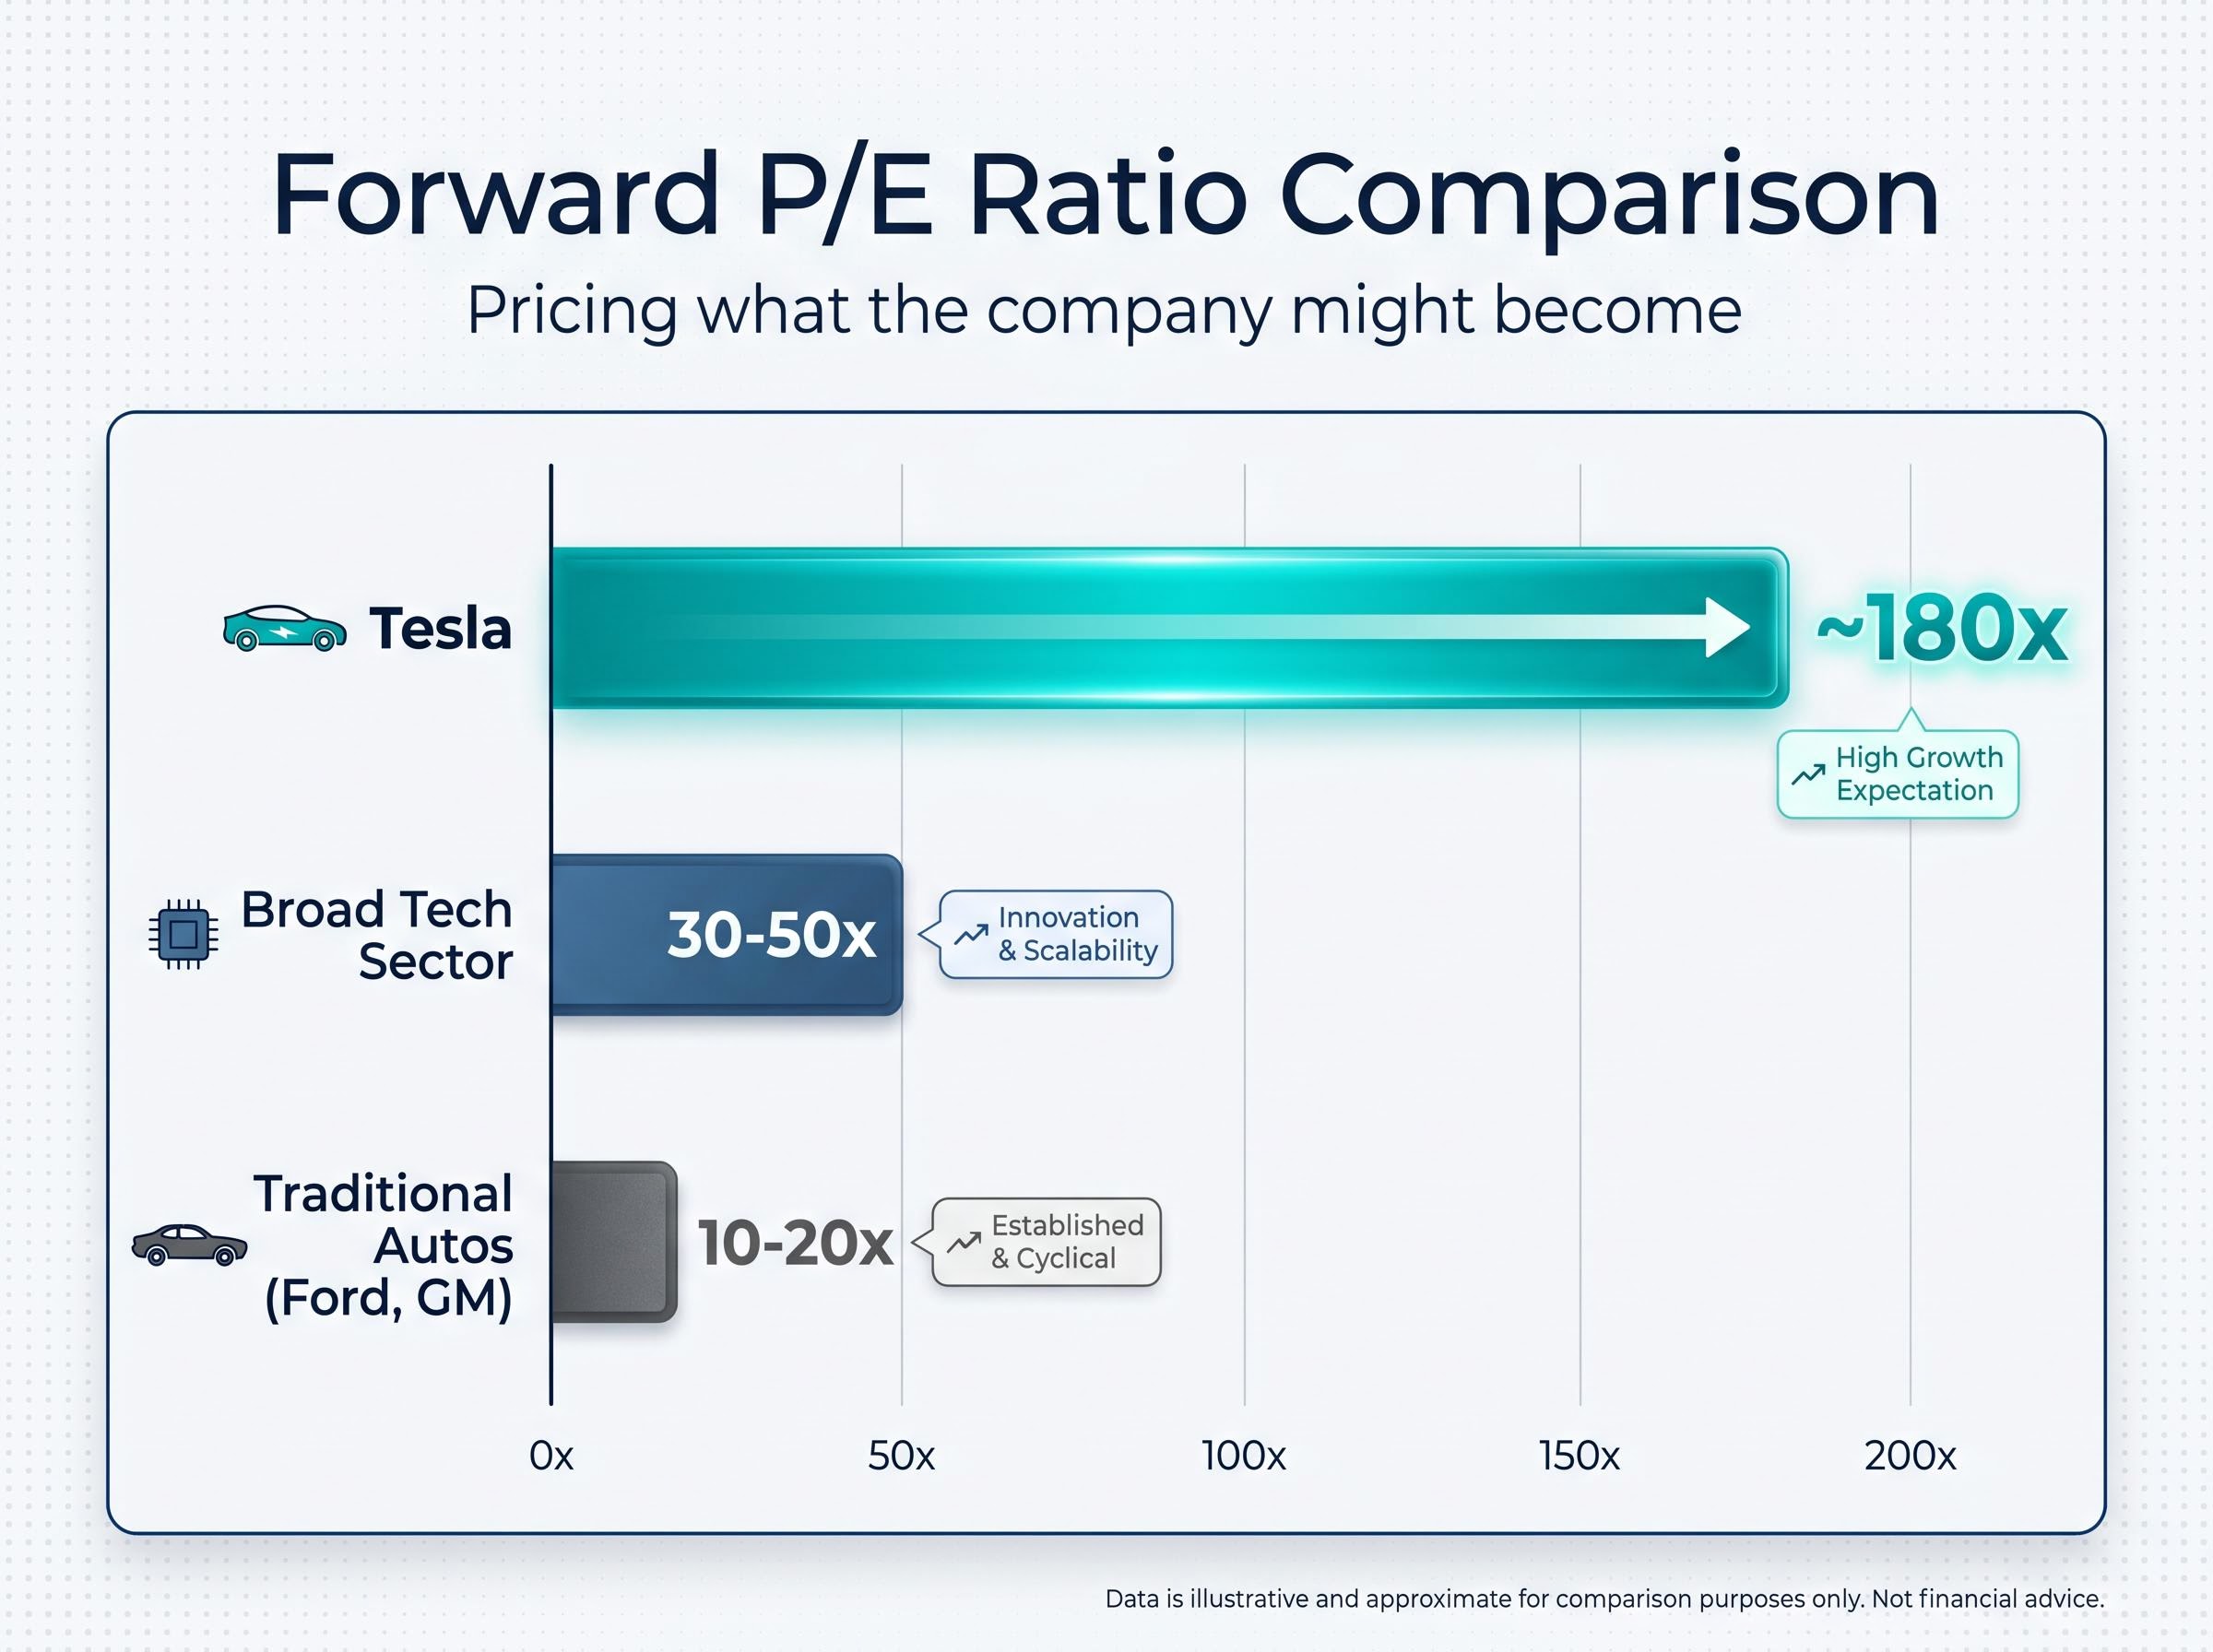
Tesla’s forward P/E of approximately 180x does not compare meaningfully to any conventional peer group, because the market is not pricing what the company earns today. It is pricing what the company might become.
That gap between present reality and projected future is where standard valuation tools break down. A single-multiple approach assumes the business the investor is valuing today resembles the business that will generate future cash flows. For a company mid-transformation, that assumption fails. Tesla’s approximately $1.3 trillion market capitalisation reflects not an automotive business but a bet on autonomous vehicles, robotics, and AI platform economics that have not yet produced material revenue.
Tesla’s 180x multiple does not exist in isolation: broad market valuation signals including the Buffett Indicator at 223.6% and a negative equity earnings yield spread versus Treasuries suggest the overall US equity market is itself pricing in a relatively optimistic future, which compresses the margin of safety across high-multiple names disproportionately.
| Peer Group | Forward P/E Range | What the Multiple Implies |
|---|---|---|
| Traditional Autos (Ford, GM) | 10-20x | Mature business, stable margins, low growth |
| Broad Tech Sector | 30-50x | Above-average growth, scalable business model |
| Tesla | ~180x | AI/robotics platform economics not yet realised |
The investor’s real job is not to decide whether 180x is too high. It is to evaluate the specific future conditions that must be met for that multiple to be justified. The sections that follow provide a framework for doing exactly that.
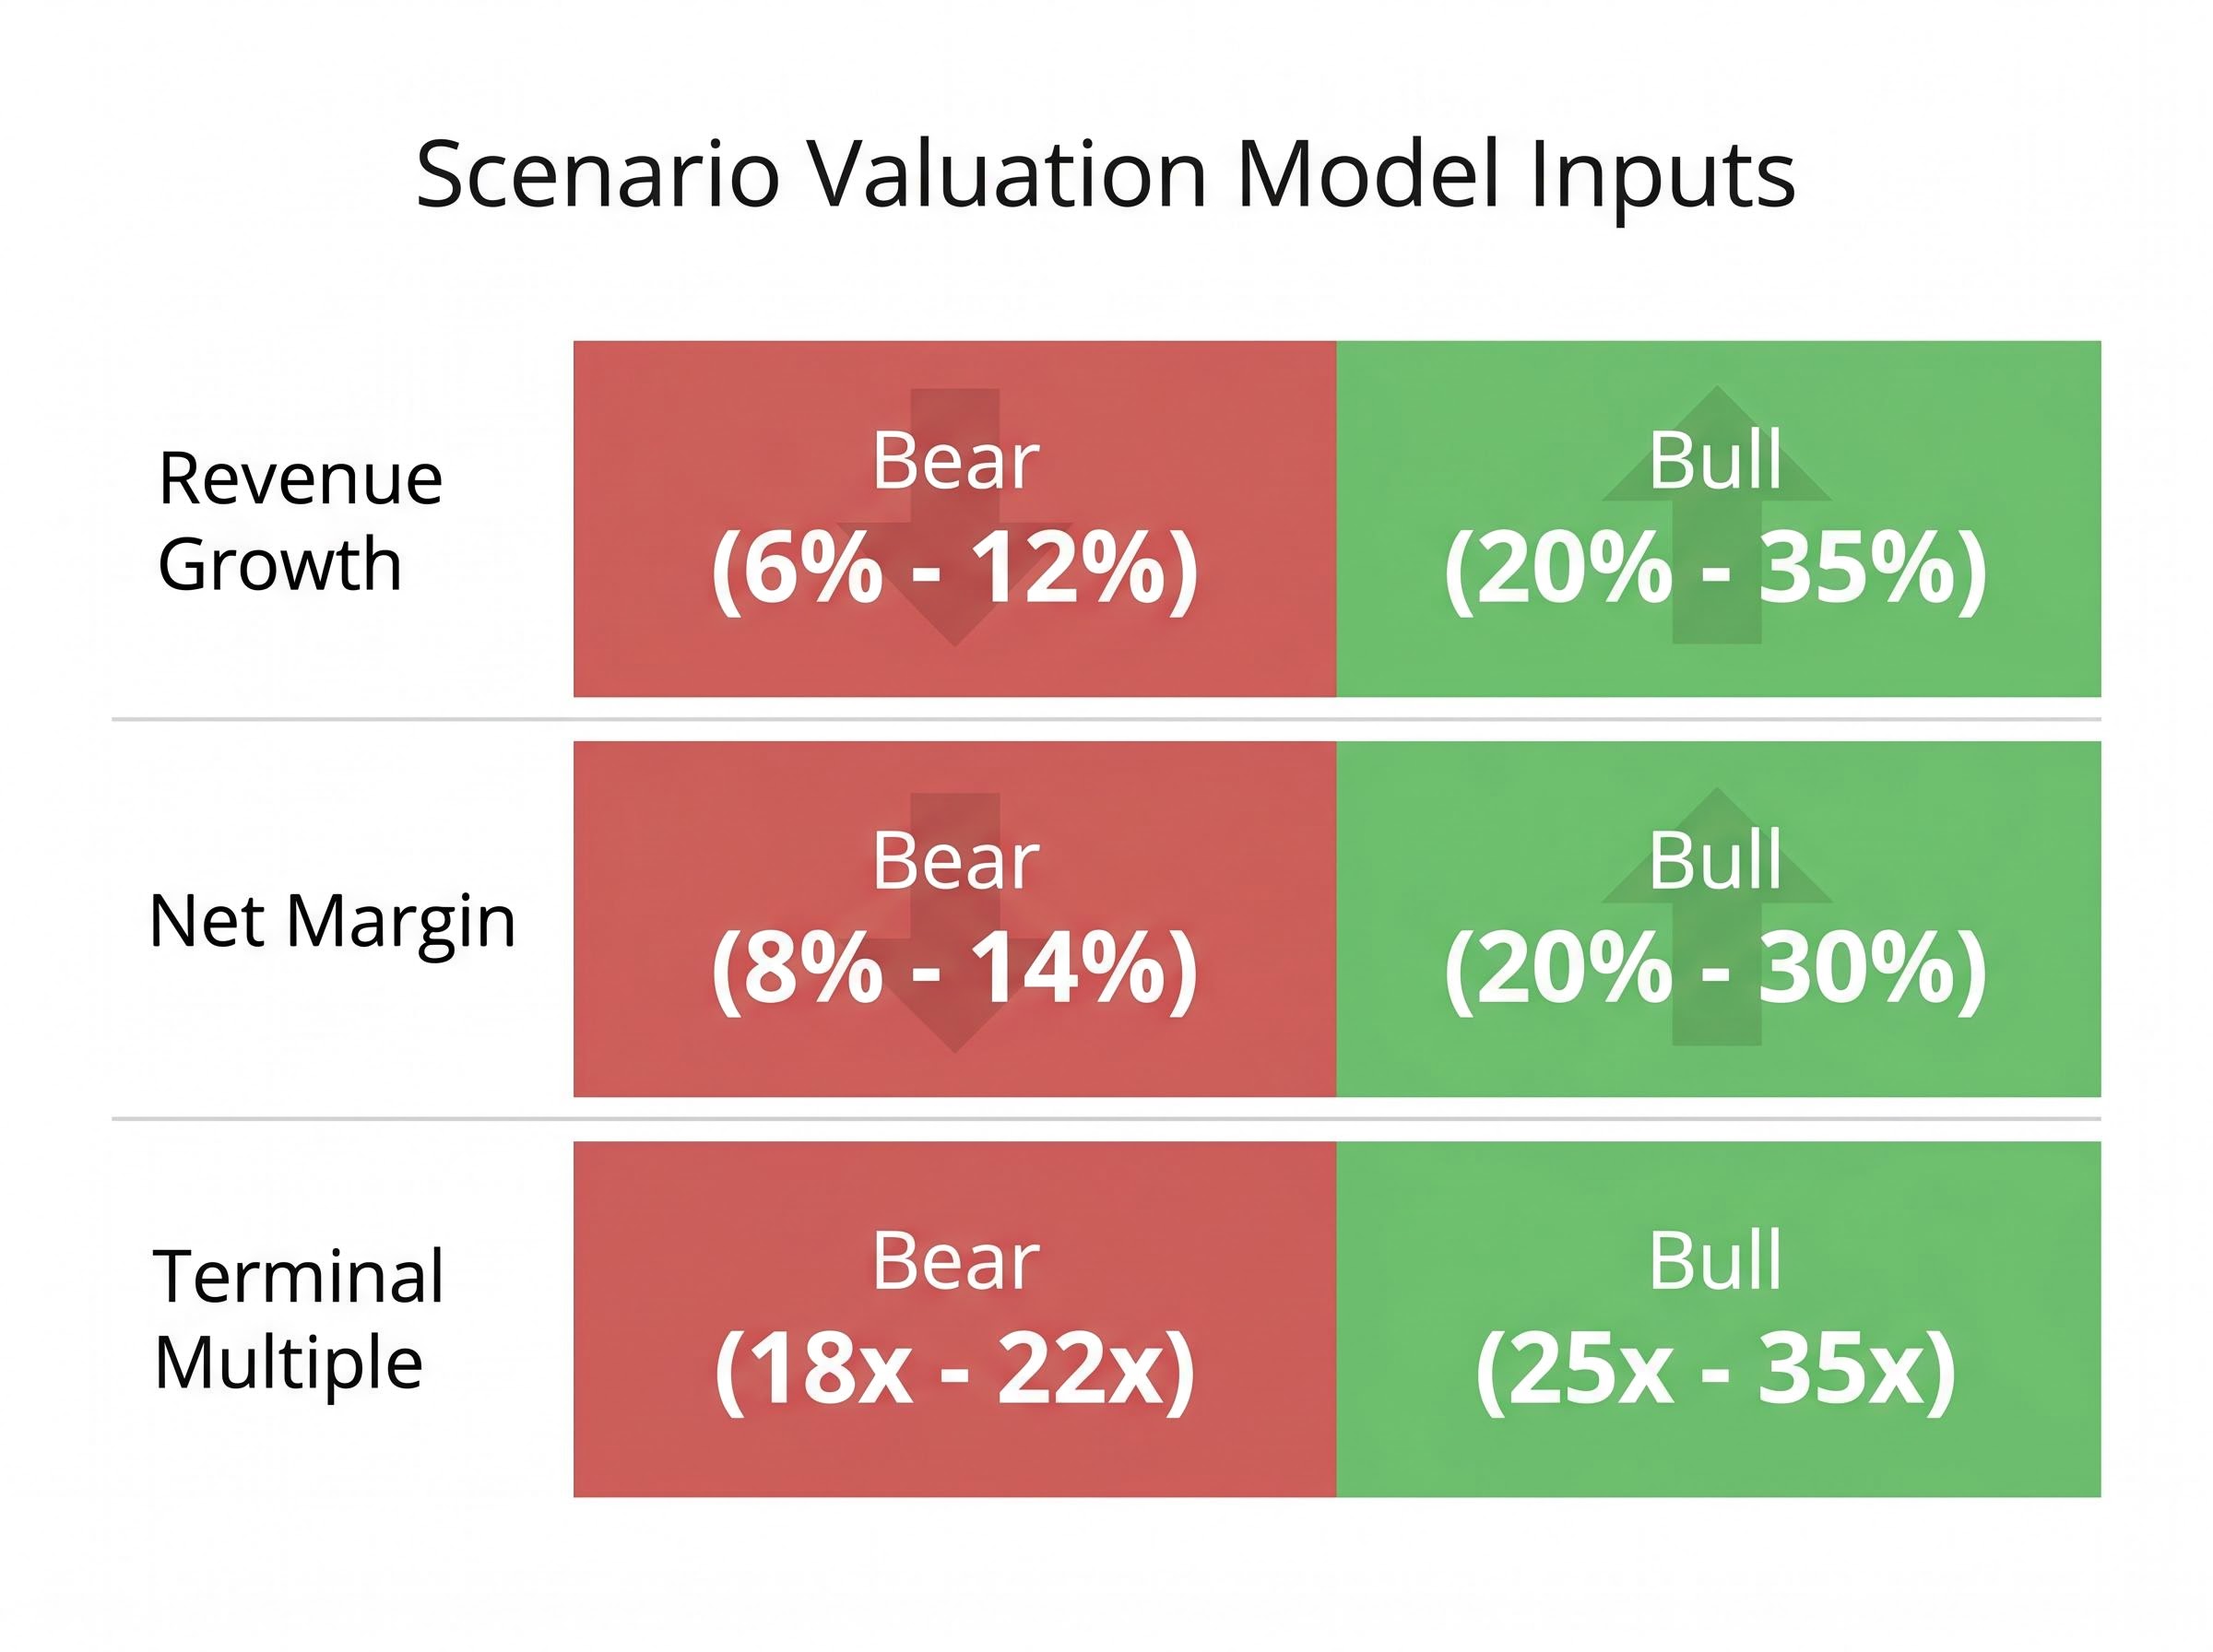
A scenario-based model is built on three input layers, each representing a distinct bet on the future. These layers are sequential: each one’s output feeds into the next, and compounding across a 10-year horizon magnifies the sensitivity of every assumption.
Each variable is not a neutral calculation. It is an assumption about a specific future condition. A 27% revenue growth rate implies successful scaling of new business lines. A 25% net margin implies platform-level economics that the company has not yet demonstrated. A 35x terminal multiple implies the market will still treat the company as a high-growth technology platform a decade from now.
Damodaran’s framework for valuing high-growth firms establishes that terminal value, operating margin assumptions, and reinvestment rates are the three variables that drive virtually all of the value in a long-horizon discounted cash flow model, which is why stress-testing each one separately is more informative than producing a single-point estimate.
| Variable | Bear Low | Bear High | Bull Low | Bull High |
|---|---|---|---|---|
| Revenue Growth | 6% | 12% | 20% | 35% |
| Net Margin | 8% | 14% | 20% | 30% |
| Terminal Multiple | 18x | 22x | 25x | 35x |
The purpose of running these scenarios is not to predict the correct outcome. It is to map the distribution of plausible returns across a range of futures. That distribution, not a single price target, is what an informed investment decision looks like.
The bull case for Tesla is not a feeling about the company’s potential. It is a specific set of factual conditions, each of which can be tracked, confirmed, or falsified over time.
For the bull-case return range of 11% to 35% annualised over a decade to materialise, three things must happen:
As of May 2026, the robotaxi service operates 30+ fully unsupervised vehicles: 20 in Austin, 3 in Dallas, and 3 in Houston. Autonomous vehicle miles driven in Q1 2026 nearly doubled versus the prior period. The AI5 chip design is in its final phase. These are real milestones. They are also a fraction of the scale the bull case requires.
Execution risk, the category of failure that sits entirely outside every scenario model, is where the bull case most commonly collapses: Tesla holds no commercial robotaxi permit in any major US market as of May 2026, while competitor Waymo had already completed approximately 2 million paid rides by March 2026, a gap that illustrates how capital spending on a future does not guarantee arrival at that future on schedule.
Bull-case probability estimate: 5%-10% for full materialisation. The annualised return range is attractive, but the likelihood of every condition being met within the projected timeframe is low, a distinction that should directly influence position sizing.
Three specific historical examples calibrate the probability assessment. In 2016, Elon Musk claimed all Tesla vehicles had full self-driving hardware. In 2019, he projected one million robotaxis on the road by 2020. In 2021, he indicated Optimus deployment was imminent.
Each claim contained a real directional insight: Tesla was building toward autonomy, ride-hailing, and robotics. Each also arrived years later than stated, if at all. This pattern does not disqualify the bull case. It does, however, shift probability weight toward a mid-case outcome, where some bull-case conditions materialise on extended timelines rather than all conditions arriving within the projected window. Investors who treat Musk’s timelines as Bayesian inputs rather than binary signals will build more accurate probability distributions.
The bear case does not require believing Tesla is a bad company. It requires only treating Tesla as a high-quality electric vehicle manufacturer with above-average margins relative to Ford and GM, but without assigning material value to autonomous driving or robotics revenue within the projection horizon.
Under bear-case assumptions:
At approximately $375 per share, every projected return outcome under bear-case assumptions is negative. This is the section’s most instructive finding: the current share price already embeds a specific amount of AI and robotics premium that must materialise for the investment to break even.
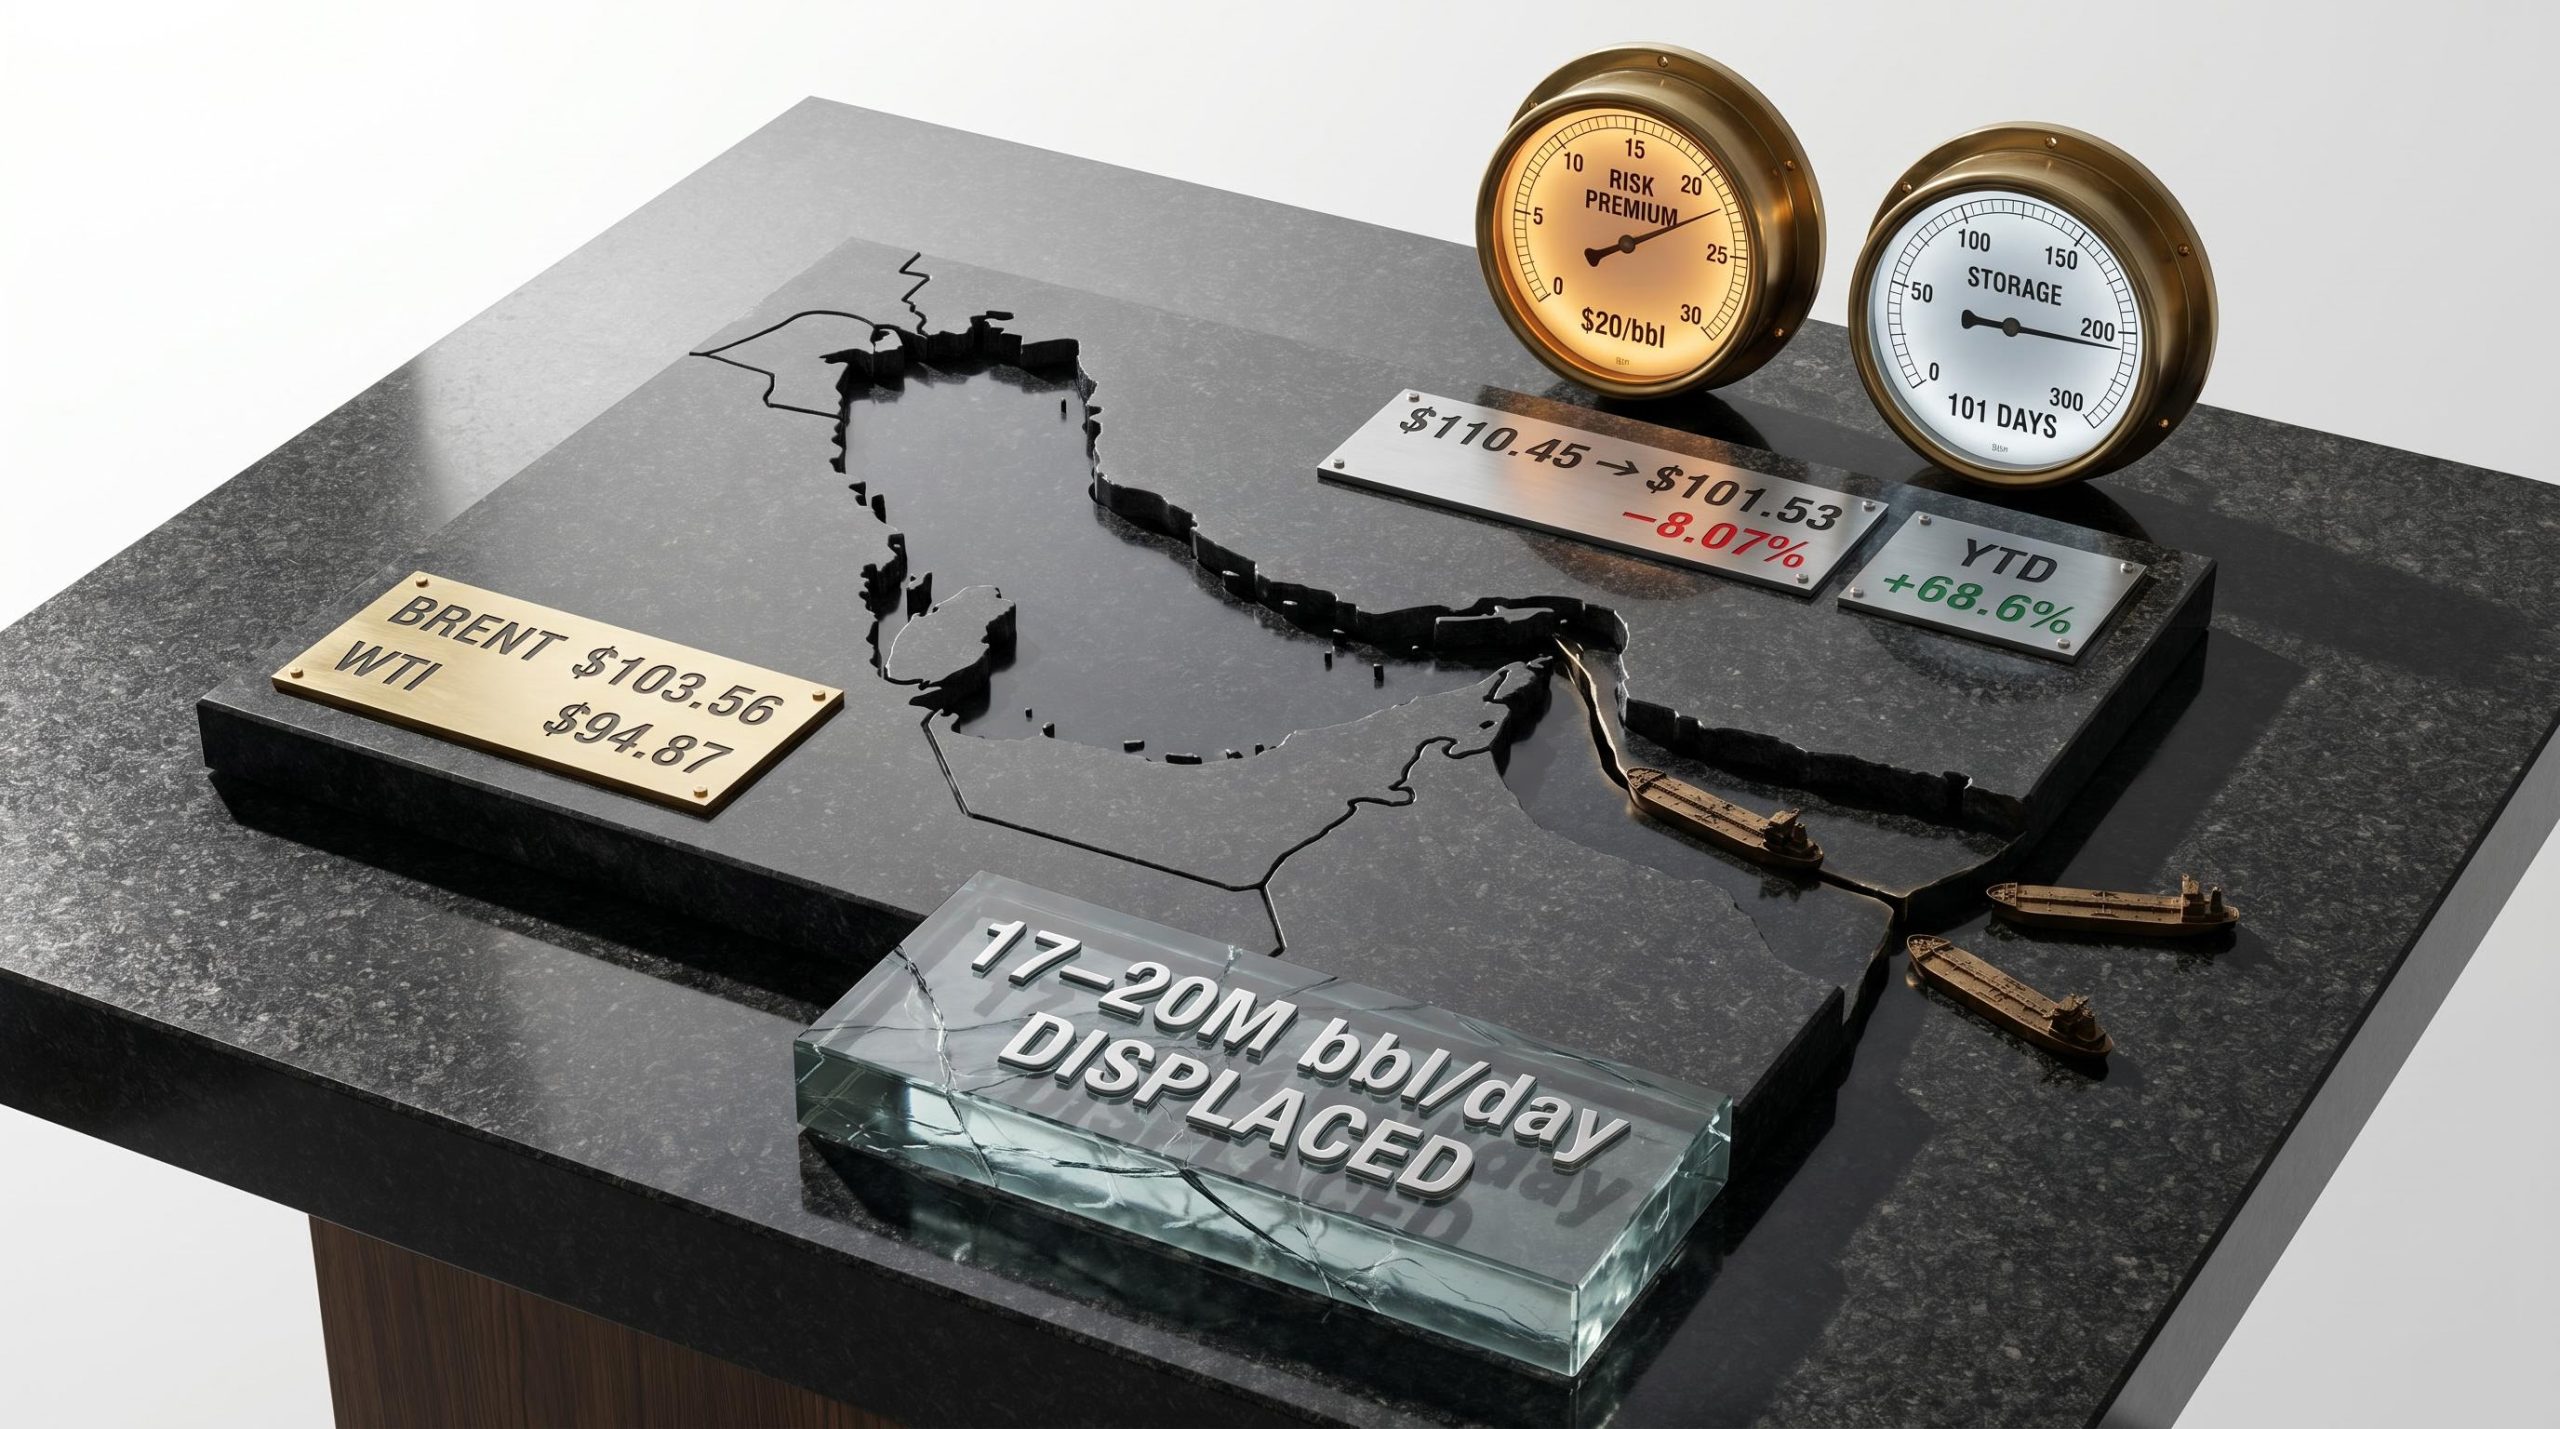
The near-term cash picture reinforces this reading. Tesla has guided for negative free cash flow of $7.5 billion to $9 billion in 2026, driven by capital expenditure of $25 billion to $30 billion directed toward AI and robotics infrastructure. The company is spending now on a future the stock price already assumes will arrive. If that future does not arrive, or arrives more slowly than priced, the investor at $375 absorbs the full downside.
The bear case makes the abstract concept of “priced-in expectations” concrete. It is not simply that Tesla is richly valued. It is that the current price has already been paid for a specific future, and the investor’s task is to decide whether they believe that future will materialise with sufficient probability to justify the entry.
Consider two investors who hold Tesla shares for the next decade, during which the underlying business performs identically. One entered at approximately $100 per share several years ago. The other entered at approximately $375-$380 in May 2026, with the stock down 17.10% year to date.
The return distribution for these two investors is dramatically different, even though they own the same company. The $100 investor can survive most bear-leaning scenarios and still generate a positive return. The $375 investor needs partial-to-full bull-case materialisation to break even.
The business did the same thing in both cases. The difference was entry price.
Three variables shape every investment outcome:
Only one of those three is a decision the investor makes. That asymmetry gives entry price disproportionate importance in risk management.
Post-Q1 analyst price targets from RBC ($475), Bank of America ($460), and Canaccord Genuity ($450) represent modest upside from May levels, not transformative returns. Forward EPS growth is projected at more than 5x from current levels, but that growth is already substantially reflected in today’s share price.
Analyst target dispersion is itself an independent risk signal that investors often underuse: a $470 spread between Wells Fargo’s $130 bear target and New Street Research’s $600 bull target on Tesla reflects genuine scenario disagreement rather than analytical error, and wide dispersion at the time of entry means the investor is choosing a scenario, not simply accepting a consensus.
Margin of safety is the gap between the current share price and a conservative estimate of what the company is worth. The wider that gap, the more scenarios an investor can be wrong about and still generate an acceptable return.
At a $100 entry price, even a purely automotive bear case, one where robotaxi and Optimus revenue never materialise, likely produces acceptable long-term returns because the investor paid a price consistent with the existing business.
At $375, the investor needs the AI and robotics transformation to generate material revenue within the projection horizon. The margin of safety has compressed to near zero under bear-case assumptions. The entry price has effectively narrowed the set of survivable futures to those where the bull case at least partially materialises.
Institutional cash accumulation at Berkshire Hathaway, which reached a record $397.4 billion as of March 2026, functions as a real-time signal that the margin of safety required for large-scale capital deployment does not yet exist across US equities broadly, a condition that reinforces why entry price discipline on individual names like Tesla matters more in this environment than in a market trading near historical valuation averages.
The three-variable framework applied to Tesla throughout this guide converts into a five-step process applicable to any company where the stock price is telling a story the fundamentals have not yet confirmed.
Tesla’s Q1 2026 results were a genuine beat: $22.4 billion in revenue (versus $22.2-$22.35 billion consensus), adjusted EPS of $0.41 (versus $0.36 consensus), and gross margins of 21.7% (versus 17% analyst estimates). These figures confirm the automotive business is stabilising. They do not, on their own, validate the AI and robotics premium embedded in the share price.
Common failure modes to watch for:
Tesla’s stock price at current levels is not primarily a bet on a car company, or even an AI company. It is a bet on the specific probability that fully autonomous vehicles and commercial humanoid robotics generate material revenue within a 10-year horizon. Most investors holding the stock have not explicitly quantified that probability, which means they are making the bet without knowing its terms.
The scenario framework outlined in this guide exists to make implicit bets explicit. Three variables, two scenarios, one entry price, and an honest probability estimate produce a return distribution that tells the investor what they are actually paying for.
Investors who identify the transformation thesis, stress-test both scenarios rigorously, and choose their entry price with the full return distribution in mind will make better decisions, not just on Tesla but on every company in transition they encounter.
The practical next step: apply the three-variable scenario framework to one stock in an existing portfolio that may be pricing in a future that has not yet arrived. Calculate the return under both bull and bear assumptions at today’s entry price. Assess whether the margin of safety is wide enough to survive the bear case. If it is not, the position size should reflect that honestly.
This article is for informational purposes only and should not be considered financial advice. Investors should conduct their own research and consult with financial professionals before making investment decisions. Past performance does not guarantee future results. Financial projections are subject to market conditions and various risk factors.
Scenario-based stock valuation analysis builds separate bull and bear projections across three key variables: revenue growth rate, net profit margin, and terminal valuation multiple. Running both scenarios at the current entry price produces a return distribution that shows what the investor is actually paying for, rather than relying on a single price target.
A single P/E multiple assumes the business being valued today resembles the business that will generate future cash flows, but for a company mid-transformation that assumption fails. Tesla's 180x forward P/E cannot be meaningfully compared to traditional automakers at 10-20x or broad tech at 30-50x because the market is pricing future platform economics that have not yet produced material revenue.
Two investors holding the same stock for the same period can experience dramatically different returns based solely on their entry price. An investor who entered Tesla at around $100 can survive most bear-leaning scenarios and still generate a positive return, while an investor entering at $375 needs partial-to-full bull-case materialisation just to break even.
The bull case can be tracked through three specific conditions: commercial-scale deployment of fully autonomous driving with recurring software and ride-hailing revenue, expansion of the robotaxi network beyond its current 30-plus vehicle footprint in three cities, and the transition of the Optimus humanoid robot from prototype to commercial availability projected for 2027.
Wide dispersion between analyst price targets signals genuine scenario disagreement rather than analytical error. For Tesla, a spread from $130 (Wells Fargo bear target) to $600 (New Street Research bull target) means an investor choosing a current entry price is effectively selecting a scenario, not accepting a consensus view, which makes honest probability assignment critical to position sizing.