
How to Analyse Any High-Multiple Stock Using Tesla as a Case Study
22 mins ago

At roughly $412 per share in early May 2026, Tesla trades at approximately 188 times trailing earnings. Whether that price represents a bargain or a trap depends almost entirely on which version of Tesla’s future an investor believes in.
Tesla’s Q1 2026 earnings release delivered two contradictory signals simultaneously: revenue of $22.39 billion (slightly below the $22.64 billion consensus) but gross margin of 21.7%, substantially above the 17% analysts had modelled. The company guided toward more than $25 billion in capital expenditures for the year, directed at robotaxi infrastructure, the Optimus humanoid robot programme, and AI compute. That combination of better-than-expected profitability and aggressive spending on unproven business lines is precisely the kind of ambiguous data that makes stock valuation analysis genuinely difficult. Wall Street’s current price targets range from $85 to $500, a spread that reflects not analyst incompetence but a direct consequence of how much the answer depends on assumptions rather than facts.
This guide uses Tesla’s specific numbers as a teaching vehicle to walk through the mechanics of bull-and-bear scenario analysis: how to build the cases, what variables drive the gap between them, and why the price paid at entry may be the most consequential decision an investor makes.
The instinct is reasonable: look at the price-to-earnings ratio, compare it to peers, and decide if the stock is expensive. For Tesla at 188x trailing earnings, the answer appears obvious. Ford and General Motors trade at roughly 3-6x EV/EBITDA (enterprise value divided by earnings before interest, taxes, depreciation, and amortisation). Tesla looks absurdly overvalued.
The problem is that trailing P/E ratios produce misleading signals when a company’s earnings base is artificially suppressed by transition-period capital spending rather than structural weakness. Tesla is spending more than $25 billion this year on infrastructure for businesses that do not yet generate revenue. That spending compresses current earnings, inflating the P/E multiple without necessarily indicating overvaluation.
Growth stock valuations across the broader market have compressed significantly in 2026, with Morningstar data showing a 21% discount to fair value as of late March, a level reached less than 5% of the time since 2011, which means Tesla’s elevated multiple is not just an idiosyncratic phenomenon but part of a wider repricing of high-multiple equities under stagflationary macro conditions.
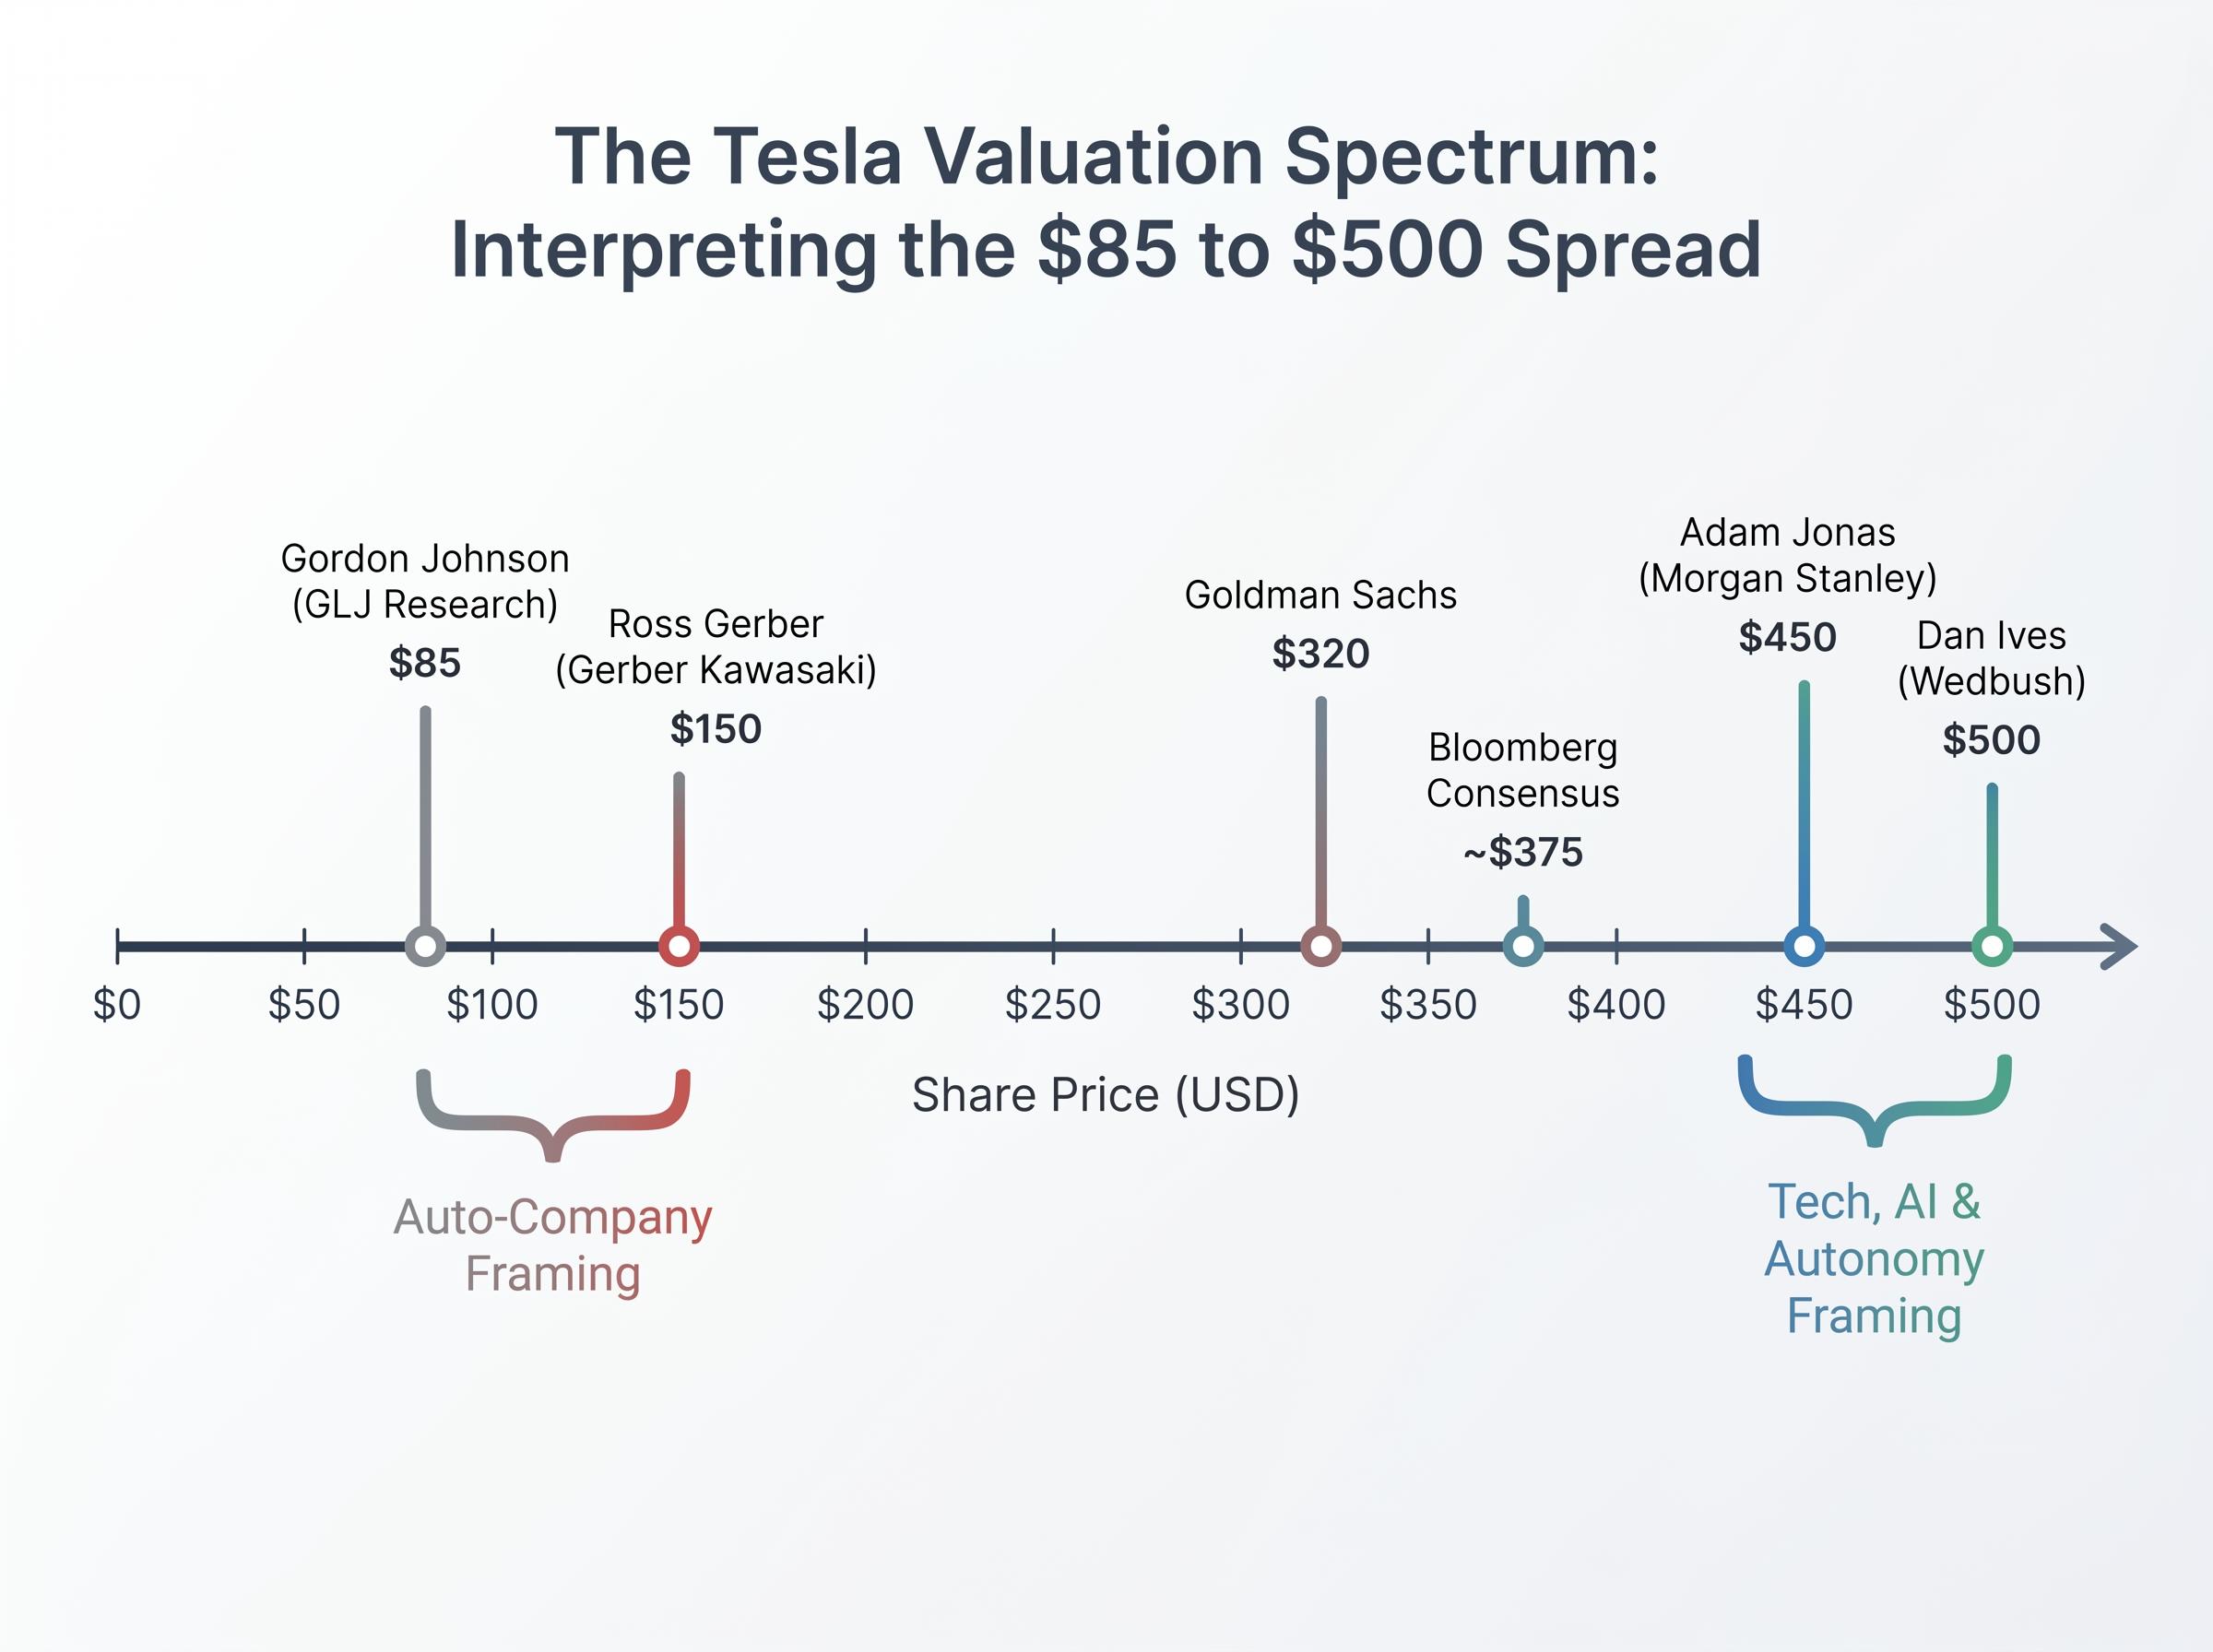
This is why two analysts can look at the same company and reach wildly different conclusions without either being irrational. Goldman Sachs applies 8x 2026 sales, an auto-sector framing, and arrives at a $320 price target. Wedbush’s Dan Ives applies 15x 2027 sales, a tech/AI framing, and reaches $500. The gap is not a math error. It is a disagreement about what kind of company Tesla is becoming.
| Valuation Framework | Metric Used | Auto-Sector Application | Tech/AI Application |
|---|---|---|---|
| Revenue multiple | EV/Sales | 5-10x (Ford, GM range) | 15-30x (high-growth tech) |
| Earnings multiple | Forward P/E | 8-15x (mature auto) | 30-50x (AI/software) |
| Cash flow | EV/EBITDA | 3-6x (capital-intensive) | 20-40x+ (asset-light tech) |
A single-point valuation is insufficient for companies in mid-transformation. Scenario weighting is the intellectually honest alternative. The CFA Institute’s 2026 curriculum now mandates scenario trees for stocks trading above 30x P/E, a formal acknowledgement that point estimates fail under this level of uncertainty.
The sum-of-parts approach addresses this by valuing each business segment on its own appropriate multiple, then aggregating. Morgan Stanley’s Adam Jonas applies a hybrid model: 60% AI/autonomy weighting and 40% auto weighting, arriving at a $450 target using 40x 2027 EV/EBITDA for the AI-weighted portion.
Wedbush takes this further, separately valuing Tesla’s auto business at approximately $200 billion and its AI/autonomy segment at over $1 trillion. Whether those individual valuations are reasonable is precisely the question scenario analysis is designed to answer.
Three variables drive every valuation model for a transitional company: projected revenue growth rate, net profit margin assumption, and exit valuation multiple. These are not independent dials. They form a connected system where each variable constrains the others.
A 35% annual revenue growth rate, for instance, is only consistent with a margin profile that reflects pricing power and scale advantages. A 6% growth rate implies competitive commoditisation that would compress the exit multiple the market assigns. Bull and bear cases are not optimistic or pessimistic attitudes; they are coherent narratives about how these three variables interact.
The discounted cash flow (DCF) model is the standard tool for translating these assumptions into a price. In accessible terms, the process works as follows:
The present-value foundations of equity valuation, established by John Burr Williams in 1938 and refined through decades of institutional practice, explain why a dollar of earnings three years from now is worth less than a dollar today, the core logic that makes discount rate selection so consequential in any DCF model.
Damodaran’s DCF framework for high-growth firms addresses precisely this challenge, establishing that terminal value assumptions and discount rate selection carry disproportionate weight in valuations where near-term cash flows are compressed by capital spending rather than structural weakness.
For companies like Tesla, where the range of plausible outcomes is exceptionally wide, a single DCF output is misleading. This is where probability weighting becomes necessary.
Damodaran’s principle: “Don’t average, probabilise.” Each scenario should be internally consistent, its own narrative, rather than a mechanical adjustment of a single base case. Assigning a probability to each scenario and calculating the weighted average produces a more honest expected value than picking one scenario and committing to it.
Aswath Damodaran of NYU Stern (in his January 2026 YouTube series update) assigns Tesla three probability-weighted scenarios: bull at 40% (AI dominance, intrinsic value approximately $800), base at 40% (hybrid growth), and bear at 20% (auto slowdown, intrinsic value approximately $150). The weighted average becomes his best estimate of fair value.
ARK Invest takes a different approach, running one million Monte Carlo simulations on robotaxi and Optimus total addressable market assumptions. The 25th percentile result lands around $400, suggesting that even in below-median outcomes, ARK’s model supports current price levels.
McKinsey’s “Optionality Ladder” framework (published in Harvard Business Review, April 2026) offers a third variation: stage-gate valuation that treats near-term auto cash flows as one component and AI milestone-linked option value as another, only adding the option value as specific milestones are achieved.
These are the same tools used by professional portfolio managers. Understanding the input structure demystifies price targets and allows investors to evaluate analyst assumptions rather than simply accepting conclusions.
The bull case for Tesla at $412 is not cheerleading. It is a specific set of mathematical requirements. If those requirements are met, the stock could deliver strong long-term returns. The question is whether the requirements are plausible.
The assumptions that generate positive 10-year returns from current levels cluster around three variables:
| Variable | Bull Case Range | Midpoint | Current Baseline |
|---|---|---|---|
| Revenue growth (annualised) | 20-35% | ~27% | ~6% YoY (Q1 2026) |
| Net profit margin | 20-30% | ~25% | ~7-10% (trailing) |
| Exit multiple (P/E) | 25-35x | ~30x | ~188x (trailing) |
| Implied annualised return | 11-35% | ~20% |
For those numbers to materialise, three operational milestones would need to be achieved:
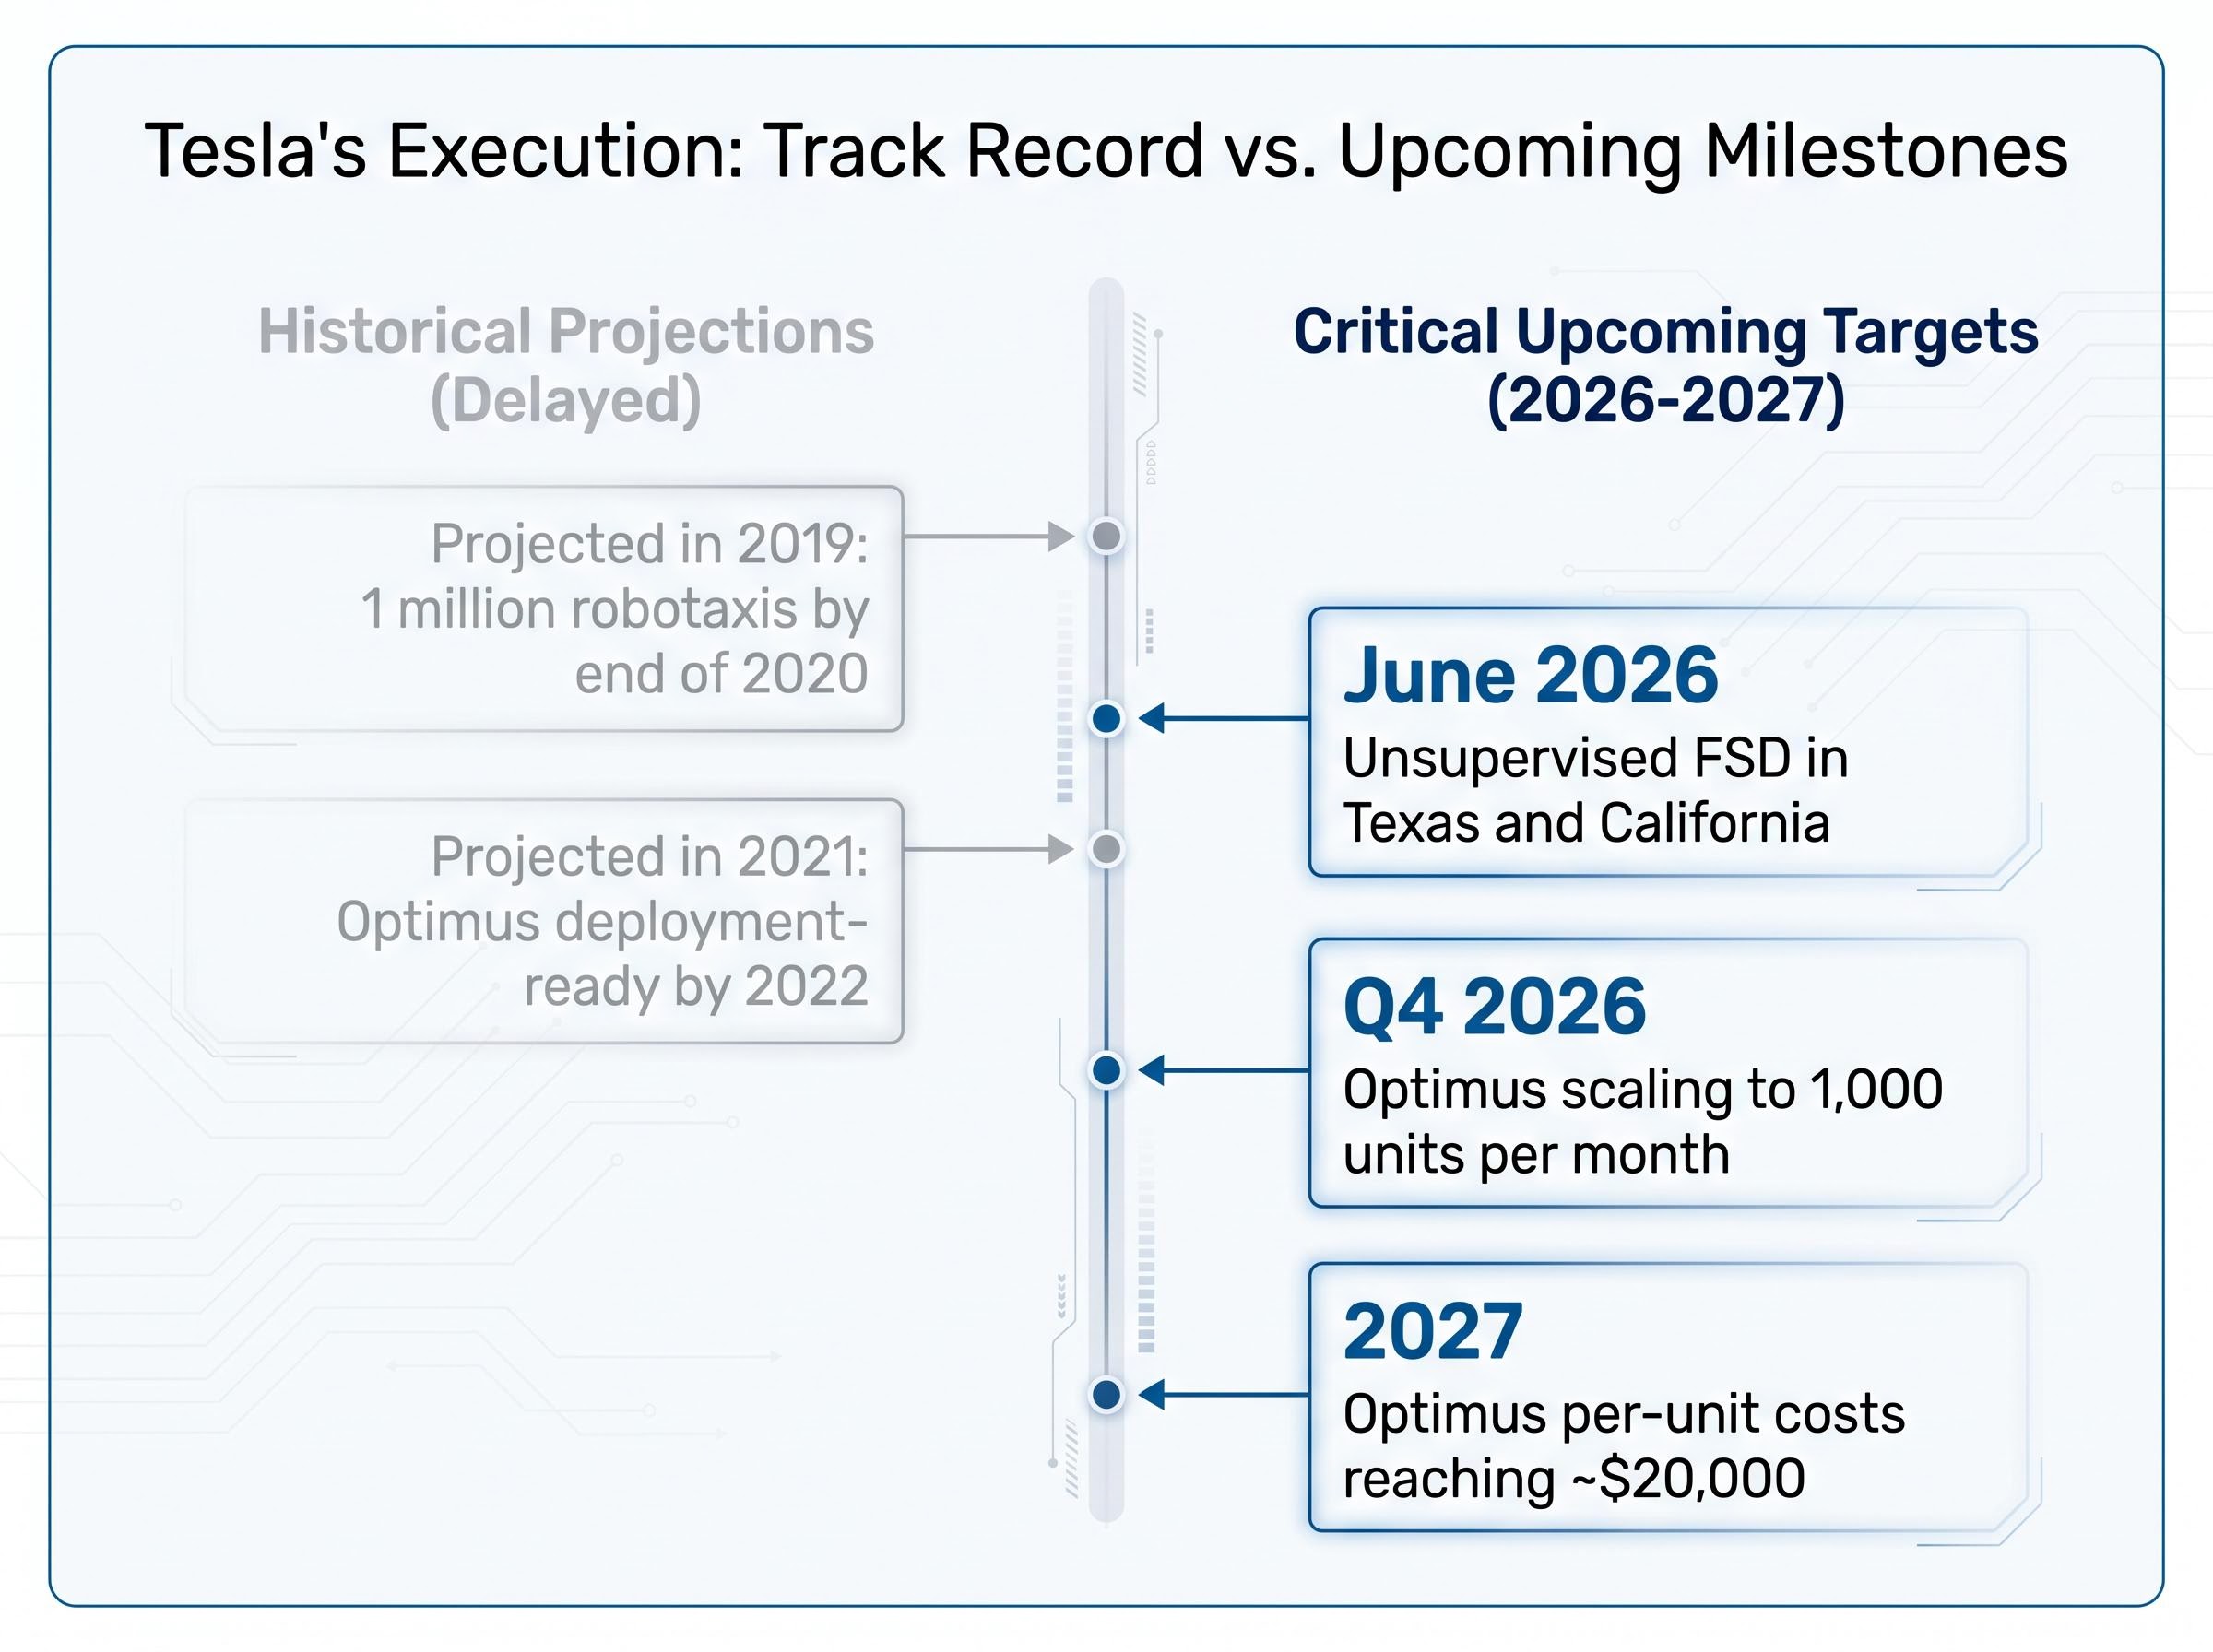
Execution credibility is the central question. Musk committed on 5 May 2026 (via an X post, echoed in Barron’s on 6 May 2026) to unsupervised FSD in Texas and California by June 2026. His track record involves eventual delivery on ambitious targets combined with consistent timeline slippage. In 2019, he projected one million robotaxis by the end of 2020. Optimus was described as deployment-ready by 2022 (stated in 2021). Neither materialised on schedule.
The bull case is internally coherent and not irrational. Forward EPS estimates project more than 5x growth from current levels, which is what justifies current pricing to bull investors. The question is whether the probability of delivery warrants the premium already embedded in the stock price.
The bear case is not a prediction that Tesla fails. It is a framework for understanding what premium the current share price has already embedded, and what happens to returns if that premium proves unjustified.
Under the bear scenario, Tesla remains a strong EV company but does not generate meaningful AI or robotics revenue within the forecast period. The assumption ranges look like this:
| Variable | Bear Case Range | Midpoint | Implied Return |
|---|---|---|---|
| Revenue growth (annualised) | 6-12% | ~9% | All projected returns negative from ~$375+ entry |
| Net profit margin | 8-14% | ~11% | |
| Exit multiple (P/E) | 18-22x | ~20x |
At approximately $375 per share (the Bloomberg consensus level), all projected returns under the bear case are negative, even assuming Tesla remains a competitively strong EV business. At the current $412 level, the loss deepens further.
The execution risks that underpin this scenario are not hypothetical. Q1 2026 deliveries came in at 358,023 vehicles against an approximate 370,000 consensus expectation. Revenue of $22.39 billion missed the $22.64 billion consensus. The NHTSA probe into FSD v12.5 incidents remains ongoing as of 28 April 2026, and Tesla has not received full robotaxi operating approvals in California or any other major market.
Execution risk in autonomous vehicle deployment sits outside every scenario model and must be assessed as a separate qualitative layer; Waymo had completed approximately 2 million paid rides by March 2026 while Tesla held no commercial robotaxi permit in any major US market, a competitive gap that bear case analysts argue the current share price treats as already resolved.
The $25 billion capex guidance creates additional pressure. At that spending level, free cash flow is likely to remain negative through the investment cycle, meaning Tesla is consuming cash to build businesses that have not yet proven commercial viability. BYD’s competitive pressure on core automotive margins adds a structural challenge to the segment that currently generates all of the company’s revenue.
Gordon Johnson of GLJ Research maintains an $85 price target. Ross Gerber of Gerber Kawasaki targets $150, describing Tesla as “an overvalued auto company” in a 4 May CNBC interview. These are not fringe voices; they represent a coherent reading of a company whose EPS estimates declined more than 90% from peak before recovering, illustrating just how volatile earnings-based valuation can be for transitional businesses.
The same company at different entry prices produces dramatically different outcomes, even if the underlying business evolves identically.
Tesla shares were available at approximately $100 per share a few years prior to the current $412 level. An investor who bought at $100 can absorb a significant amount of execution disappointment and still earn a reasonable return. An investor who buys at $412, near the prior peak of approximately $450, needs nearly every bull case assumption to materialise just to match a market-rate return.
This is the principle of margin of safety in practice. Buying at a price that leaves room for the scenario to partially disappoint and still generate acceptable returns is not a conservative temperament; it is an arithmetic necessity when the range of outcomes is wide.
The CFA Institute’s margin of safety framework traces the concept to Benjamin Graham’s original formulation, establishing that the gap between intrinsic value and entry price is not a conservative preference but a quantitative buffer against the irreducible uncertainty in any forward-looking valuation model.
The Bloomberg analyst consensus sits at approximately $375, implying roughly 15% downside from the current $412 level as of early May 2026. That consensus itself is the probability-weighted midpoint of dramatically divergent views. The market is not telling investors that Tesla is worth $375; it is telling them that the average of very different beliefs about Tesla’s future converges around that number.
This framework applies beyond Tesla to any company where the market is pricing a transformation that has not yet occurred. Before buying any high-multiple transitional stock, three questions clarify the risk:
The CFA Institute’s 2026 guidance recommends explicit probability weighting for all stocks trading above 30x P/E, a formal recognition that single-point estimates are insufficient for this category of investment.
Markets do not price companies on current fundamentals alone. They price probability-weighted futures. The $85-to-$500 range on Tesla is not confusion; it is the market’s way of expressing that the same set of facts supports genuinely different conclusions depending on which future an investor assigns the highest probability.
The methodology taught in this guide, scenario construction, variable identification, probability weighting, and entry-price sensitivity, applies to any company where a transformation is priced in but not yet delivered. Tesla is the current case study, but the framework is transferable.
Specific milestones in Tesla’s 2026-2027 roadmap will tell investors whether the bull case is narrowing or widening: the June 2026 unsupervised FSD commitment, Q4 2026 Optimus production scaling, and whether the $25 billion capex cycle begins generating measurable returns. None of these outcomes can be predicted with confidence. What can be done is to identify them in advance and update scenario probabilities as evidence arrives.
The starting point is to apply this three-variable framework (revenue growth, margin, and exit multiple) to one transitional company already in a portfolio, build the bull and bear cases, assign probabilities, and evaluate whether the entry price provides any margin of safety. The arithmetic often reveals more than conviction alone.
For investors wanting to model the AI and robotics segments separately from Tesla’s automotive base using a full sum-of-parts structure, our dedicated guide to sum-of-parts valuation for high-optionality stocks walks through the methodology with Tesla’s Q1 2026 numbers, including the next concrete reassessment catalysts: the Q2 2026 delivery report, California permitting decisions, and Optimus commercial deployment milestones.
This article is for informational purposes only and should not be considered financial advice. Investors should conduct their own research and consult with financial professionals before making investment decisions. Past performance does not guarantee future results. Financial projections are subject to market conditions and various risk factors.
Scenario-based stock valuation analysis is a method of assigning probability-weighted bull, base, and bear cases to a company's future performance rather than relying on a single point estimate, producing a more honest expected value when outcomes are highly uncertain.
Tesla's trailing P/E of approximately 188x reflects heavy capital spending on unproven AI, robotaxi, and robotics businesses that suppress current earnings; analysts disagree on whether to value it as an auto company or a tech and AI platform, producing price targets ranging from $85 to $500.
The three core variables are projected revenue growth rate, net profit margin assumption, and exit valuation multiple; these are interconnected, meaning each variable constrains the plausible range of the others in any coherent bull or bear scenario.
Entry price is critical because the same underlying business produces dramatically different investor returns depending on the price paid; buying at $412 near prior peaks requires nearly every bull case assumption to materialise just to match a market-rate return, while a lower entry price provides a margin of safety if the thesis is only partially correct.
The margin of safety is the gap between a stock's intrinsic value estimate and its entry price, providing a quantitative buffer against forecasting errors; originally formulated by Benjamin Graham, it means buying at a price where partial disappointment in the thesis still allows acceptable returns.


