
Why a Rising AUD Is Quietly Eroding Your International ETF Returns
5 hrs ago

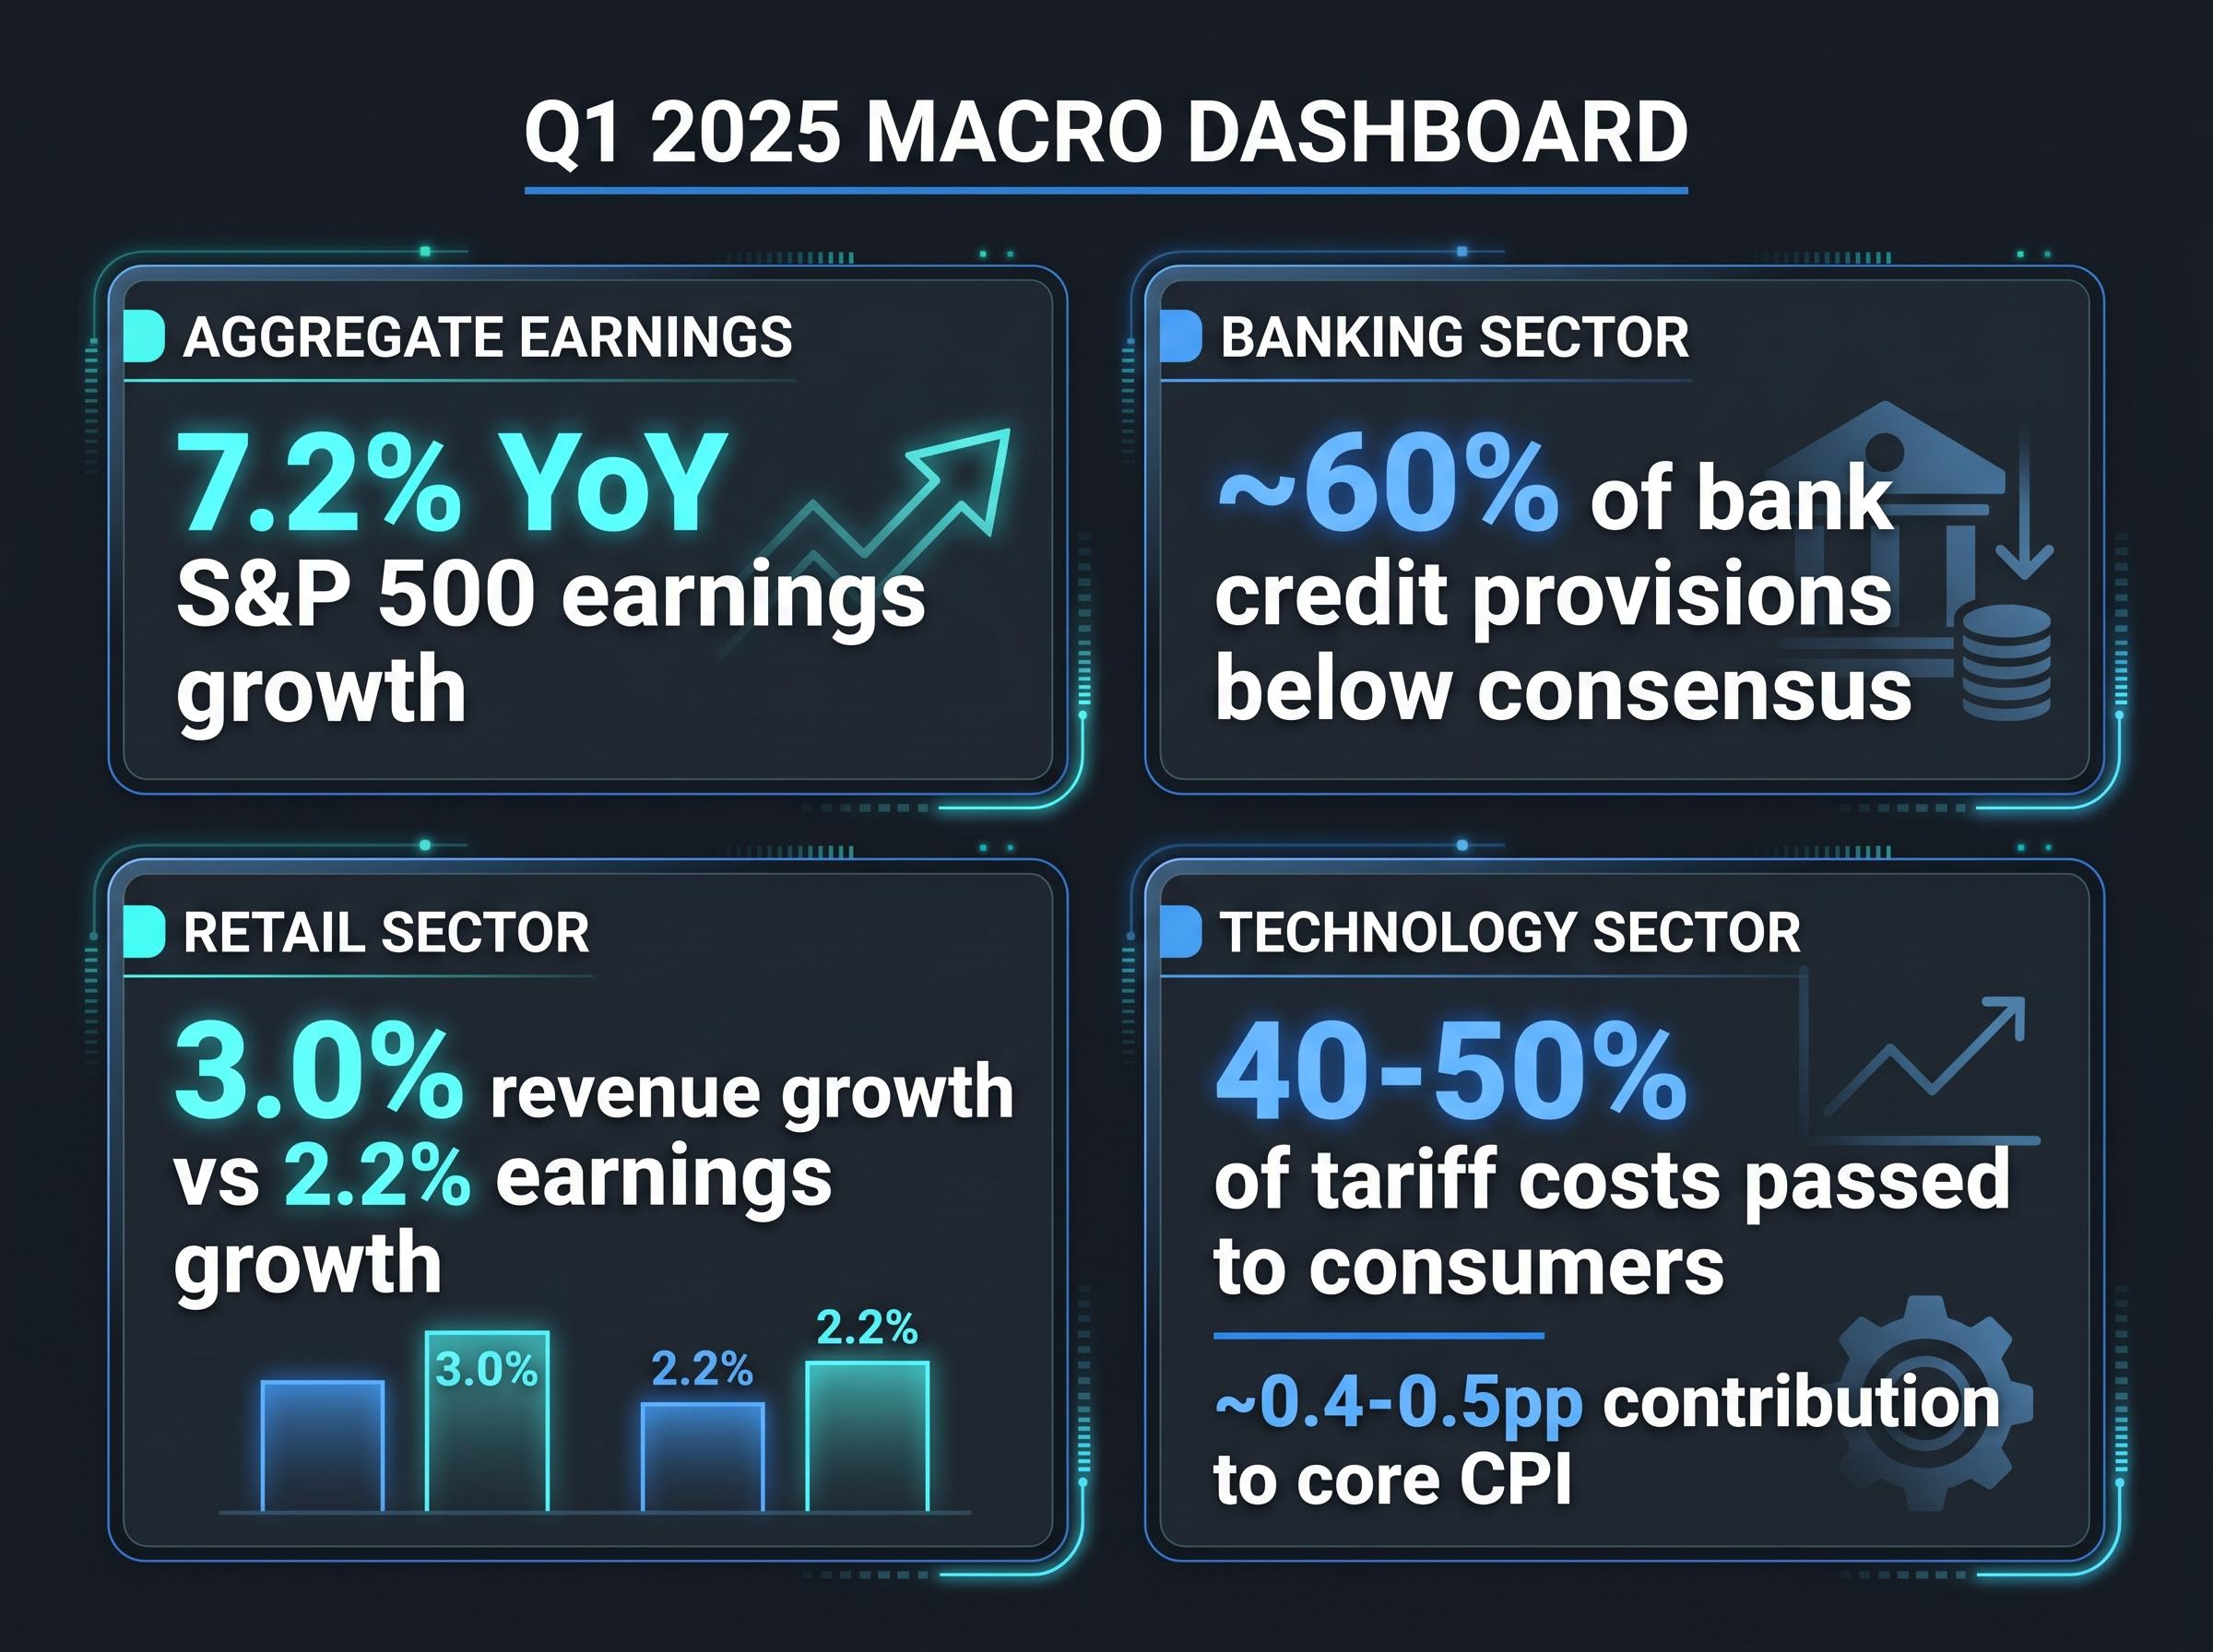
By the time the Bureau of Economic Analysis publishes its first GDP estimate for a given quarter, earnings season has already told that story. Corporate results from the preceding weeks carry signals about consumer health, inflation momentum, and business investment that official statistics cannot match for speed or granularity. In the context of how earnings season functions as an economic indicator, Q1 2025 offered a case study worth examining closely. Aggregate S&P 500 earnings grew 7.2% year-over-year, a deceleration from prior quarters. Bank credit provisions came in below consensus. Retail revenue grew 3.0% but earnings growth slowed to 2.2%. Technology companies absorbed tariff-related cost pressure. Taken together, these were not just financial results; they were an economic portrait of a slowing but resilient economy, available weeks before official confirmation.
What follows explains how to read earnings season the way economists read it: as a real-time macroeconomic dashboard organised by sector, not as a collection of individual stock scorecards. The framework covers which metrics carry macro weight, why earnings data leads official statistics, and how to extract a coherent economic picture from the noise of reporting season.
Two audiences watch every earnings season simultaneously. Equity investors scan results for portfolio signals: which stock beat, which missed, which guidance revision moves the share price. Economists and macro strategists watch the same reports for a different purpose entirely. They are reading for confirmation or contradiction of their economic models.
The distinction matters because the macro signal emerges not from any single company’s result but from patterns across unrelated industries. When JPMorgan Chase reports rising loan loss provisions in the same quarter that Walmart flags slowing discretionary spending and Caterpillar cuts its order outlook, the message transcends individual firm performance. That convergence is a macroeconomic data point.
The Q1 2025 aggregate earnings growth figure of 7.2% year-over-year illustrates the concept. No single company’s result produced that number. It emerged from hundreds of reports filed within a concentrated four-to-six week window, creating a period of simultaneous signal generation that economists treat as a leading read on the economy’s direction.
Marcel Miu of Simplify Wealth Planning and John Campbell of Allspring Global Investments have both articulated this dual function explicitly: earnings season is as much a macroeconomic research event as it is a financial one. The framework for reading it starts with cross-sector pattern recognition.
Official economic data arrives with a structural time lag. The Bureau of Economic Analysis (BEA) publishes its advance GDP estimate roughly 30 days after the quarter ends. Consumer Price Index (CPI) readings reflect prices from the prior month. Employment figures are backward-looking by design, capturing conditions that prevailed weeks before their release date.
Earnings reports occupy a different position on the timeline. Q1 2025 results, covering economic activity from January through March, began publishing on approximately 15 April and ran through late May. That placed corporate data in investors’ hands before the BEA’s advance GDP estimate for the same period. The reporting calendar does not just match official data for coverage; it arrives first.
The BEA advance GDP estimate is released 25 to 30 days after the end of the reference quarter and is based on incomplete source data subject to two subsequent revisions, which means corporate earnings reports covering the same period reach investors materially earlier than the official figure.
The timing advantage deepens when management guidance enters the picture. Forward-looking statements describe conditions executives are observing in real time, not retrospectively. A CEO revising revenue guidance downward in April is telling the market something about demand conditions that the BEA will not confirm for weeks.
Research has consistently shown that companies issuing downward guidance revisions are penalised more severely by markets than those missing historical estimates. This asymmetry reflects how heavily forward signals are weighted relative to backward-looking results.
By Q4 2025, CEO confidence reached its highest level since Q1 2025, correlating with GDP growth forecasts of 2.2% for full-year 2025. The alignment between aggregate earnings sentiment and subsequent GDP trajectory illustrates the predictive relationship: corporate results were telling the macro story before official data confirmed it.
The practical implication is straightforward. Professionals track earnings data even when they hold no position in the reporting company, because the macro signal has value independent of any single stock’s movement.
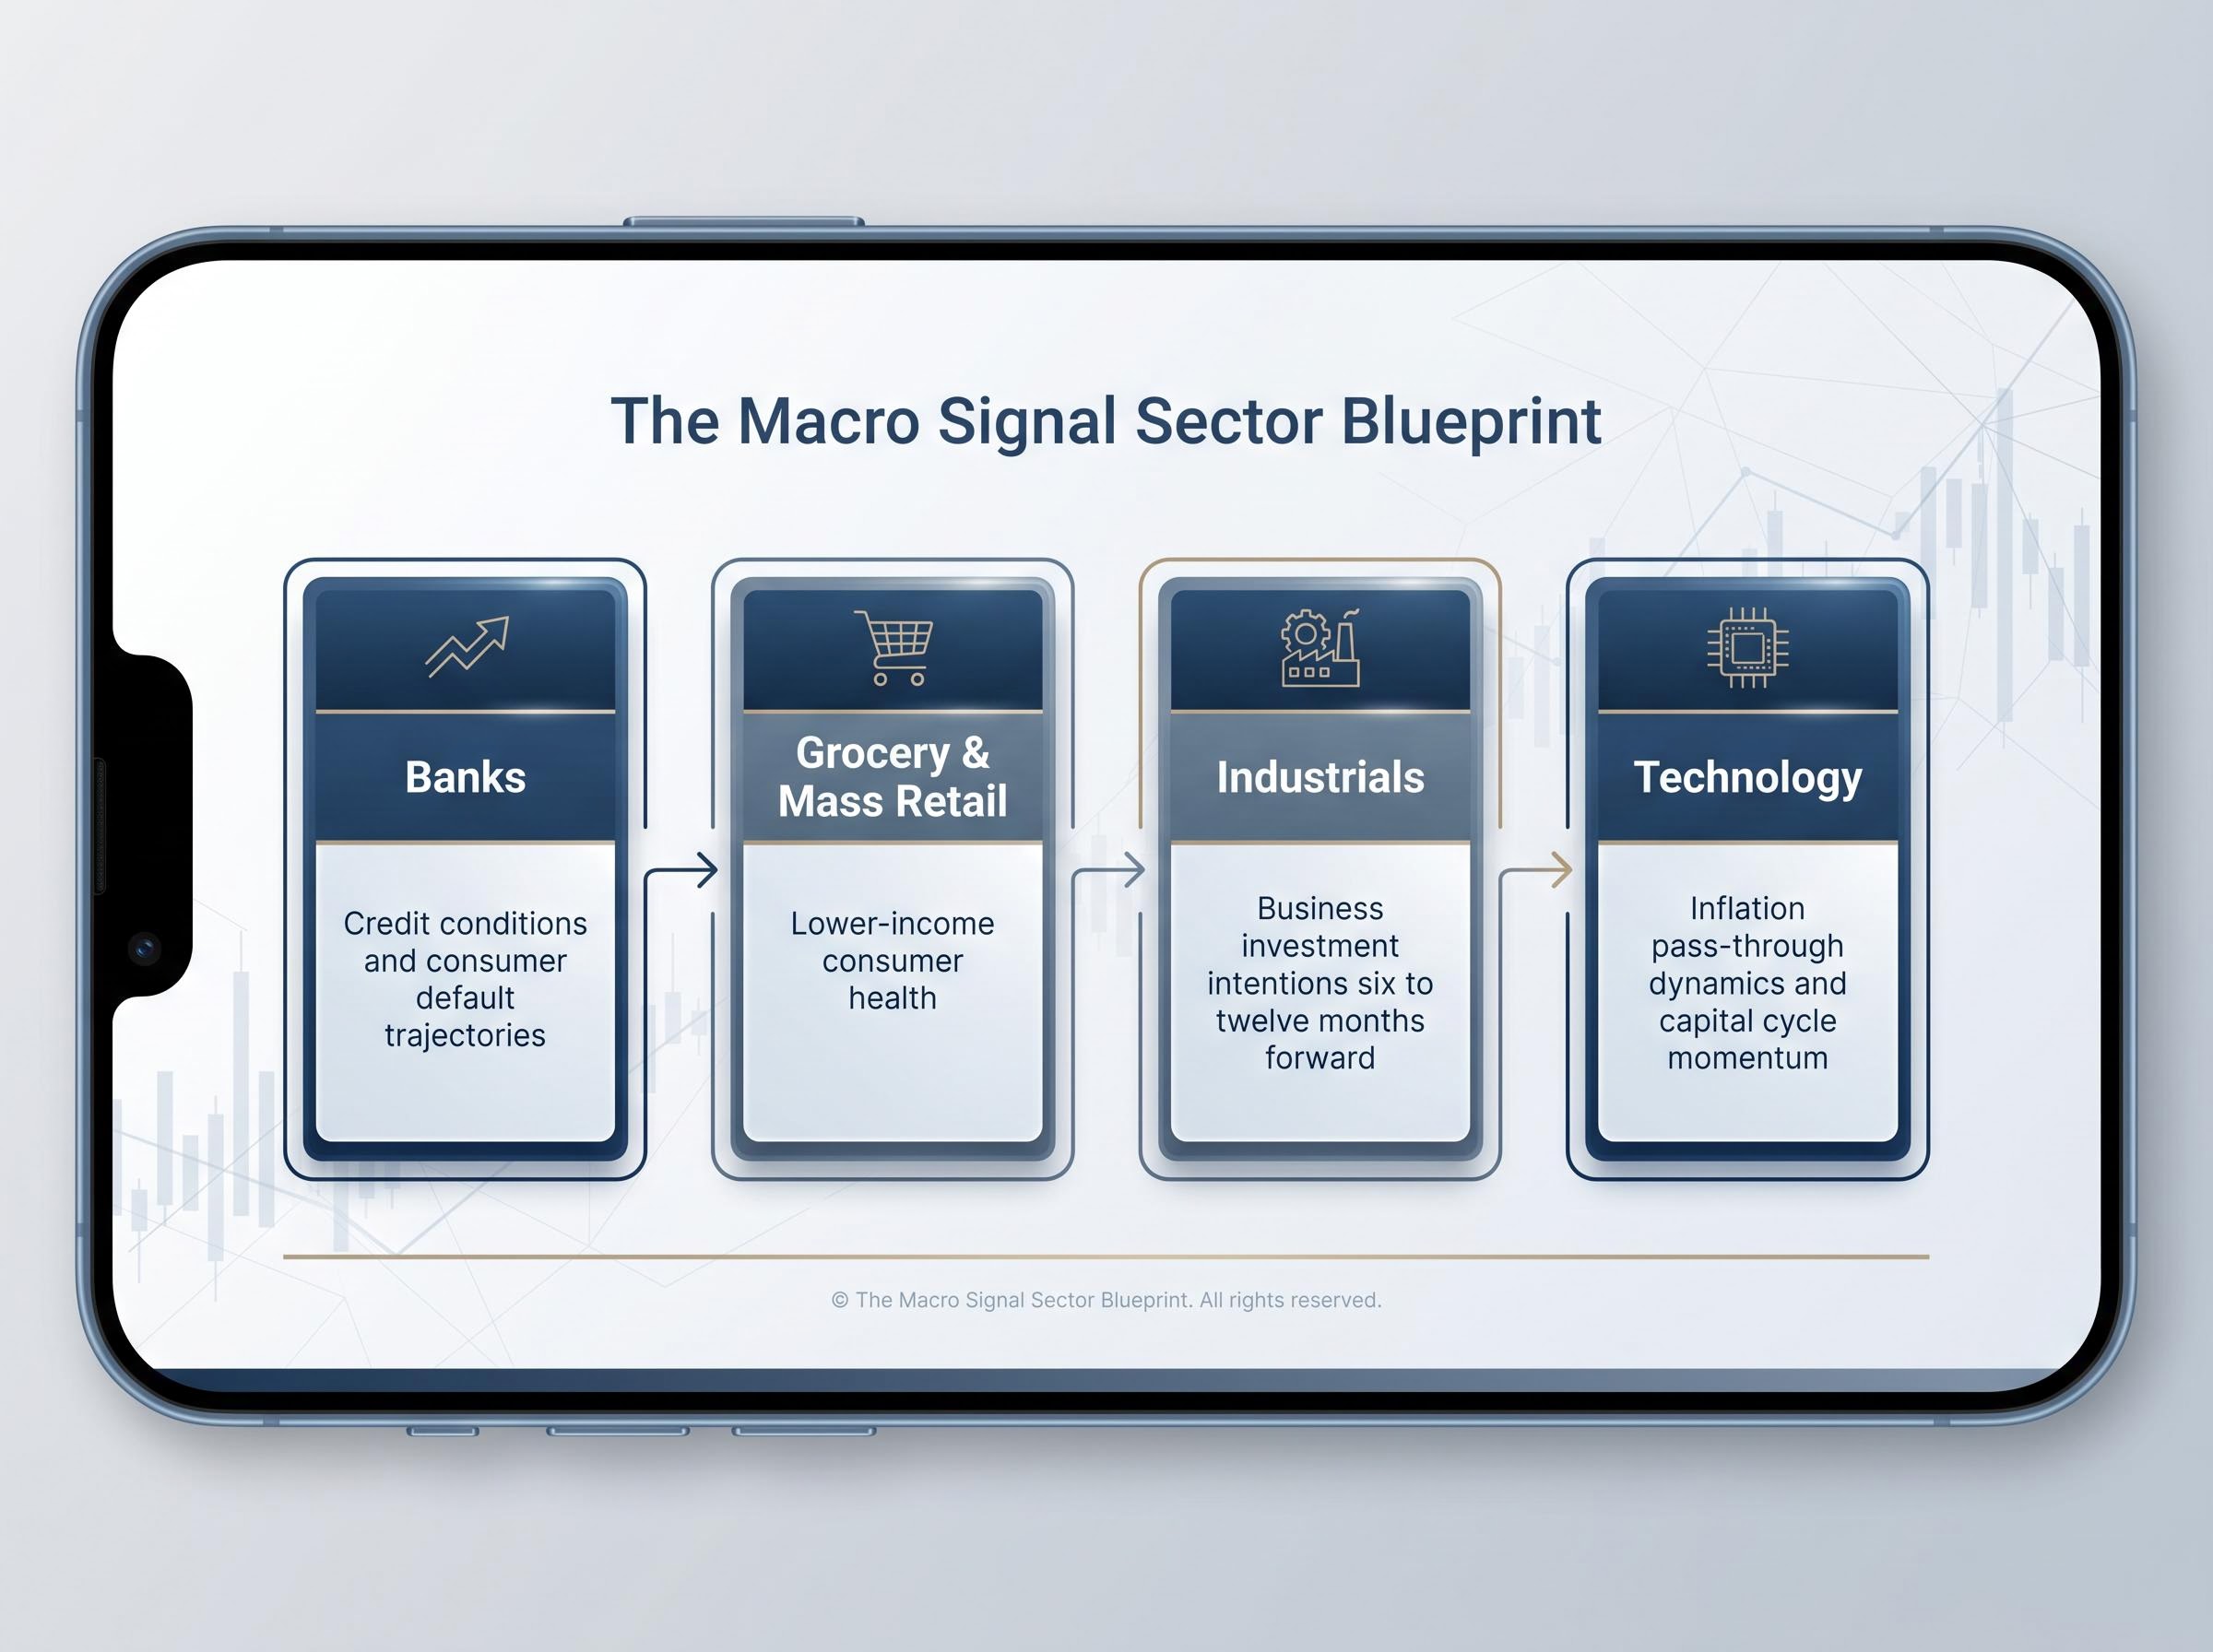
Loan loss provisions are one of the few line items in a corporate earnings report that are explicitly forward-looking by design. When a bank increases its provision for credit losses, it is not recording defaults that have already occurred. It is recording management’s judgment about defaults it anticipates. That judgment, multiplied across dozens of banks reporting in the same window, produces a real-time credit health assessment that no government agency publishes at comparable speed.
According to S&P Global Market Intelligence, approximately 60% of banks booked credit loss provisions below consensus estimates in Q1 2025. The reading carried a specific macro implication: credit stress was less severe than analysts had anticipated heading into the quarter. Consumer and corporate defaults had not materialised at the level many models predicted.
JPMorgan Chase and Citi reinforced the signal from the other direction, revising EPS guidance upward in Q1 2025, driven by a revival in mergers and acquisitions activity and strong trading revenue. Upward revisions from the two largest U.S. banks indicated that capital markets activity, a proxy for corporate confidence, was accelerating rather than contracting.
Net interest margins provided a secondary read. Margin expansion across the banking sector reflects the rate environment’s effect on all borrowers, not just bank customers. When margins widen, borrowing costs are elevated economy-wide, a condition that affects consumer spending, housing activity, and business investment simultaneously.
| Signal Type | Q1 2025 Reading | Macro Implication |
|---|---|---|
| Loan loss provisions | ~60% below consensus estimates | Credit stress less severe than feared; consumer and corporate defaults contained |
| EPS guidance revisions | JPMorgan Chase and Citi revised upward | M&A revival and trading strength signalling corporate confidence |
| Net interest margin trends | Expansion across major banks | Elevated borrowing costs persisting economy-wide, affecting all sectors |
Bank earnings are the closest thing earnings season has to a real-time consumer credit health report. Monitoring provision trends across the sector provides early visibility into credit cycle turning points that often precede broader economic stress by one to two quarters.
Credit cycle turning points are rarely announced in advance by official data; they tend to surface first in bank provision trends, distress ratios, and leveraged loan index movements, all of which were flashing divergent signals in early 2026 even as headline credit spreads remained contained.
Retail earnings are the primary proxy for consumer spending health, and their analytical value increases when read at the category level rather than the aggregate. A headline retail growth figure tells one story. The breakdown by subcategory tells a more layered one, because different retail categories index toward different income segments.
According to EMARKETER, blended retail earnings growth came in at 2.2% with revenue growth of 3.0% in Q1 2025. The gap between top-line revenue and bottom-line earnings indicated that retailers were absorbing some cost pressure rather than passing it entirely to consumers, a dynamic with direct inflation implications.
Category-level disaggregation sharpened the picture:
Marcel Miu of Simplify Wealth Planning has noted that a company achieving 20% revenue growth while incurring 30% cost increases illustrates how margin erosion can undermine positive top-line results. Applied to retail, this framework reveals whether rising revenue actually reflects economic health or whether it is masking cost pressure that will eventually flow through to consumer prices.
Retail earnings disaggregated by category offer a more granular picture of consumer health than headline consumer confidence surveys, and they update quarterly with a level of specificity that aggregate data cannot provide.
Savings depletion dynamics complicate the retail earnings picture considerably: when lower-income households draw down reserves to maintain spending levels, top-line revenue growth can remain positive even as the underlying financial position of that consumer segment deteriorates, a divergence that blended category growth rates obscure.
Technology earnings carry a macro signal that operates differently from consumer-facing sectors. The signal here is about cost pass-through inflation and the capital investment cycle, both of which flow from corporate decisions rather than household behaviour.
According to PIMCO research, an estimated 40-50% of tariff-related costs in the technology sector were passed through to consumers in 2025, contributing approximately 0.4-0.5 percentage points to core inflation. Kenvue reported $150 million in tariff-related costs in 2025 as an individual illustration of the scale of absorption at the firm level. When technology companies pass costs forward, the inflationary effect reaches consumers indirectly, through higher device prices, software subscription increases, and component cost escalation across supply chains.
The AI capital expenditure cycle added a distinct macro dimension. Heavy investment by hyperscaler firms in AI infrastructure functions as an economic multiplier, creating downstream demand for energy, real estate, and component manufacturing. Blackstone’s Office of the CIO identified technology and financials as the leading macro engines for 2025-2026, driven by AI economic benefit realisation and geopolitical supply chain restructuring.
The AI capital expenditure cycle that emerged as a macro theme in technology earnings had reached a scale by early 2026 that exceeded every prior technology investment peak, with combined hyperscaler commitments running into the hundreds of billions and raising questions about where the productivity returns would ultimately concentrate.
Industrial earnings provide one of the longest-lead macro signals embedded in reporting season. The sequence runs as follows:
Caterpillar and Deere & Co. function as bellwether companies in this sequence. Their management commentary on order backlogs is tracked by economists as a business confidence proxy, because a decision to order heavy equipment today reflects a capital expenditure commitment that will generate economic activity well into the future.
The combined read from technology and industrial earnings extends the earnings season macro signal beyond consumer behaviour into the business investment cycle and inflation mechanics, completing the picture that bank and retail data begin.
Earnings data carries genuine macroeconomic forecasting value, but it operates within constraints that honest analysis must acknowledge.
The most fundamental limitation is temporal. Earnings reports reflect a quarter that has already ended. By the time Q1 2025 results were published in April and May, economic conditions had already shifted. The data confirms what happened; it does not observe what is happening now.
Management guidance introduces a second layer of complexity. Companies face strategic communication incentives that can distort forward-looking statements. Some firms sandbag forecasts to set beatable targets in subsequent quarters. Others inflate outlooks to manage investor sentiment during capital raises. No single company’s guidance should be taken at face value.
The corrective is aggregation. The macro signal strengthens when the same message appears across unrelated sectors simultaneously. If banks, retailers, and industrial manufacturers all reference the same headwind in the same quarter, the convergence is difficult to attribute to individual company strategy. Cross-sector pattern recognition is what separates macro intelligence from corporate noise.
The Conference Board’s Leading Economic Index (LEI) provides useful context: earnings data is one component of a broader basket of leading indicators, and professional economists use it in combination with employment data, manufacturing surveys, and financial conditions indices, not in isolation.
The Conference Board Leading Economic Index tracks ten forward-looking components spanning manufacturing orders, credit conditions, and consumer expectations, and earnings data is most effective when read alongside this broader basket rather than in isolation from other leading indicators.
| Signal Domain | Q1 2025 Reading | Macro Implication | Reliability Note |
|---|---|---|---|
| Overall earnings growth | 7.2% YoY | Moderation, not contraction | Aggregate figure can mask sector-level divergence |
| Bank credit provisions | ~60% below consensus | Credit stress less severe than feared | Provisions reflect management judgment, not realised losses |
| Retail blended growth | 2.2% earnings, 3.0% revenue | Consumer deceleration, not contraction | Aggregate masks income-segment divergence |
| Tech tariff pass-through | 40-50% of costs passed to consumers | ~0.4-0.5pp contribution to core CPI | Pass-through estimates vary by product category |
A practical framework for reading earnings season as a macro tool involves four steps:
This article is for informational purposes only and should not be considered financial advice. Investors should conduct their own research and consult with financial professionals before making investment decisions.
Earnings season is a macro research event that happens to be organised around corporate disclosures. Investors who treat it as such gain a systematic early-read advantage over those who engage with it only as a portfolio event.
The sector hierarchy for macro signal quality follows a clear structure:
The Q2 2025 reporting cycle, with results expected from mid-April through late May, will test whether the themes established in Q1, tariff cost absorption, credit quality resilience, and consumer deceleration, confirm, deepen, or reverse. The 2.2% full-year 2025 GDP forecast provides the macro backdrop against which those results will be read. By Q4 2025, CEO confidence had reached its highest level since Q1 2025, establishing a sentiment baseline for interpreting the next cycle’s tone.
The data arrives before the official statistics. The question is whether investors are reading it as an economic report or just a stock scorecard.
For investors who want to situate the Q1 2025 earnings signals within the broader macro context that followed, our deep-dive into the global macro dashboard for Q2 2026 examines how PMI readings, payrolls, and GDP figures across the US, Eurozone, and Asia converged into the three-speed picture that shaped equity positioning through the subsequent cycle.
Earnings season functions as a leading economic indicator because hundreds of corporate reports filed within a four-to-six week window reveal patterns in consumer spending, credit conditions, and business investment before official government statistics like GDP are published.
The Bureau of Economic Analysis publishes its advance GDP estimate roughly 30 days after a quarter ends, while corporate earnings reports for the same period begin publishing within days of the quarter closing, placing key economic signals in investors hands materially earlier.
Bank loan loss provisions are explicitly forward-looking, reflecting management expectations of future defaults; when provisions across multiple banks come in below consensus, as approximately 60% did in Q1 2025, it signals that credit stress is less severe than feared economy-wide.
Disaggregating retail earnings by category provides a clearer picture than headline figures: grocery and mass merchant growth (around 3.7% in Q1 2025) proxies lower-income household spending, while home improvement trends reflect mid-tier consumer confidence and discretionary commitment.
Earnings reports reflect a quarter that has already ended, meaning the data confirms past conditions rather than current ones, and management guidance can be distorted by strategic communication incentives such as sandbagging targets; the macro signal is most reliable when the same theme appears across multiple unrelated sectors simultaneously.