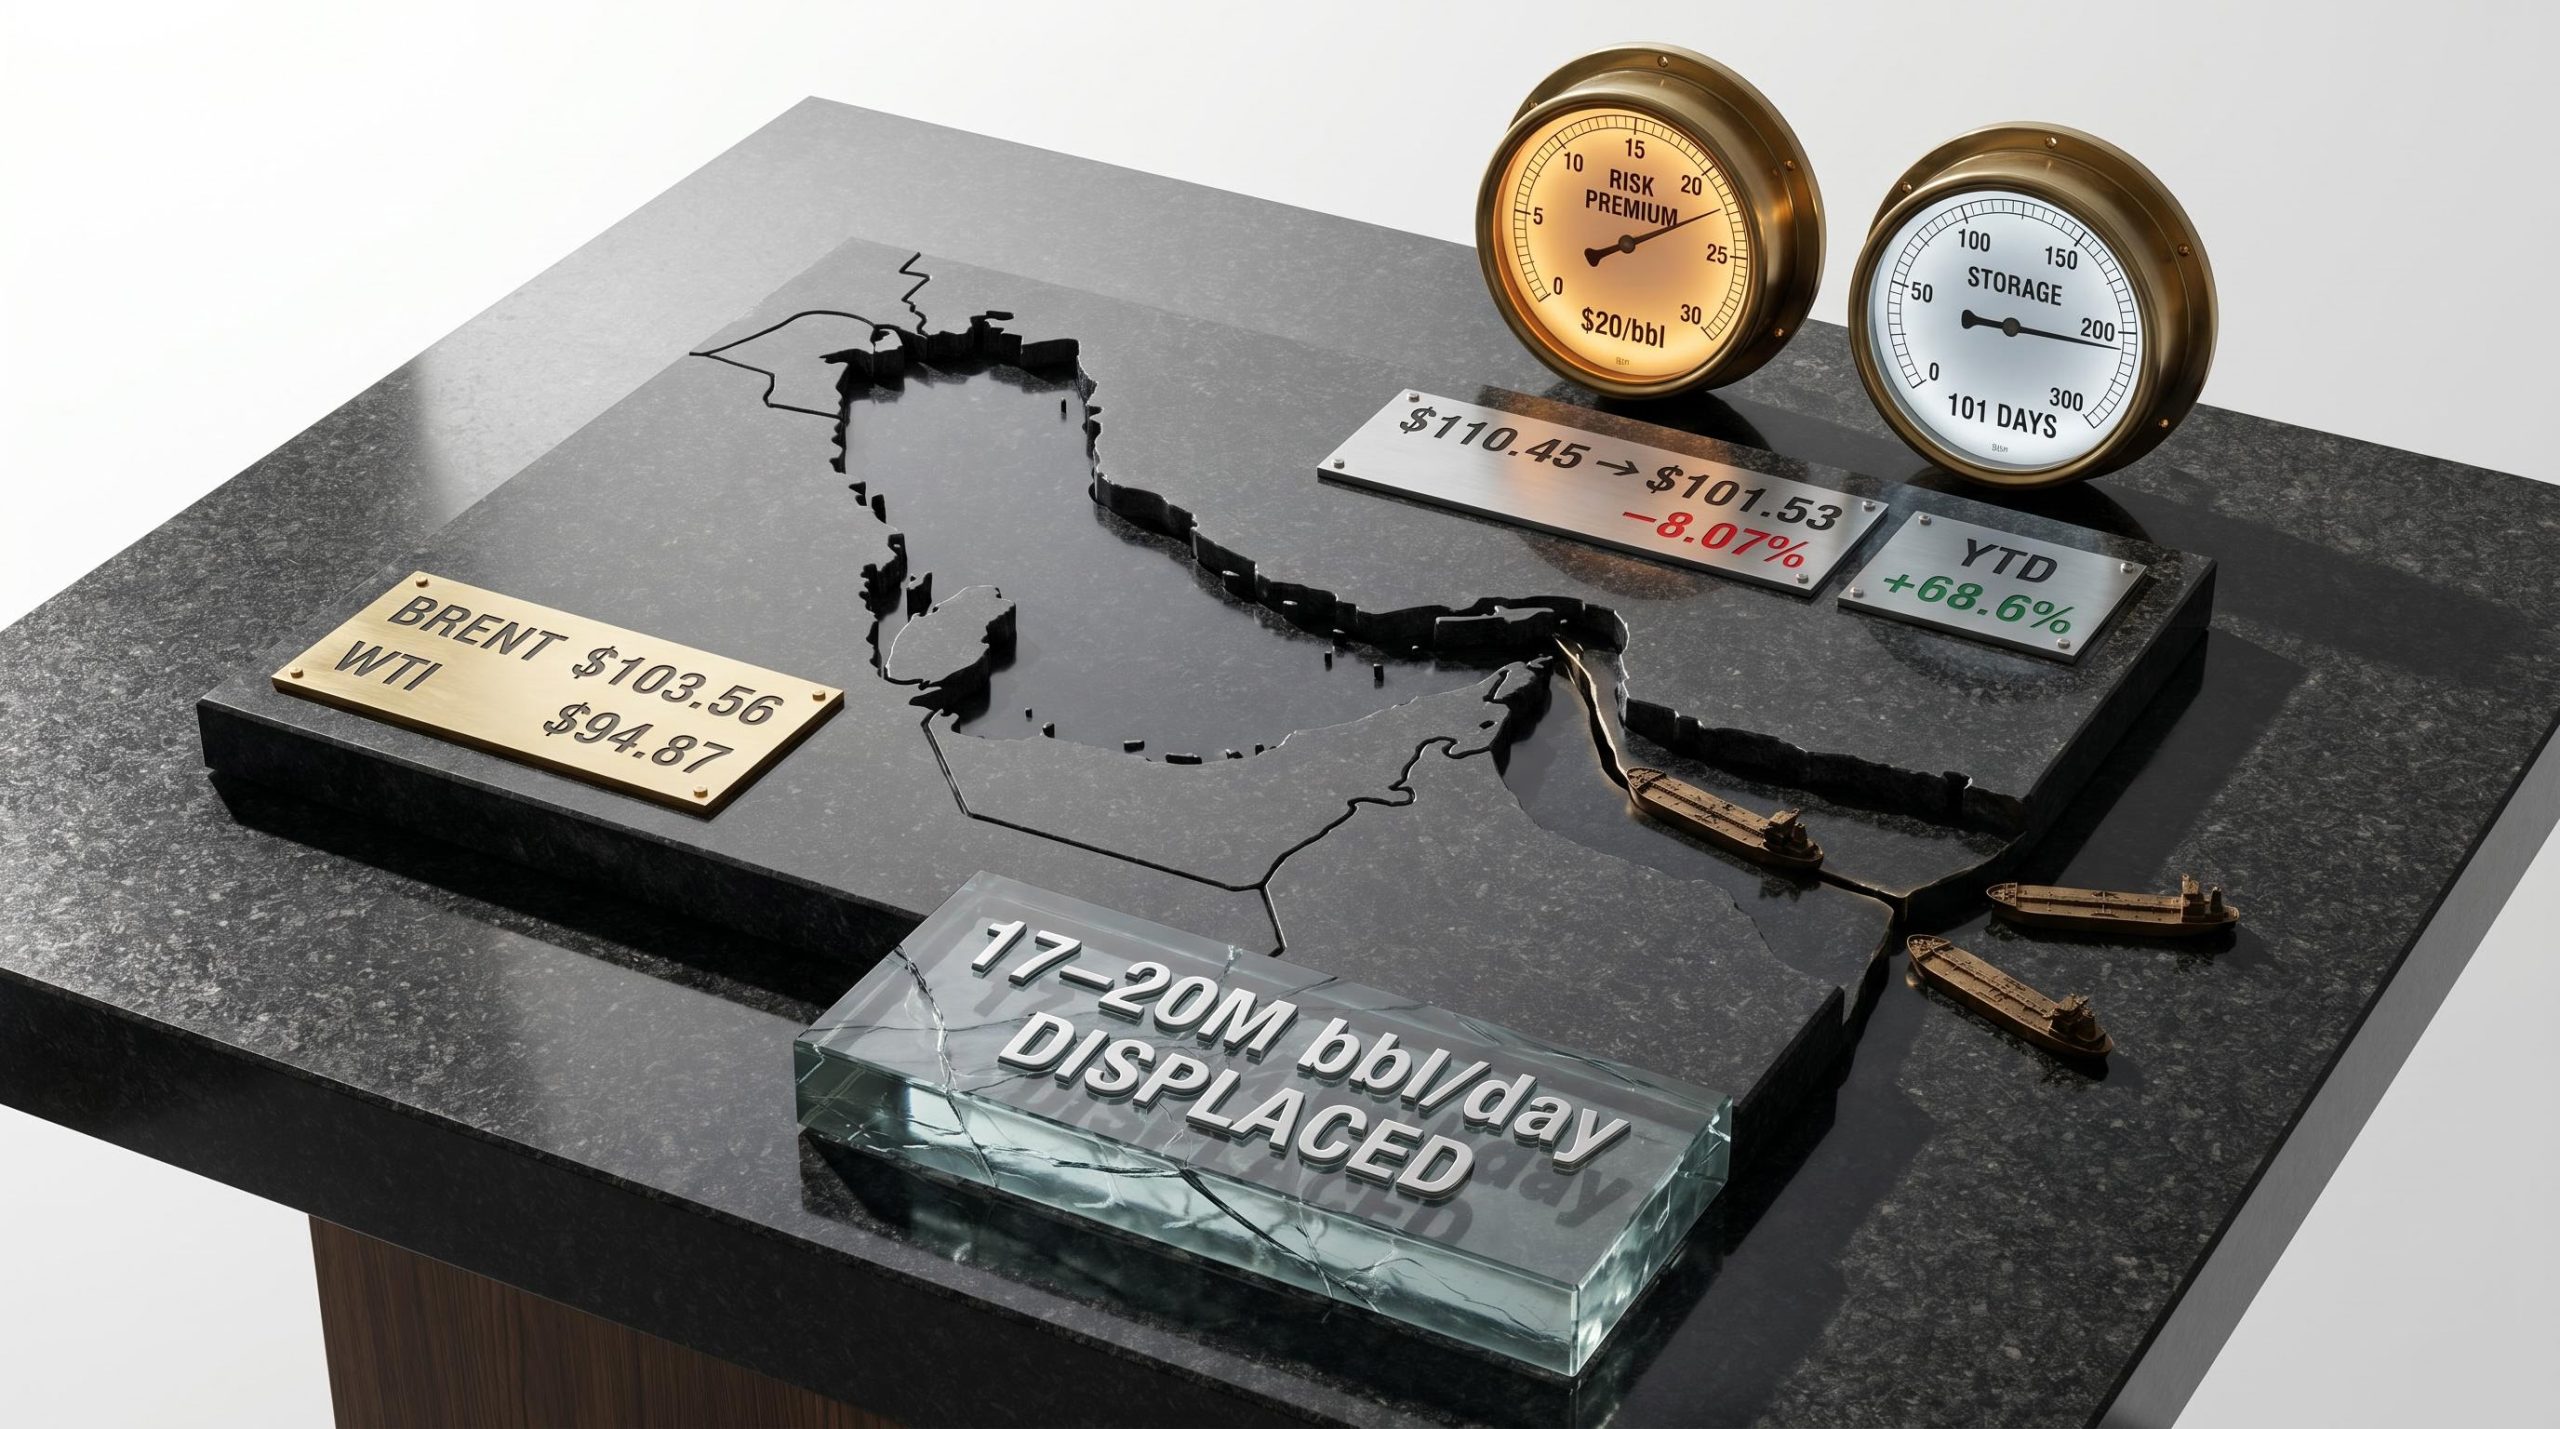
What’s Really Driving Oil Price Swings Near Hormuz
22 mins ago

Westpac shares slipped 2.26% to A$37.63 on 5 May 2026, even as the bank reported a 3% rise in statutory net profit to A$3.4 billion. The gap between a growing earnings line and a falling share price captured the tension running through the entire half-year result: operational progress was real, but the headline number fell short of what the market had already priced in. With all four major Australian banks now deep into their FY26 reporting cycle, income investors and ASX watchers are parsing every data point for signals about dividend sustainability, margin trajectory, and capital management optionality. What follows breaks down the numbers that matter, from a 16% surge in business lending and a A$2.7 billion capital surplus to the 77-cent fully franked interim dividend and CEO Anthony Miller’s candid warnings about geopolitical headwinds.
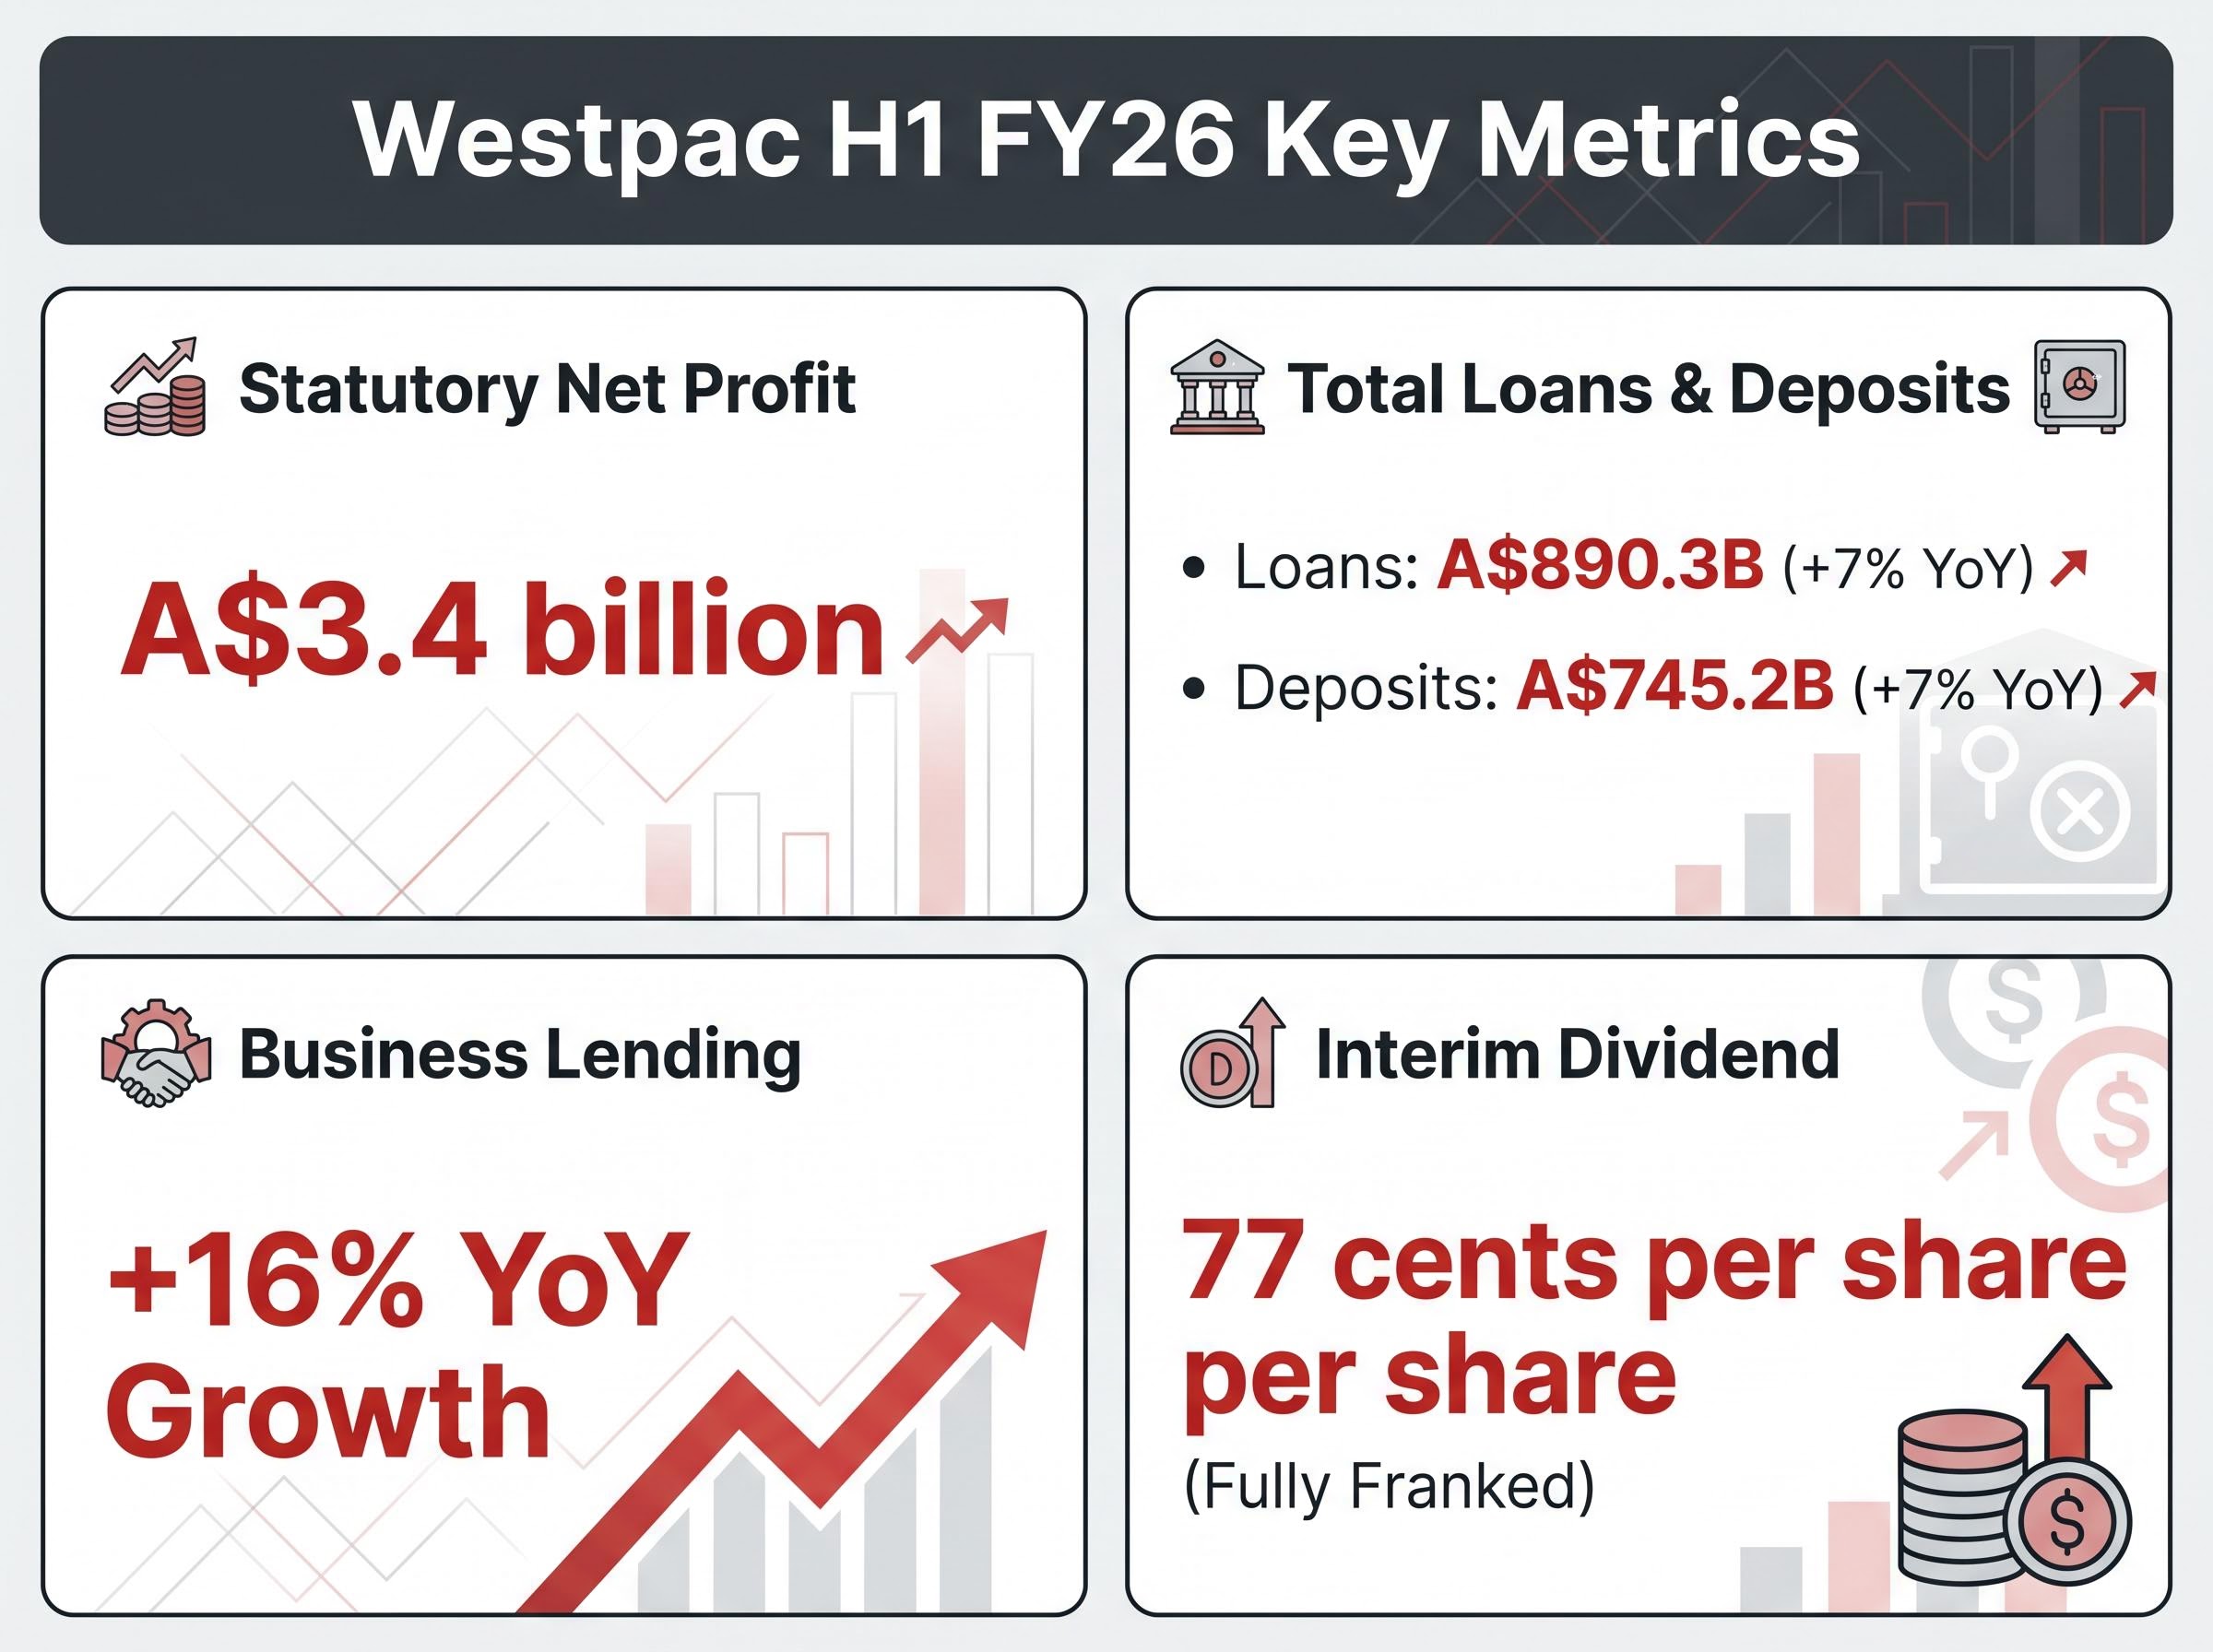
Westpac delivered A$3.4 billion in statutory net profit for H1 FY26, a figure that was 3% higher than the prior corresponding half (H1 FY25) yet 5% lower than the immediately preceding half (H2 FY25). The sequential decline mattered more to a market that had been pricing in momentum, not deceleration.
Shares closed at A$37.63, down 2.26% from the previous close of A$38.50, on trading volume of 4,850,244 shares. The sell-off made the verdict plain: consensus had expected something stronger.
Net profit excluding Notable Items, which strips out one-off charges and gains that do not reflect the bank’s recurring earning power, came in at A$3.5 billion. The gap between the two figures was modest, suggesting the miss was not driven by unusual charges but by the underlying pace of earnings growth itself.
The RAMS portfolio sale carries a A$75 million post-tax profit impact recorded in this half, a cost that sits within the Notable Items adjustment bridging the A$3.4 billion statutory figure to the A$3.5 billion underlying result.
Reuters characterised the result as a profit miss versus estimates, with CEO Anthony Miller flagging Iran war risks and Middle East uncertainty as headwinds to the outlook.
The profit miss told one story. The balance sheet told another. Total lending grew 7% year-on-year to A$890.3 billion, while customer deposits expanded at the same 7% pace to reach A$745.2 billion.
| Metric | H1 FY26 Value | Growth Rate | Composition Note |
|---|---|---|---|
| Total Loans | A$890.3 billion | +7% YoY | Mortgages and business lending combined |
| Customer Deposits | A$745.2 billion | +7% YoY | Retail and institutional deposits |
| Australian Mortgages | Not separately disclosed | 1.2x system (ex-RAMS) | Proprietary channels; RAMS de-emphasised |
| Australian Business Lending | Not separately disclosed | +16% YoY | Agriculture, healthcare, professional services, institutional |
The mortgage book grew at 1.2 times system through proprietary channels, with the bank deliberately pulling back from its RAMS brand in favour of higher-quality origination. The standout, however, was business lending.
A 16% year-on-year increase in Australian business lending was the single most striking operational metric in the result. The growth was spread across agriculture, healthcare, professional services, and institutional segments, suggesting breadth rather than concentration in any one sector. For investors assessing whether Westpac is gaining genuine market share or riding sector tailwinds, that distribution matters. Volume growth alone does not build a thesis; the quality and diversification of that growth does.
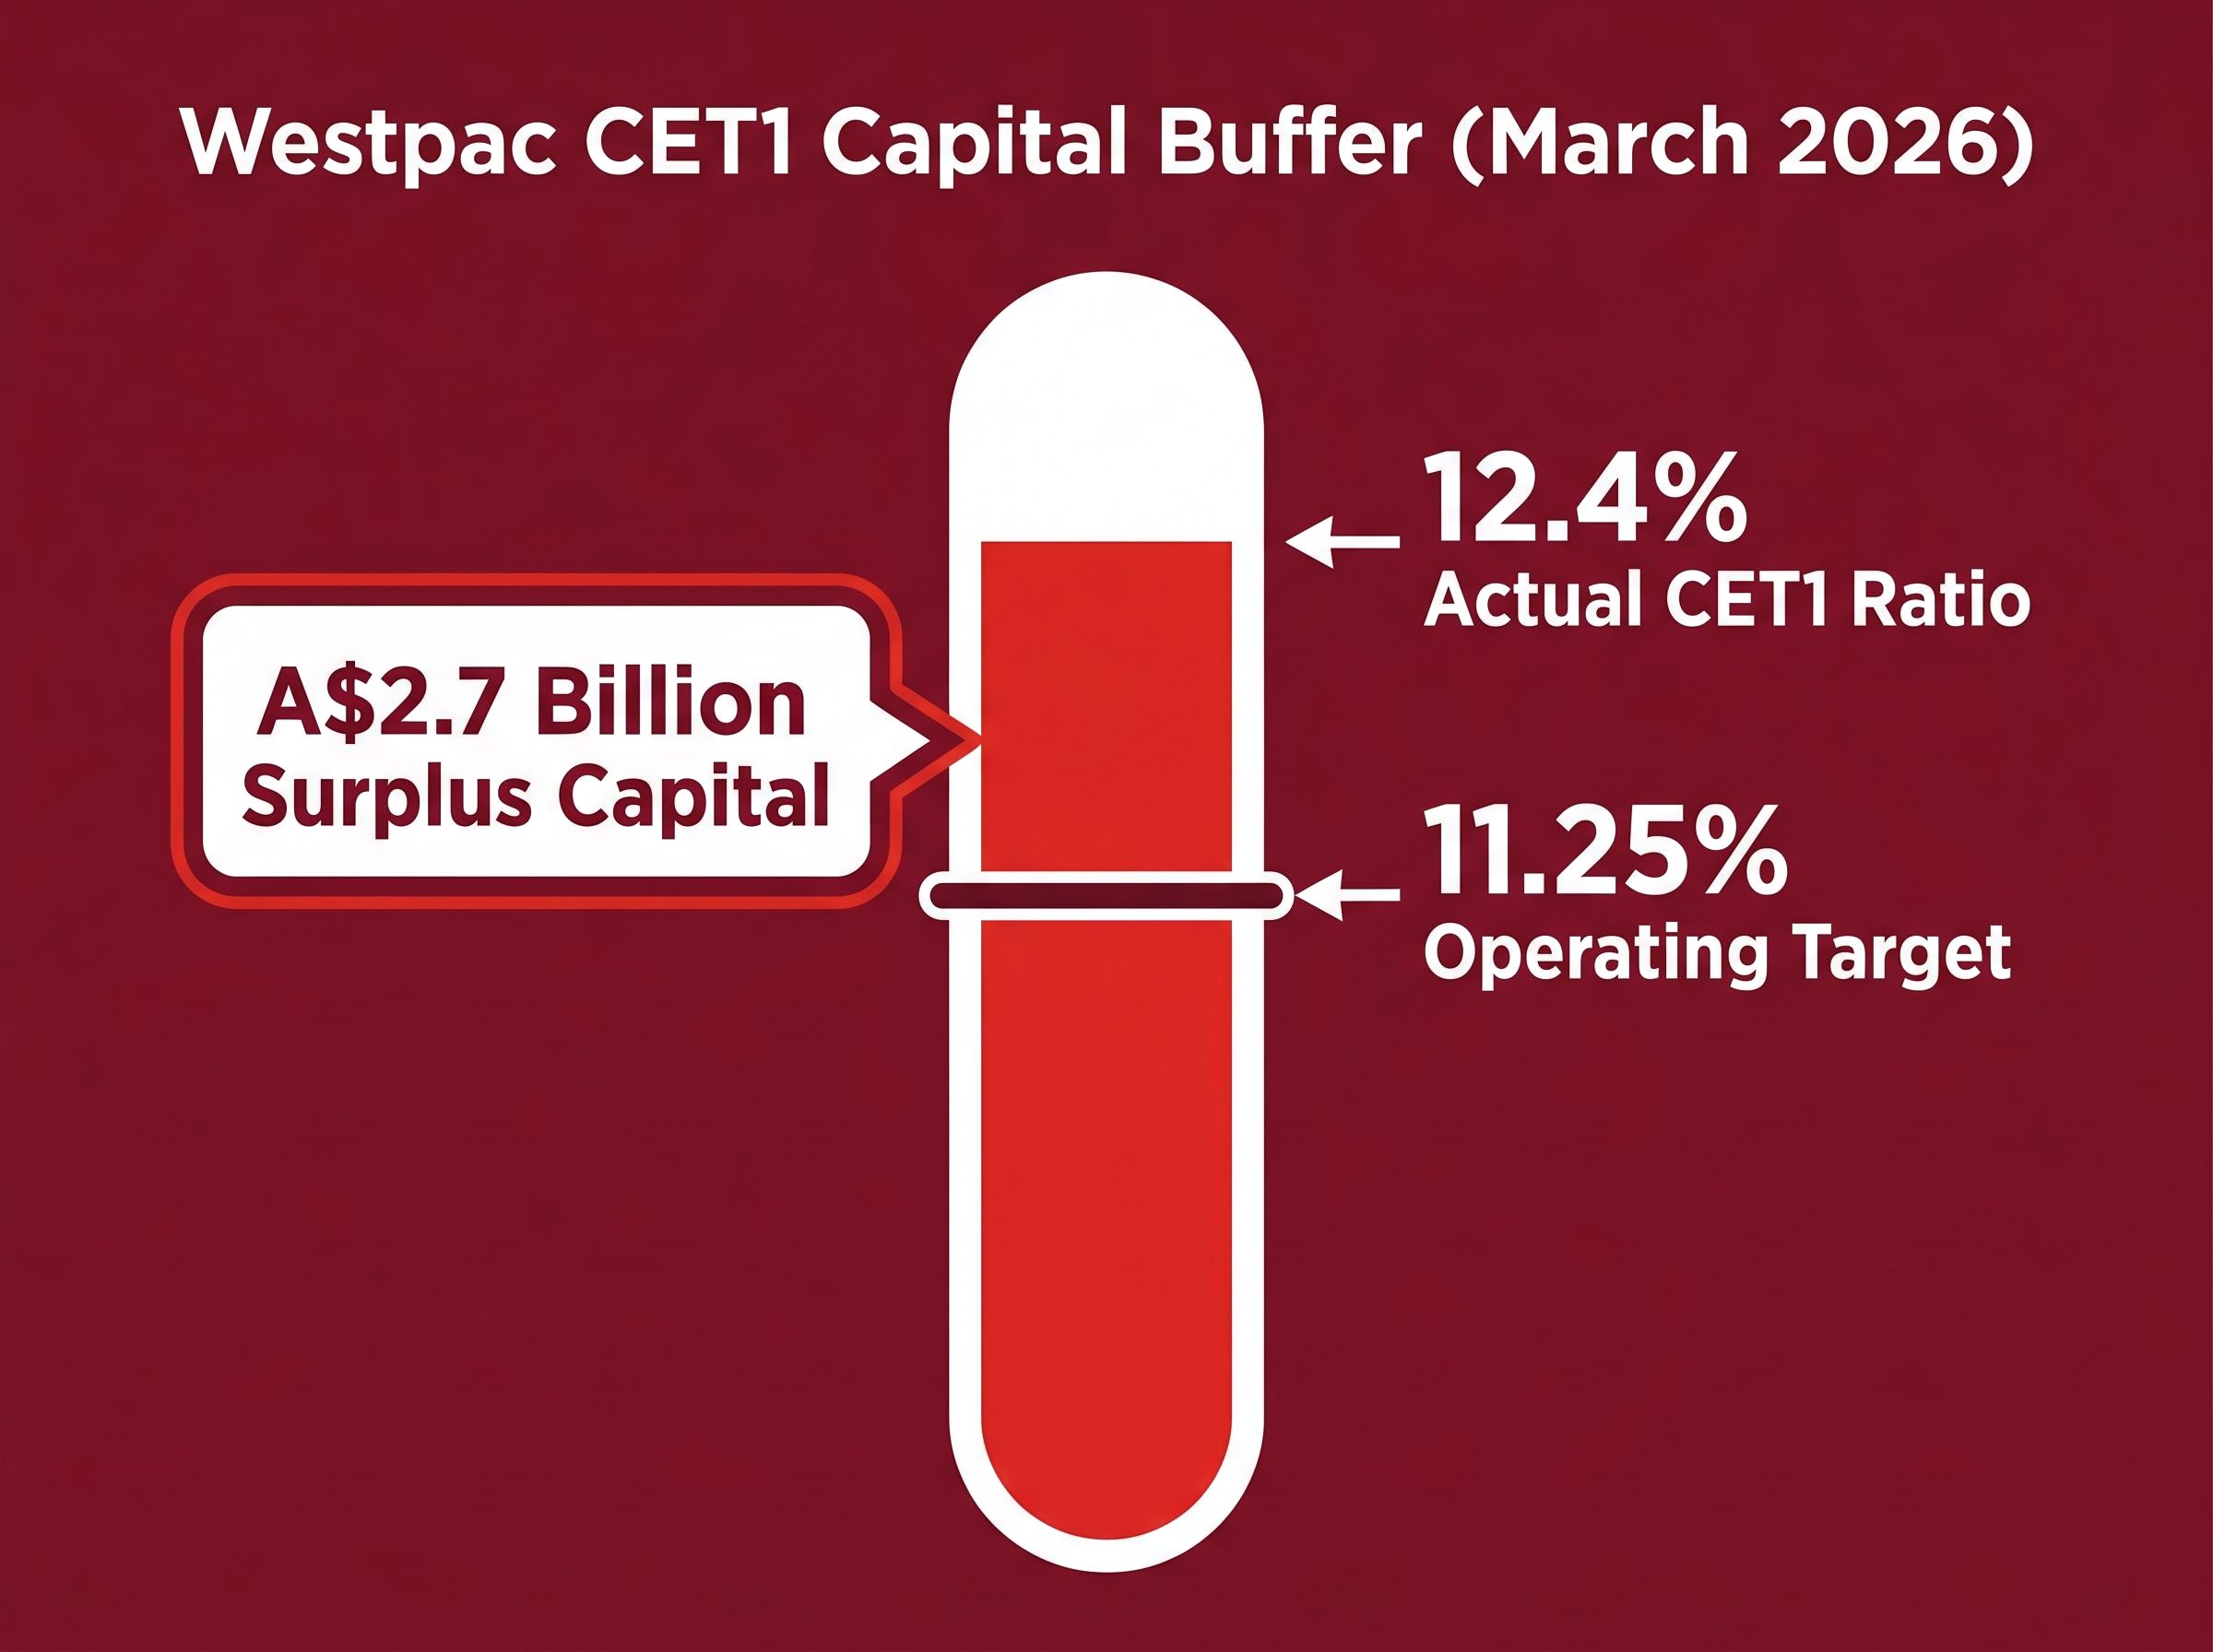
Capital adequacy ratios determine how much financial shock a bank can absorb before its depositors or creditors face risk. The most closely watched measure is the Common Equity Tier 1 (CET1) ratio, which expresses the proportion of a bank’s risk-weighted assets funded by its highest-quality capital: ordinary shares and retained earnings. A higher CET1 ratio means a thicker buffer against losses.
APRA Prudential Standard APS 110 establishes the capital adequacy framework that determines how Australian banks calculate risk-weighted assets and set their CET1 floor, the same framework that anchors Westpac’s 11.25% operating target and defines what constitutes surplus capital available for shareholder returns.
Three levels matter in practice:
The gap between the 12.4% actual ratio and the 11.25% target translates to approximately A$2.7 billion in surplus capital after paying the interim dividend, quantifying the optionality available to management.
That surplus does not automatically trigger a buyback or special dividend. It represents capacity that management can deploy when conditions warrant, and CFO Nathan Goonan’s commentary on capital flexibility in the next section makes clear how the bank views that optionality. Asset quality remained stable, with stressed exposures falling to 1.16% of total committed exposure, down 12 basis points on September 2025 and 20 basis points on March 2025.
The confirmed shareholder return for H1 FY26 is a 77-cent per share interim dividend, fully franked, representing a payout ratio of approximately 75%. At the 5 May closing price of A$37.63, that implies a dividend yield of approximately 4.1%.
Confirmed income: 77 cents per share, fully franked, payable to shareholders for H1 FY26.
CFO Nathan Goonan, who was appointed in October 2025, framed the A$2.7 billion post-dividend surplus as genuine flexibility. Buybacks or special dividends remain possible if “normal operating conditions” persist, but no commitment was made. No changes to the 11.25% CET1 target were announced, signalling that Westpac is not planning to run with a structurally lower capital buffer.
Income investors holding WBC can anchor to the confirmed dividend and franking credits. Any additional capital return remains conditional on the macro and geopolitical environment that CEO Miller addressed directly.
Anthony Miller did not bury the risks. The CEO’s commentary explicitly flagged Middle East and Iran war tensions, US macroeconomic uncertainty, and domestic deposit competition as headwinds to net interest margin. The specificity of the risk disclosure, naming Iran and the Middle East rather than defaulting to generic “global uncertainty” language, suggested this was a deliberate signal to investors rather than boilerplate caution.
Miller described Australia’s economy as “resilient” but adopted a more vigilant tone on the external environment. Additional provisions were established to reflect an updated economic outlook, particularly for energy-intensive industries exposed to geopolitical supply disruptions.
Provisioning forecasts for the sector were already a bearish signal before Westpac’s result, with Morgans projecting total big four provisions rising from approximately A$2.4 billion in FY25 to approximately A$5.5 billion by FY27, a trajectory that makes the additional provisions Westpac established in H1 FY26 consistent with a broader industry credit quality shift rather than a company-specific concern.
The UNITE cost transformation programme remains on track for A$1 billion in savings by end of FY27, with costs described as lower versus H2 FY25. That programme is partly designed to absorb margin pressure through operating leverage, a dynamic that becomes increasingly relevant if NIM compression persists.
Net interest margin (NIM) is the difference between the rate a bank earns on its loans and the rate it pays on deposits, expressed as a percentage of interest-earning assets. Westpac reported a NIM of approximately 1.74% for H1 FY26. When NIM falls, bank earnings compress directly unless offset by loan volume growth or cost reductions. All four major banks face deposit repricing headwinds, and Westpac’s result was not unique in flagging this dynamic.
| Bank | Reporting Period | Statutory Profit | Interim Dividend | Standout Note |
|---|---|---|---|---|
| Westpac | H1 FY26 (May 2026) | A$3.4 billion | 77 cps, fully franked | Business lending +16%; UNITE cost programme |
| NAB | H1 FY26 (May 2026) | Cash profit A$3.59 billion | Not confirmed | Business lending +12%; modest earnings growth |
| ANZ | H1 FY26 (Feb 2026) | A$3.65 billion | Not confirmed | Cash profit A$3.78bn, up approximately 14% |
| CBA | H1 FY26 (Feb 2026) | Cash profit up approximately 6% | Approximately 225-235 cps | Strongest absolute profitability and payout |
Note: CBA and ANZ reported in February 2026. Dividend figures are not directly comparable across banks given different payout structures and reporting calendars.
Westpac’s result sits broadly in line with NAB but trails ANZ’s stronger H1 FY26 outcome and CBA’s higher absolute profitability and payout. The sector entered reporting season trading at elevated FY26 price-to-earnings multiples of approximately 14-15x, a level where any earnings miss carries outsized price consequences, as Westpac’s 5 May sell-off demonstrated.
Elevated price-to-earnings multiples of approximately 14-15x across the big four heading into reporting season created a valuation structure where any earnings miss carries outsized price consequences, the same dynamic that compressed Westpac’s share price by 2.26% on a result that was operationally solid but short of consensus.
Westpac’s H1 FY26 result reads as two stories. The operational foundation is solid: 16% business lending growth, a A$2.7 billion capital surplus, UNITE savings on track, and a 77-cent fully franked interim dividend that delivers approximately 4.1% yield at current prices. The uncertainty is equally real: NIM compression from deposit repricing, geopolitical risks the CEO put explicitly on record, and a share price that had already baked in optimism before the numbers arrived.
For H2 FY26, the markers to watch include UNITE programme execution milestones, RBA rate decisions and their effect on deposit competition, developments in the Middle East, and any capital management announcement from the board.
This article is for informational purposes only and should not be considered financial advice. Investors should conduct their own research and consult with financial professionals before making investment decisions. Past performance does not guarantee future results.
Westpac reported a statutory net profit of A$3.4 billion for H1 FY26, up 3% on the prior corresponding half but down 5% sequentially on H2 FY25, with net profit excluding Notable Items coming in at A$3.5 billion.
Westpac declared a 77-cent per share interim dividend for H1 FY26, fully franked, representing a payout ratio of approximately 75% and an implied dividend yield of approximately 4.1% at the 5 May closing price of A$37.63.
The Common Equity Tier 1 (CET1) ratio measures the proportion of a bank's risk-weighted assets funded by its highest-quality capital; Westpac's CET1 ratio of 12.4% sits above its 11.25% operating target, creating approximately A$2.7 billion in surplus capital that could support future buybacks or special dividends.
Despite reporting a 3% year-on-year profit rise, Westpac's shares fell 2.26% on 5 May 2026 because the result came in below market consensus expectations, and the sector was trading at elevated price-to-earnings multiples of approximately 14-15x where any earnings miss carries outsized price consequences.
Australian business lending at Westpac grew 16% year-on-year in H1 FY26, spread across agriculture, healthcare, professional services, and institutional segments, while the mortgage book grew at 1.2 times system through proprietary channels.