
The Morningstar Dividend Leaders Index gained 28.83% over the 12 months ending 30 April 2026, yet several of its strongest April performers are still trading below Morningstar’s fair value estimates, some by double-digit margins, even after monthly price surges exceeding 15%. With the Federal Reserve holding rates steady at 3.50%-3.75% and dividend growth strategies outperforming broader benchmarks amid persistent macro uncertainty, income-focused investors are scanning for names that combine strong yields with remaining valuation upside. April delivered a striking set of movers: a semiconductor stock up more than 31% in a single month, a regional bank that has climbed nearly 40% over the trailing year, and five names still rated as undervalued by Morningstar’s methodology. What follows ranks all 10 top-performing dividend stocks from the index in April 2026, groups them by current valuation status, and identifies which names still offer compelling entry points heading into May for US income investors.
How the Morningstar Dividend Leaders Index selects its top dividend stocks
The Morningstar Dividend Leaders Index monitors the 100 highest-yielding equities drawn from companies with consistent dividend payment histories. That yield-plus-consistency screening means the index does not simply chase the highest payouts; it filters for reliability first, then ranks by yield within that quality gate.
Each constituent receives a Morningstar star rating. Companies covered by a dedicated Morningstar analyst receive a formal fair value estimate, which drives the star rating based on how far the current price sits from that estimate. Companies without direct analyst coverage receive a quantitative star rating instead, generated by statistically pairing the stock’s characteristics with those of analyst-rated peers. Both types appear in the April rankings, and the distinction matters when weighing a valuation discount.
Morningstar’s fair value estimates are grounded in the same core logic as the dividend discount model, which prices a stock as the present value of its future dividend stream rather than as a resale bet, a discipline that helps explain why a 31% monthly gain in Skyworks still leaves a 15% gap to the analyst’s estimate.
The star tiers translate to valuation assessments as follows:
- 4-5 stars: Stock is assessed as undervalued relative to fair value
- 3 stars: Stock is assessed as fairly valued
- 1-2 stars: Stock is assessed as overvalued relative to fair value
The Dividend Leaders Index posted a 28.83% gain for the 12 months ending 30 April 2026, compared with a 30.96% return for the Morningstar US Market Index over the same period.
The index itself dipped 0.22% in April, while the broader Morningstar Dividend Composite Index advanced 4.73% over the same one-month window. That divergence underscores why individual stock selection within the dividend universe mattered so much this month.
When big ASX news breaks, our subscribers know first
The undervalued picks: April’s top dividend gainers still trading at a discount
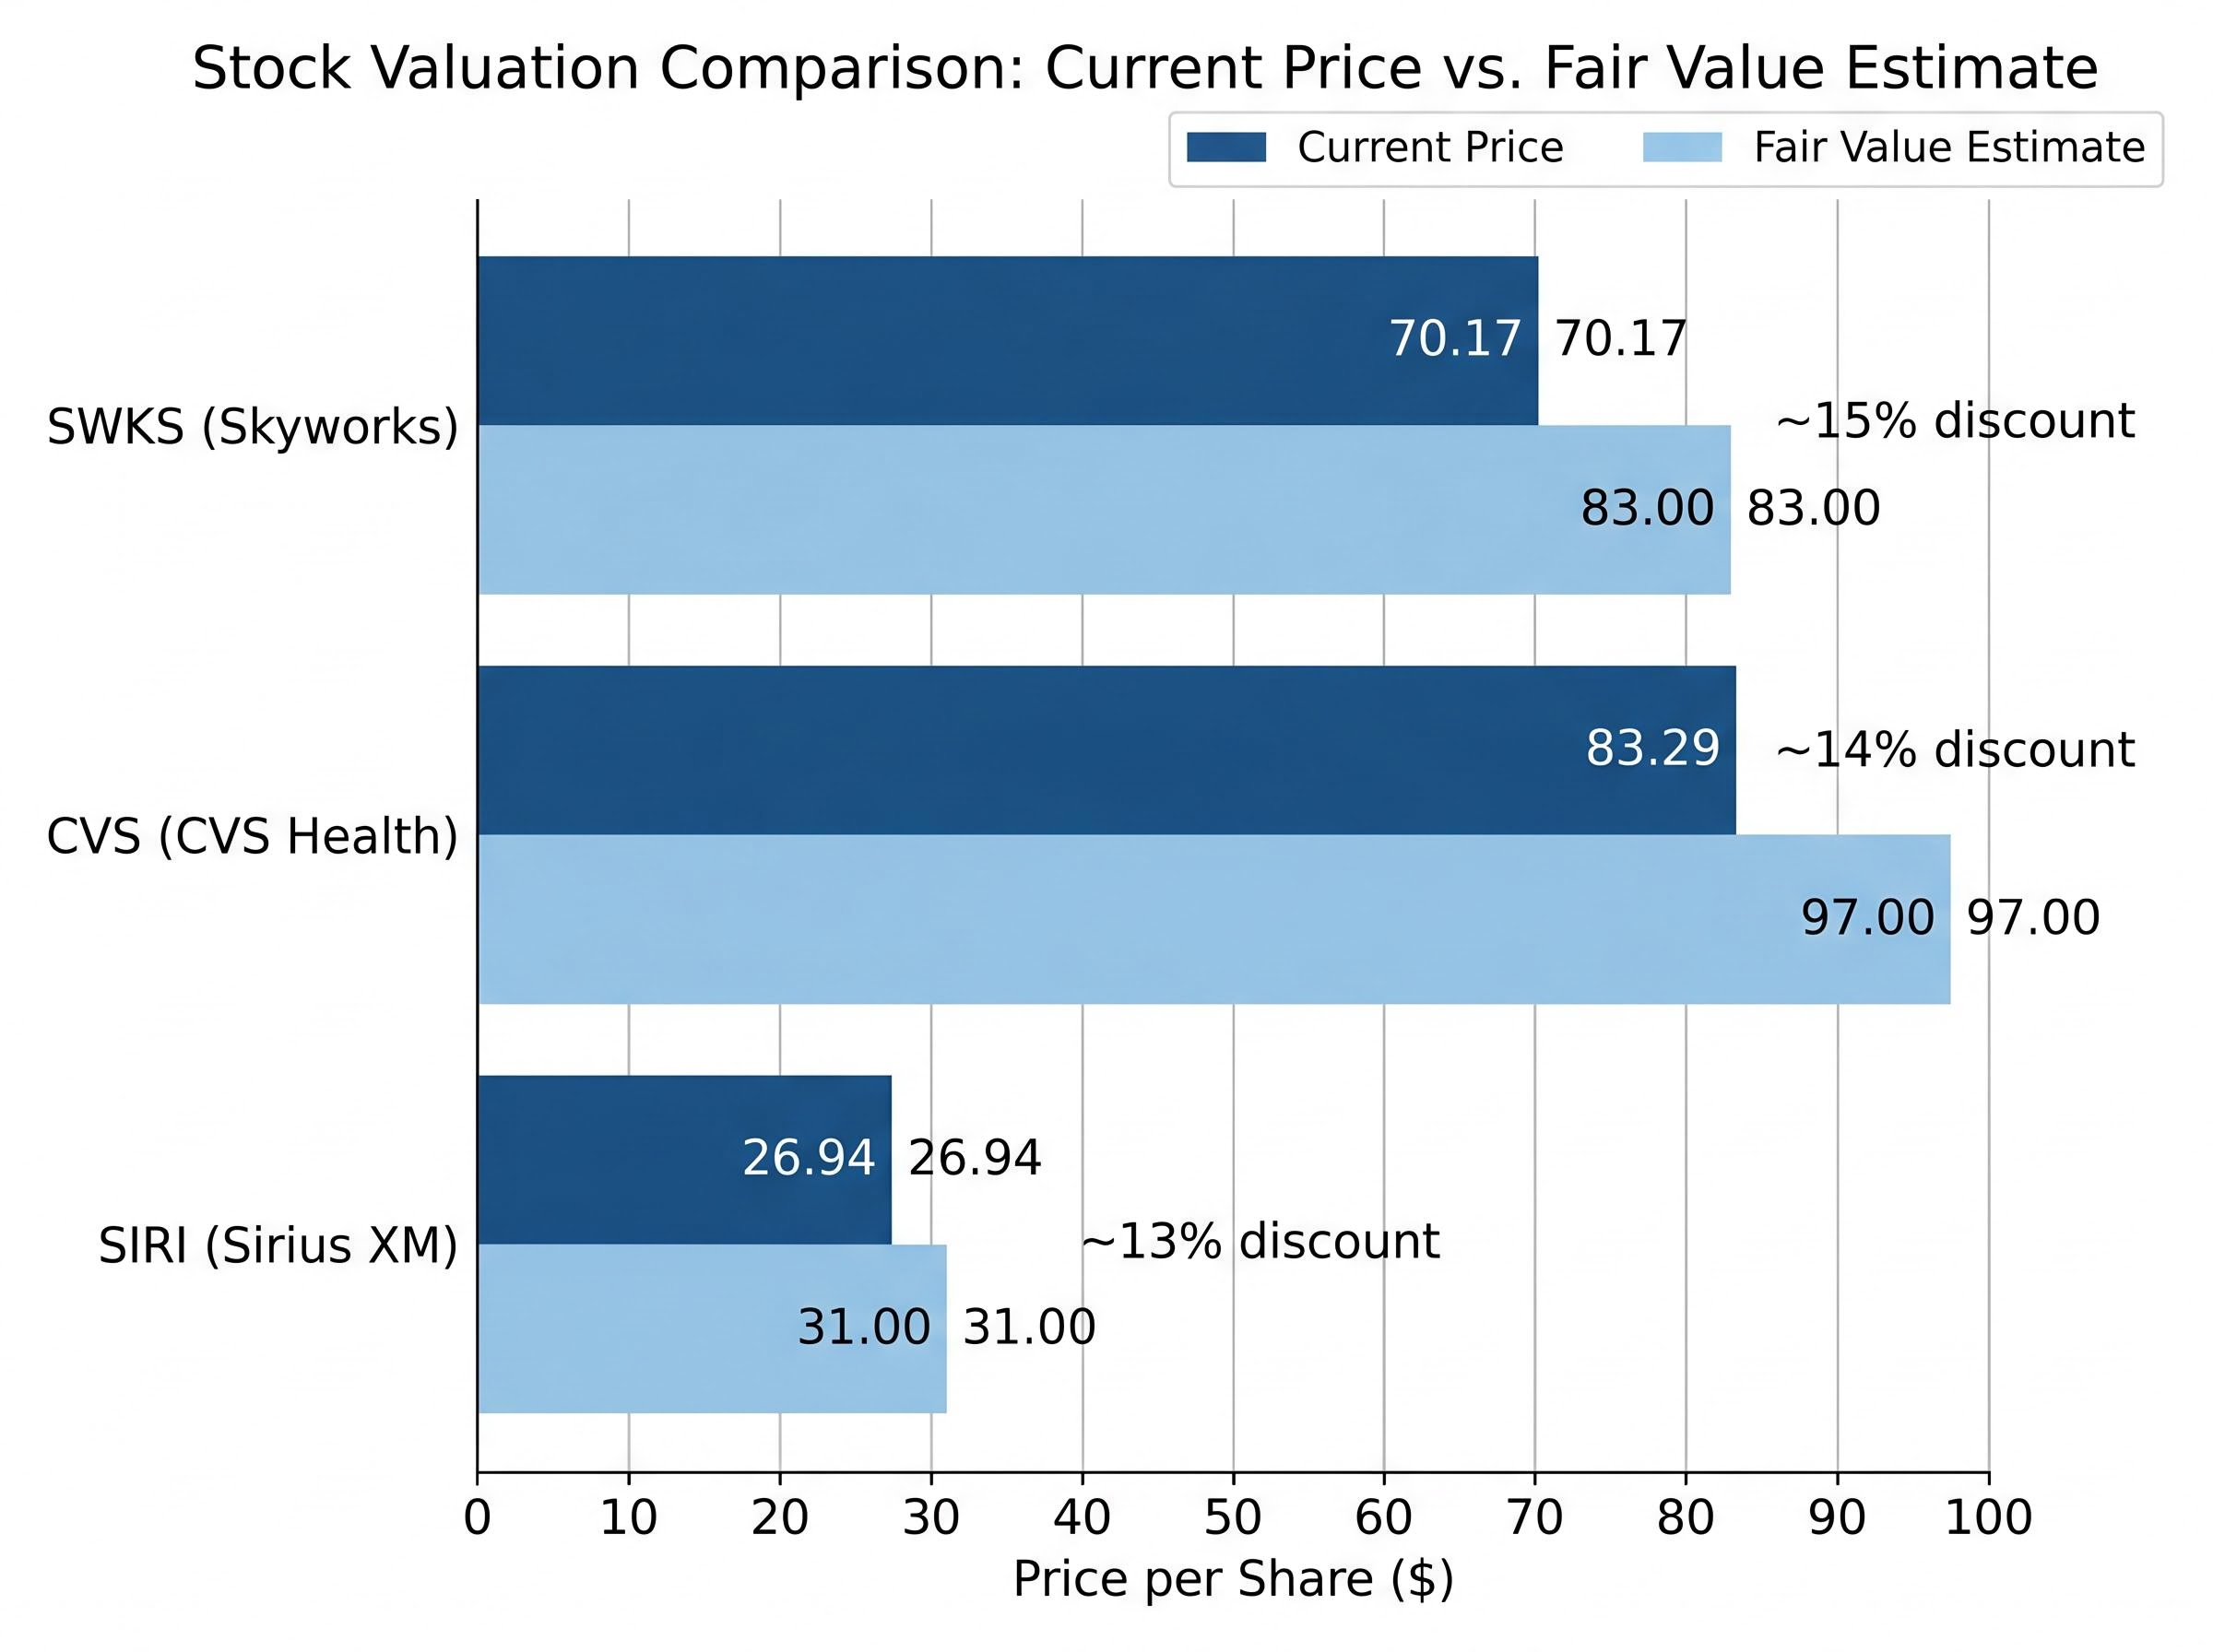
Skyworks Solutions posted the most dramatic move in the group: a 31.04% gain in April 2026, lifting shares to $70.17. Morningstar’s fair value estimate sits at $83, leaving an approximate 15% discount even after that surge. The forward yield stands at 4.05% on an annualised dividend of $2.84, and the stock carries a 4-star analyst-backed rating.
A 31% single-month gain paired with a 15% remaining discount to fair value is an unusual combination. Skyworks enters May as the standout opportunity in the group for investors who trust the semiconductor cycle thesis embedded in Morningstar’s valuation.
CVS Health climbed 16.90% in April to $83.29, against a fair value estimate of $97, representing roughly a 14% discount. The forward yield is 3.19% (annualised dividend of $2.66), and the 4-star rating is analyst-backed. Regulatory headwinds persist: the Tennessee FAIR Rx Act has introduced new pharmacy benefit manager oversight requirements, and the FTC continues to scrutinise CVS’s healthcare vertical integration strategy.
Sirius XM rose 16.72% to $26.94. Morningstar’s fair value estimate is $31, a roughly 13% gap. The forward yield is 4.01% on an annualised payout of $1.08. The stock carries a 3-star rating in Morningstar’s system, placing it at the boundary between fairly valued and modestly undervalued. Investors should treat the discount here with slightly less conviction than the wider gaps at Skyworks or CVS.
First American Financial gained 16.32% to $70.13, yielding 3.12% on an annualised dividend of $2.19. FAF carries a quantitative 4-star rating with no published fair value estimate, meaning the undervalued assessment is model-derived rather than analyst-backed.
Lazard advanced 14.17% to $48.50, offering the group’s highest quantitative rating at 5 stars and a 4.12% forward yield on an annualised dividend of $2.00. Like FAF, Lazard lacks an analyst-backed fair value estimate, so the rating reflects statistical peer matching rather than direct coverage.
| Company | April 2026 Return | Current Price | Fair Value Estimate | Discount to Fair Value | Forward Yield |
|---|---|---|---|---|---|
| Skyworks (SWKS) | +31.04% | $70.17 | $83 | ~15% | 4.05% |
| CVS Health (CVS) | +16.90% | $83.29 | $97 | ~14% | 3.19% |
| Sirius XM (SIRI) | +16.72% | $26.94 | $31 | ~13% | 4.01% |
| First American Financial (FAF) | +16.32% | $70.13 | N/A (quantitative) | N/A (quantitative) | 3.12% |
| Lazard (LAZ) | +14.17% | $48.50 | N/A (quantitative) | N/A (quantitative) | 4.12% |
These five names represent the clearest potential buy candidates from April’s top performers: recent momentum paired with Morningstar’s assessment that the market has not yet fully priced in their value. The analyst-backed versus model-based rating distinction, however, is worth weighing carefully before committing capital.
Fairly valued and overvalued: what the remaining top performers signal for income investors
The remaining five names from April’s top 10 range from roughly fairly valued to trading at a clear premium. That does not make them irrelevant for income portfolios. Several earned their valuations through compounding quality that warrants closer examination rather than dismissal.
Three valuation sub-tiers emerge within this group:
- Near fair value: T. Rowe Price (TROW) and Truist Financial (TFC), both trading within a few percentage points of Morningstar’s estimates
- Trading at a premium: Nexstar Media Group (NXST) and Franklin Resources (BEN), both above fair value after exceptional 12-month runs
- Mean-reversion candidate: Fidelity National Financial (FNF), where a strong April masked a negative trailing-year return
| Company | April 2026 Return | Current Price | Fair Value Estimate | Premium/Discount | Forward Yield |
|---|---|---|---|---|---|
| T. Rowe Price (TROW) | +14.13% | $102.88 | $105 | ~Fair value | 5.05% |
| Truist Financial (TFC) | +12.03% | $51.50 | $54 | ~Fair value | 4.04% |
| Fidelity National Financial (FNF) | +12.76% | $52.30 | N/A (quantitative) | N/A (quantitative) | 3.98% |
| Nexstar Media Group (NXST) | +15.10% | $208.14 | $190 | ~10% premium | 3.57% |
| Franklin Resources (BEN) | +26.88% | $29.97 | $26 | ~15% premium | 4.4% |
Near fair value: TROW and TFC
T. Rowe Price is the only stock in the entire group of 10 that carries a Morningstar narrow economic moat designation, meaning the firm possesses structural competitive advantages expected to persist for at least a decade. It is also a dividend aristocrat. The 5.05% forward yield (annualised dividend of $5.20) is the highest analyst-covered yield in the group, and a payout ratio of approximately 0.31 supports continued mid-single-digit dividend growth. At $102.88 against a $105 fair value estimate, TROW offers limited price upside but a yield case that compensates.
Truist Financial has climbed 39.75% over the trailing 12 months, reflecting the regional banking recovery trade. Shares sit at $51.50 against a $54 fair value estimate, with a 4.04% forward yield on an annualised payout of $2.08. For income investors already positioned, the near-fair-value reading supports holding rather than adding aggressively.
Trading at a premium after strong runs: NXST and BEN
Nexstar delivered a 44.05% trailing 12-month return and now trades at roughly a 10% premium to Morningstar’s $190 fair value estimate. Franklin Resources is further extended: a 66.68% 12-month gain has pushed shares approximately 15% above the $26 fair value mark. Both names warrant patience for a pullback before establishing new positions.
FNF sits apart from either group. A 12.76% April gain looks strong in isolation, but the stock has declined 13.55% over the trailing 12 months. That pattern suggests mean reversion rather than a fresh uptrend, and the quantitative 3-star rating offers less conviction than an analyst-backed assessment would.
The macro tailwinds driving dividend stocks in 2026
April’s dividend stock performance did not emerge in isolation. Three macro forces have converged to support the broader group, and none has meaningfully reversed heading into May.
- Federal Reserve rate stability: The Fed held rates at 3.50%-3.75% as of 1 May 2026, with market expectations pointing toward continued stability and a possible future cut. That posture keeps dividend yields competitive against fixed-income alternatives and supports equity valuations for income payers.
- Investor rotation toward income assets: Dividend growth funds have been outperforming broader benchmarks in 2026, driven by AI-related market anxiety and a broader flight toward income-producing equities. The Morningstar Dividend Composite Index advanced 4.73% in the one-month period ending 30 April 2026.
- Sector-level momentum in banking and technology: Regional banking names like TFC and semiconductor stocks like SWKS both benefited from sector rotation dynamics in April and early May, placing these names at the intersection of dividend yield and cyclical recovery.
The Federal Reserve’s May 2026 rate decision confirmed the target range for the federal funds rate at 3.50%-3.75%, reinforcing the policy stability that has kept dividend yields competitive against fixed-income alternatives throughout the year.
The Fed’s decision to hold at 3.50%-3.75% on 1 May 2026 reinforces the income-over-growth thesis that has supported outperformance across dividend strategies this year.
The Morningstar US Market Index returned 10.42% for the one-month period ending 30 April 2026, reflecting the broad market recovery that lifted dividend payers alongside growth names. The question for income investors is whether April’s individual stock moves reflect a durable repricing or a temporary spike, and the rate environment suggests the former is more likely.
Dividend stock selection criteria: what separates a strong yield from a value trap
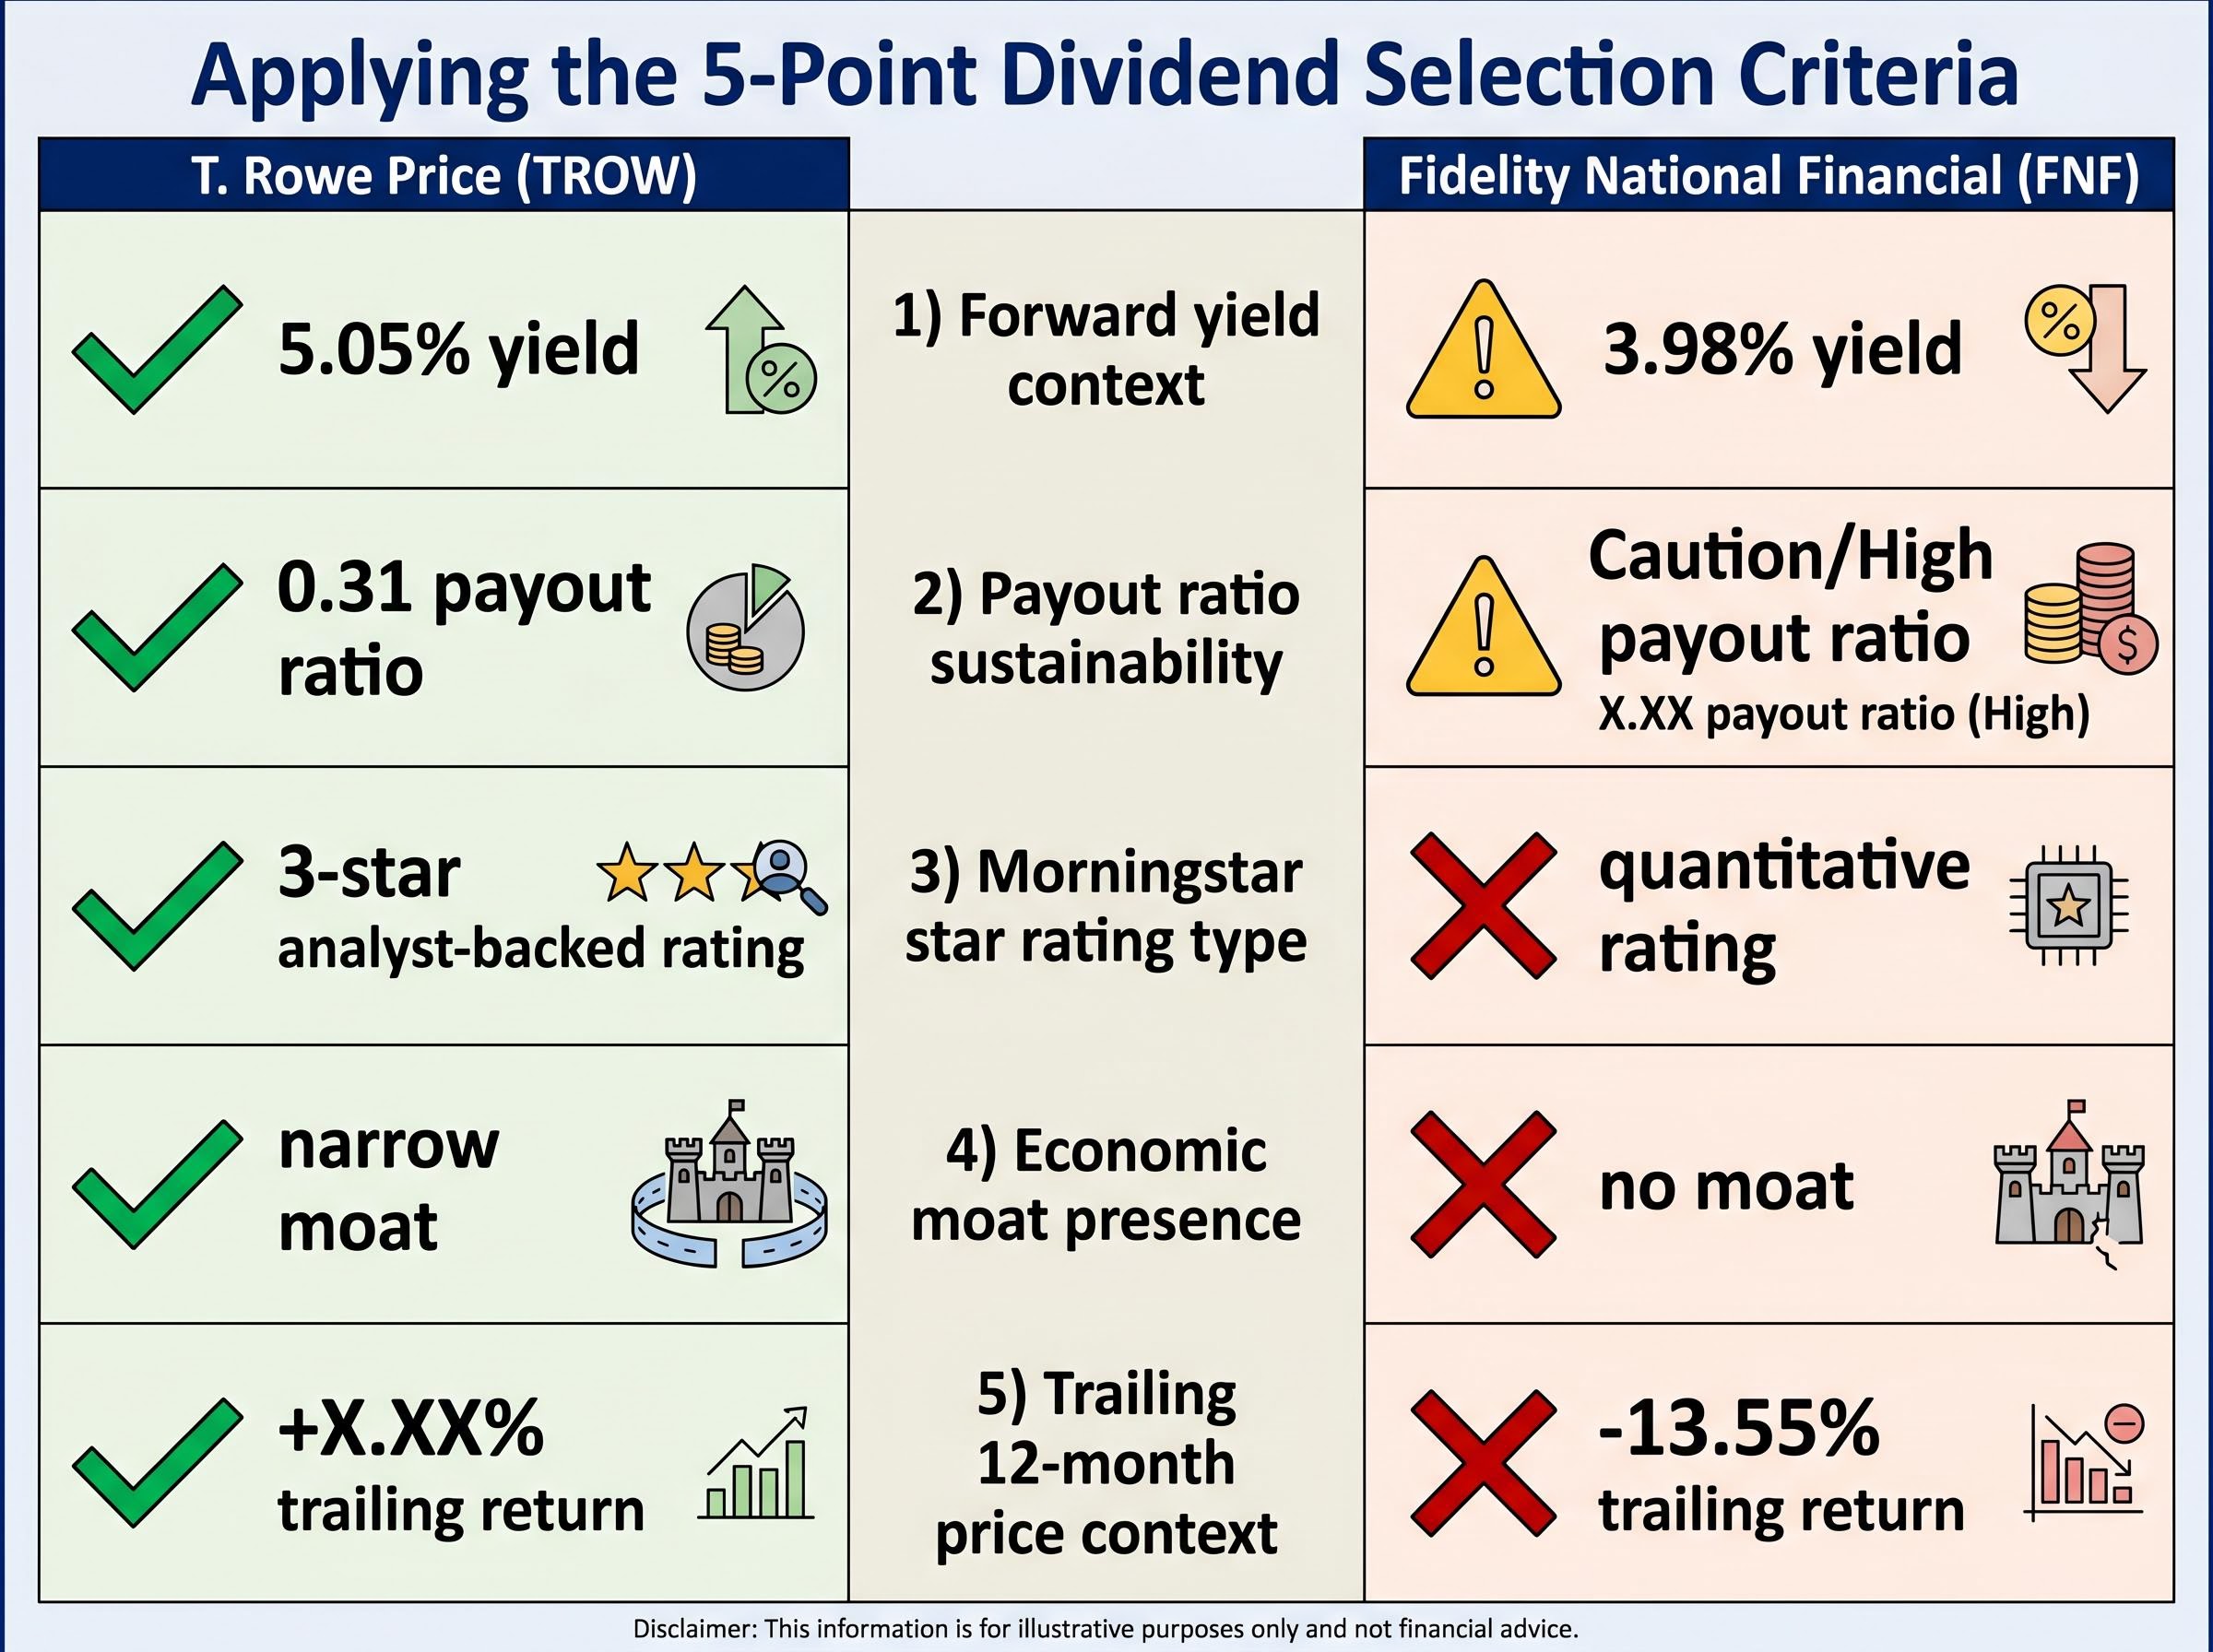
A headline yield figure can mask deteriorating fundamentals. The 10 stocks profiled above span a wide range of quality, and evaluating them requires more than a single metric. Five criteria, applied in sequence, help separate strong income opportunities from names where the yield alone is doing the selling.
- Forward yield context: A high yield matters only relative to the stock’s history, its sector, and the current rate environment. TROW’s 5.05% is compelling partly because it comes from a narrow-moat franchise, not just because the number is large.
- Payout ratio sustainability: A low payout ratio means the company retains enough earnings to grow the dividend. TROW’s ratio of approximately 0.31 is among the lowest in the group and supports continued payout increases.
- Morningstar star rating and rating type: A 4-star analyst-backed rating carries more conviction than a 5-star quantitative rating. Lazard’s top-tier quantitative score reflects statistical modelling, not direct analyst assessment.
- Economic moat presence: A moat indicates structural competitive advantages that protect earnings and, by extension, the dividend. Only TROW carries a moat designation in this group.
- Trailing 12-month price context: A strong yield on a stock that has declined significantly over the past year, like FNF at 3.98% yield with a -13.55% trailing return, warrants additional scrutiny before buying.
The yields profiled here, ranging from 3.12% at First American Financial to 5.05% at T. Rowe Price, sit well above the S&P 500 average, but the capital required to live off dividends at even these elevated rates runs into the millions for most income thresholds, a gap that shapes how investors should think about these stocks as income vehicles versus total return contributors.
Applying the checklist to April’s top 10
TROW passes on all five criteria: a 5.05% yield, a 0.31 payout ratio, an analyst-backed 3-star rating, a narrow moat, and stable 12-month price performance. It represents the quality-yield case in the group. FNF, by contrast, offers a 3.98% yield but fails on trailing price context and carries only a quantitative rating with no moat designation, illustrating why yield alone is insufficient as a selection filter.
Which April dividend leaders are still worth watching as May 2026 unfolds
The valuation data across all 10 names distils into three tiers for income investors evaluating positions in early May:
- Strongest current case: Skyworks (SWKS), CVS Health (CVS), and Lazard (LAZ), where discounts to fair value or high quantitative ratings combine with yields above 3%
- Monitor for entry: Sirius XM (SIRI), First American Financial (FAF), T. Rowe Price (TROW), and Truist Financial (TFC), where valuations sit near fair value and the yield case supports holding or selective adding
- Wait for pullback: Franklin Resources (BEN), Nexstar Media Group (NXST), and Fidelity National Financial (FNF), where premiums to fair value or divergent return profiles argue for patience
SWKS remains the most striking opportunity: a 15% discount to the $83 fair value estimate with a 4.05% yield after an exceptional April. CVS offers a 14% discount to $97 despite regulatory headwinds from the Tennessee FAIR Rx Act and FTC scrutiny. Lazard carries the highest Morningstar quantitative rating in the group at 5 stars, though the absence of an analyst-backed fair value estimate tempers conviction.
For the premium-priced names, Nexstar’s Q1 earnings, scheduled for 7 May 2026, represent a near-term catalyst worth monitoring before initiating positions. BEN and NXST trade at approximately 15% and 10% premiums to fair value respectively, following exceptional trailing-year runs. Investors should also note that quantitative ratings for FAF, LAZ, and FNF carry less conviction than analyst-backed estimates for the remaining seven names.
After April’s gains, valuation discipline separates the compelling opportunities from the momentum chasers in this dividend leader group. The macro backdrop, with the Fed potentially moving toward a rate cut and dividend growth strategies outperforming, keeps the broader thesis intact even where individual entry points demand patience.
For investors weighing whether an income-focused strategy is the right framework at all, our full explainer on dividend investing vs total return walks through a decade of backtested data, the 2026 rate environment, and a lifecycle framework that shows which approach builds more wealth at each stage, including scenarios where a high-yield portfolio like this one compares unfavourably to a total market alternative.
This article is for informational purposes only and should not be considered financial advice. Investors should conduct their own research and consult with financial professionals before making investment decisions. Past performance does not guarantee future results.