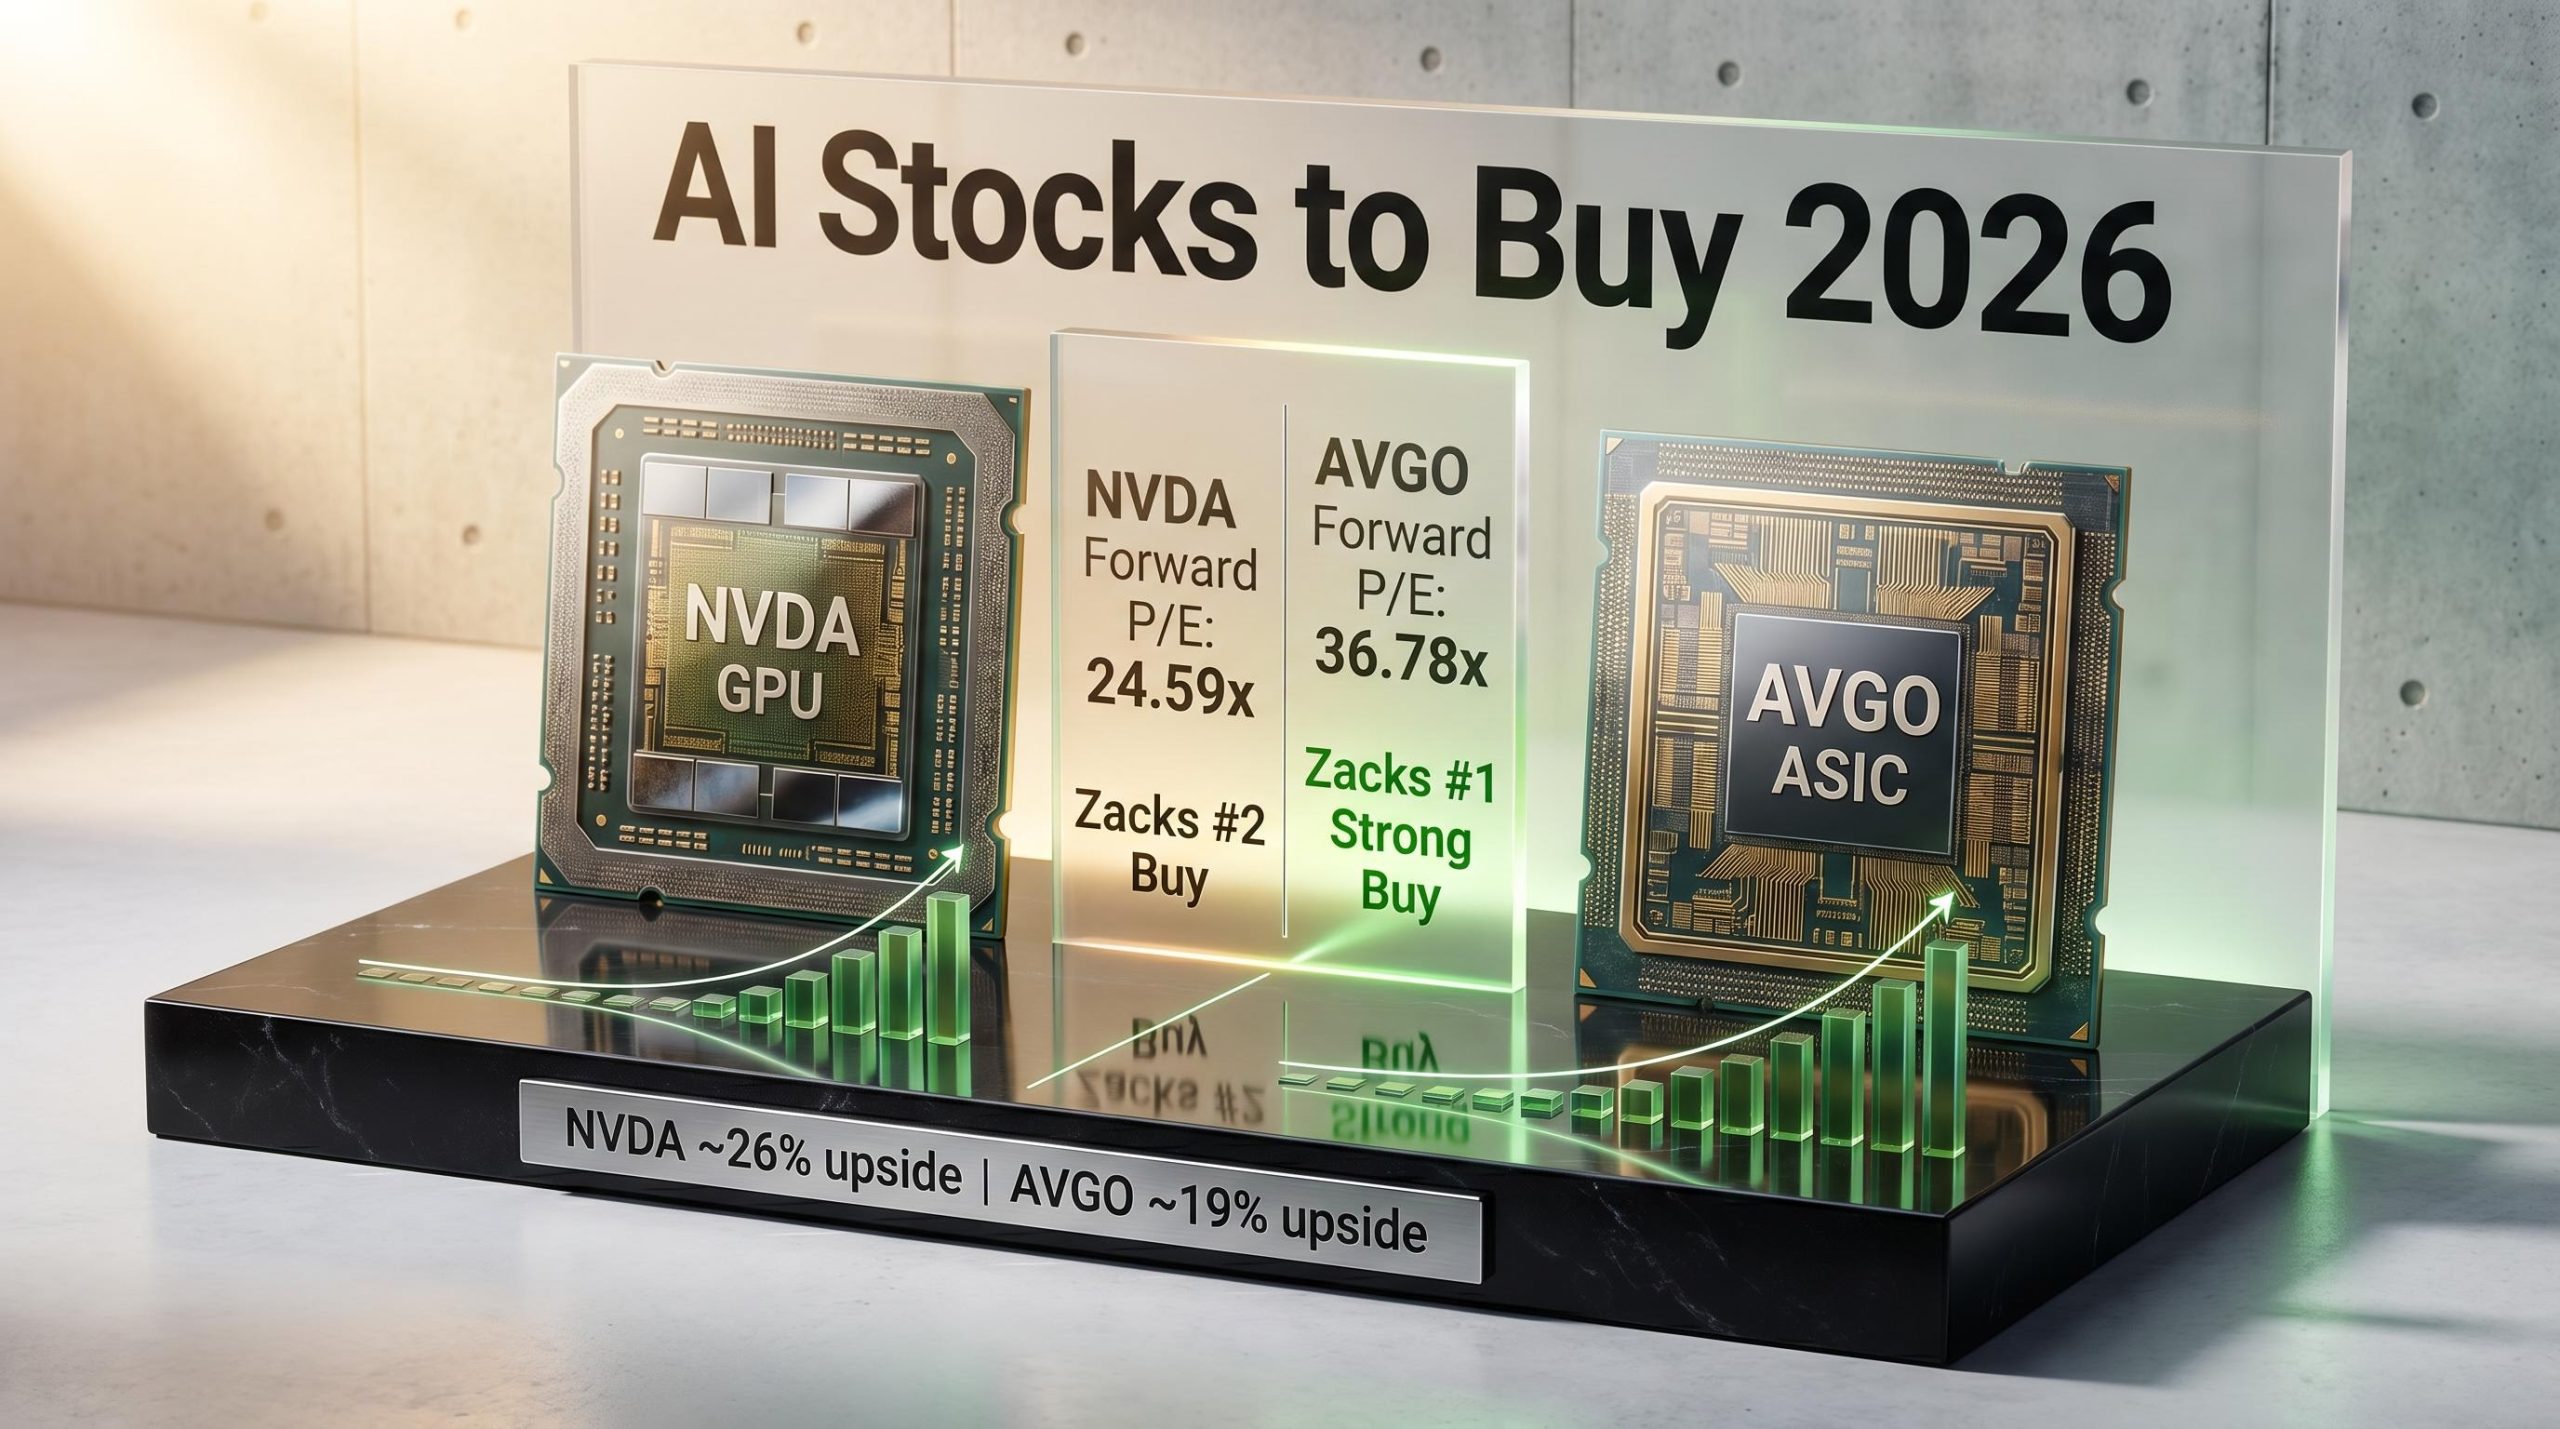
Nvidia’s forward P/E sits at 24.59x. Broadcom’s sits at 36.78x. The company analysts rate more expensive also holds the higher Zacks ranking. That inversion is the starting point for understanding how Wall Street is pricing these two AI semiconductor stocks in 2026, and what it signals about the structural differences between GPU and ASIC exposure. The debate has moved beyond theory: both stocks trade near all-time highs, both carry near-unanimous analyst buy ratings as of early May 2026, and both represent genuinely distinct risk-reward profiles. This analysis breaks down what each stock offers, where their growth cases diverge, how their balance sheets compare, and what the valuation gap between them implies for capital allocation.
The AI chip market in 2026: two dominant plays, one expanding market
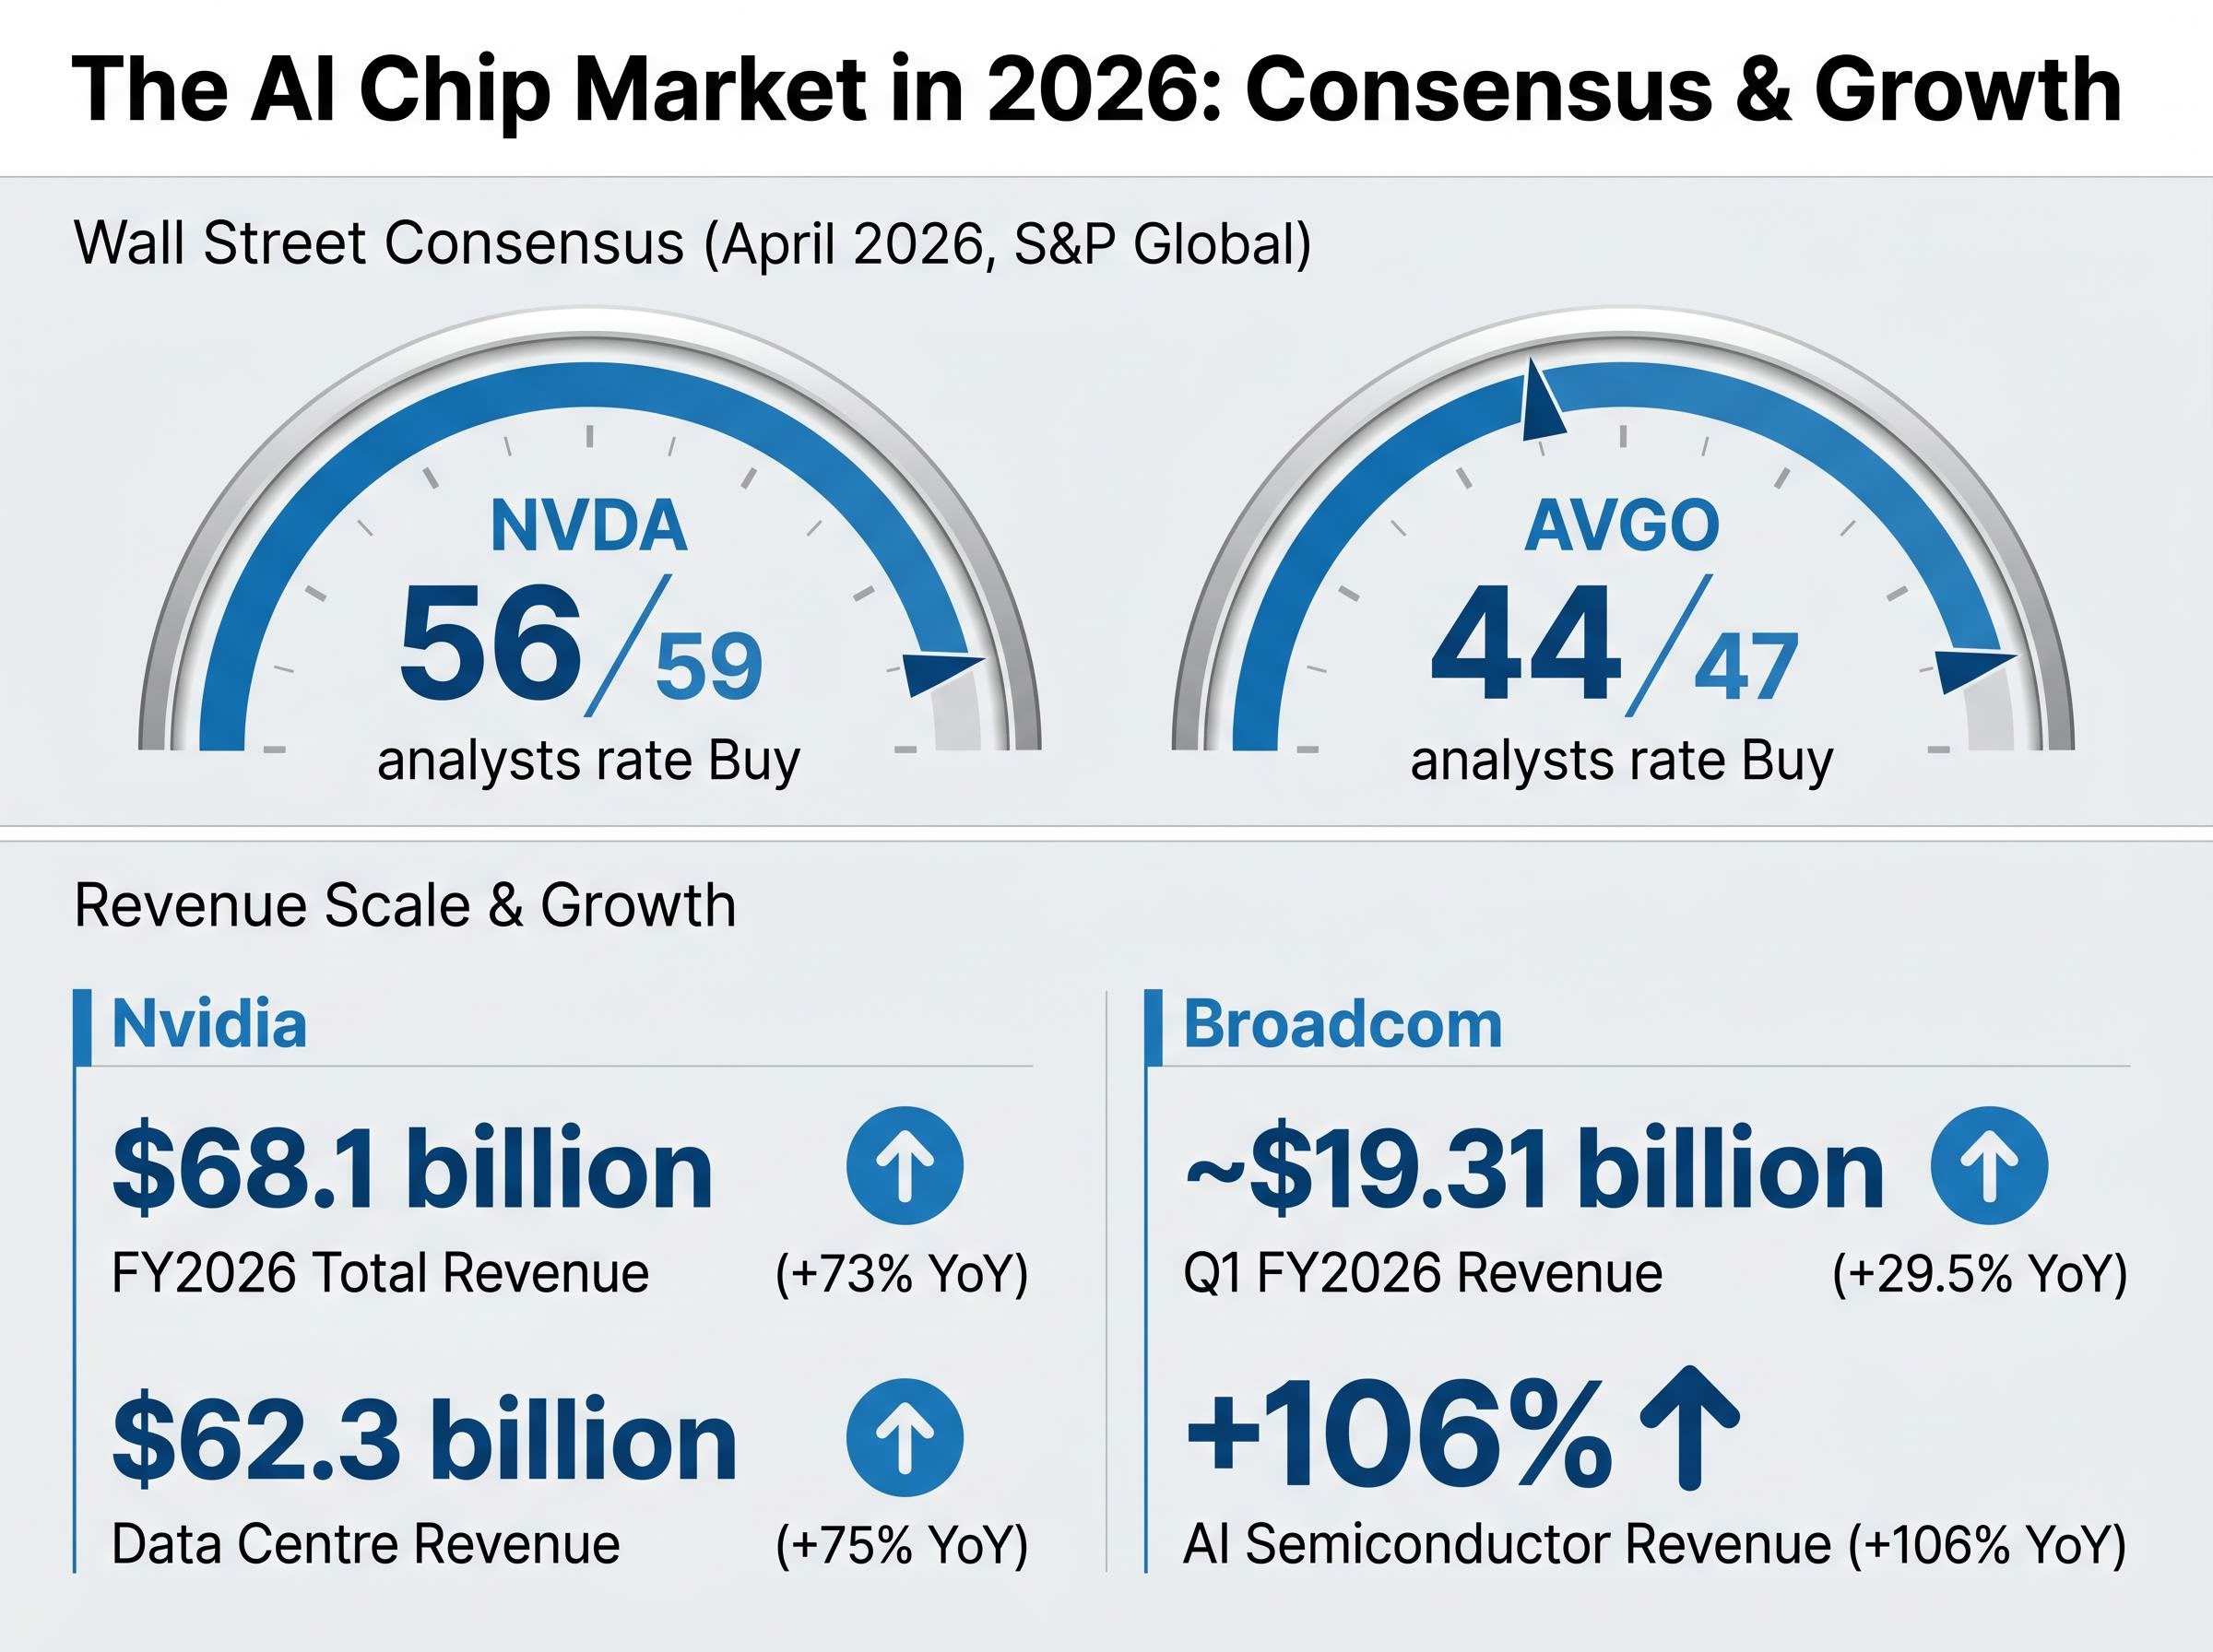
The most common error investors make when comparing Nvidia and Broadcom is framing the GPU-versus-ASIC question as a zero-sum contest. Analyst consensus, reflected in near-unanimous buy ratings for both names, suggests otherwise. According to S&P Global data from April 2026, 56 of 59 analysts covering NVDA rate it a buy, while 44 of 47 covering AVGO do the same. That breadth of conviction points to a market large enough to sustain both models simultaneously.
Gartner’s 2026 semiconductor revenue forecast projects global chip revenue exceeding $1.3 trillion, with AI semiconductors accounting for approximately 30% of that total and hyperscaler investment in AI infrastructure, spanning both GPUs and custom non-GPU chips, rising by more than 50%, a scale of capital deployment that underpins the analyst conviction behind both names.
Nvidia reported FY2026 total revenue of $68.1 billion, up 73% year on year, with data centre revenue alone reaching $62.3 billion (up 75%). Broadcom posted Q1 FY2026 revenue of approximately $19.31 billion, up roughly 29.5% year on year, with AI semiconductor revenues surging 106% over the prior year period.
The two companies occupy structurally different positions in the AI infrastructure stack:
- Nvidia: Broad GPU platform spanning training and inference workloads, supported by the CUDA software ecosystem and a multi-generation hardware pipeline
- Broadcom: Custom ASIC design and fabrication for hyperscaler clients, paired with an Ethernet AI networking switch business
- Shared layer: Both companies benefit from the same macro capital expenditure cycle in AI infrastructure, but through different revenue mechanisms and customer relationships
Understanding that distinction is the prerequisite for reading the valuation data that follows.
The AI capital expenditure cycle underpinning both companies is projected to reach $650 billion across the four largest hyperscalers in 2026, with early monetisation evidence including AWS reaching a $15 billion annualised AI run rate in Q1 2026 and Google Cloud posting 48% revenue growth, providing the demand floor that supports analyst conviction on both NVDA and AVGO simultaneously.
When big ASX news breaks, our subscribers know first
How Nvidia’s GPU platform became the default AI infrastructure layer
Nvidia’s dominance did not arrive in a single product cycle. It compounded across three reinforcing layers that, taken together, make displacement structurally difficult rather than merely unlikely.
The first layer is hardware pipeline depth. The Vera Rubin platform launched on 5 January 2026 at CES, comprising six new chips, and has entered full production as of May 2026. It sits alongside Blackwell, Blackwell Ultra, and Hopper 300, giving Nvidia overlapping product generations serving different price and performance tiers. No competitor currently matches that breadth of concurrent platforms.
The second layer is CUDA, Nvidia’s proprietary software development environment. Enterprises that have built training and inference workflows on CUDA face meaningful switching costs: rewriting codebases, retraining engineering teams, and revalidating model performance. That software lock-in converts hardware customers into recurring platform users.
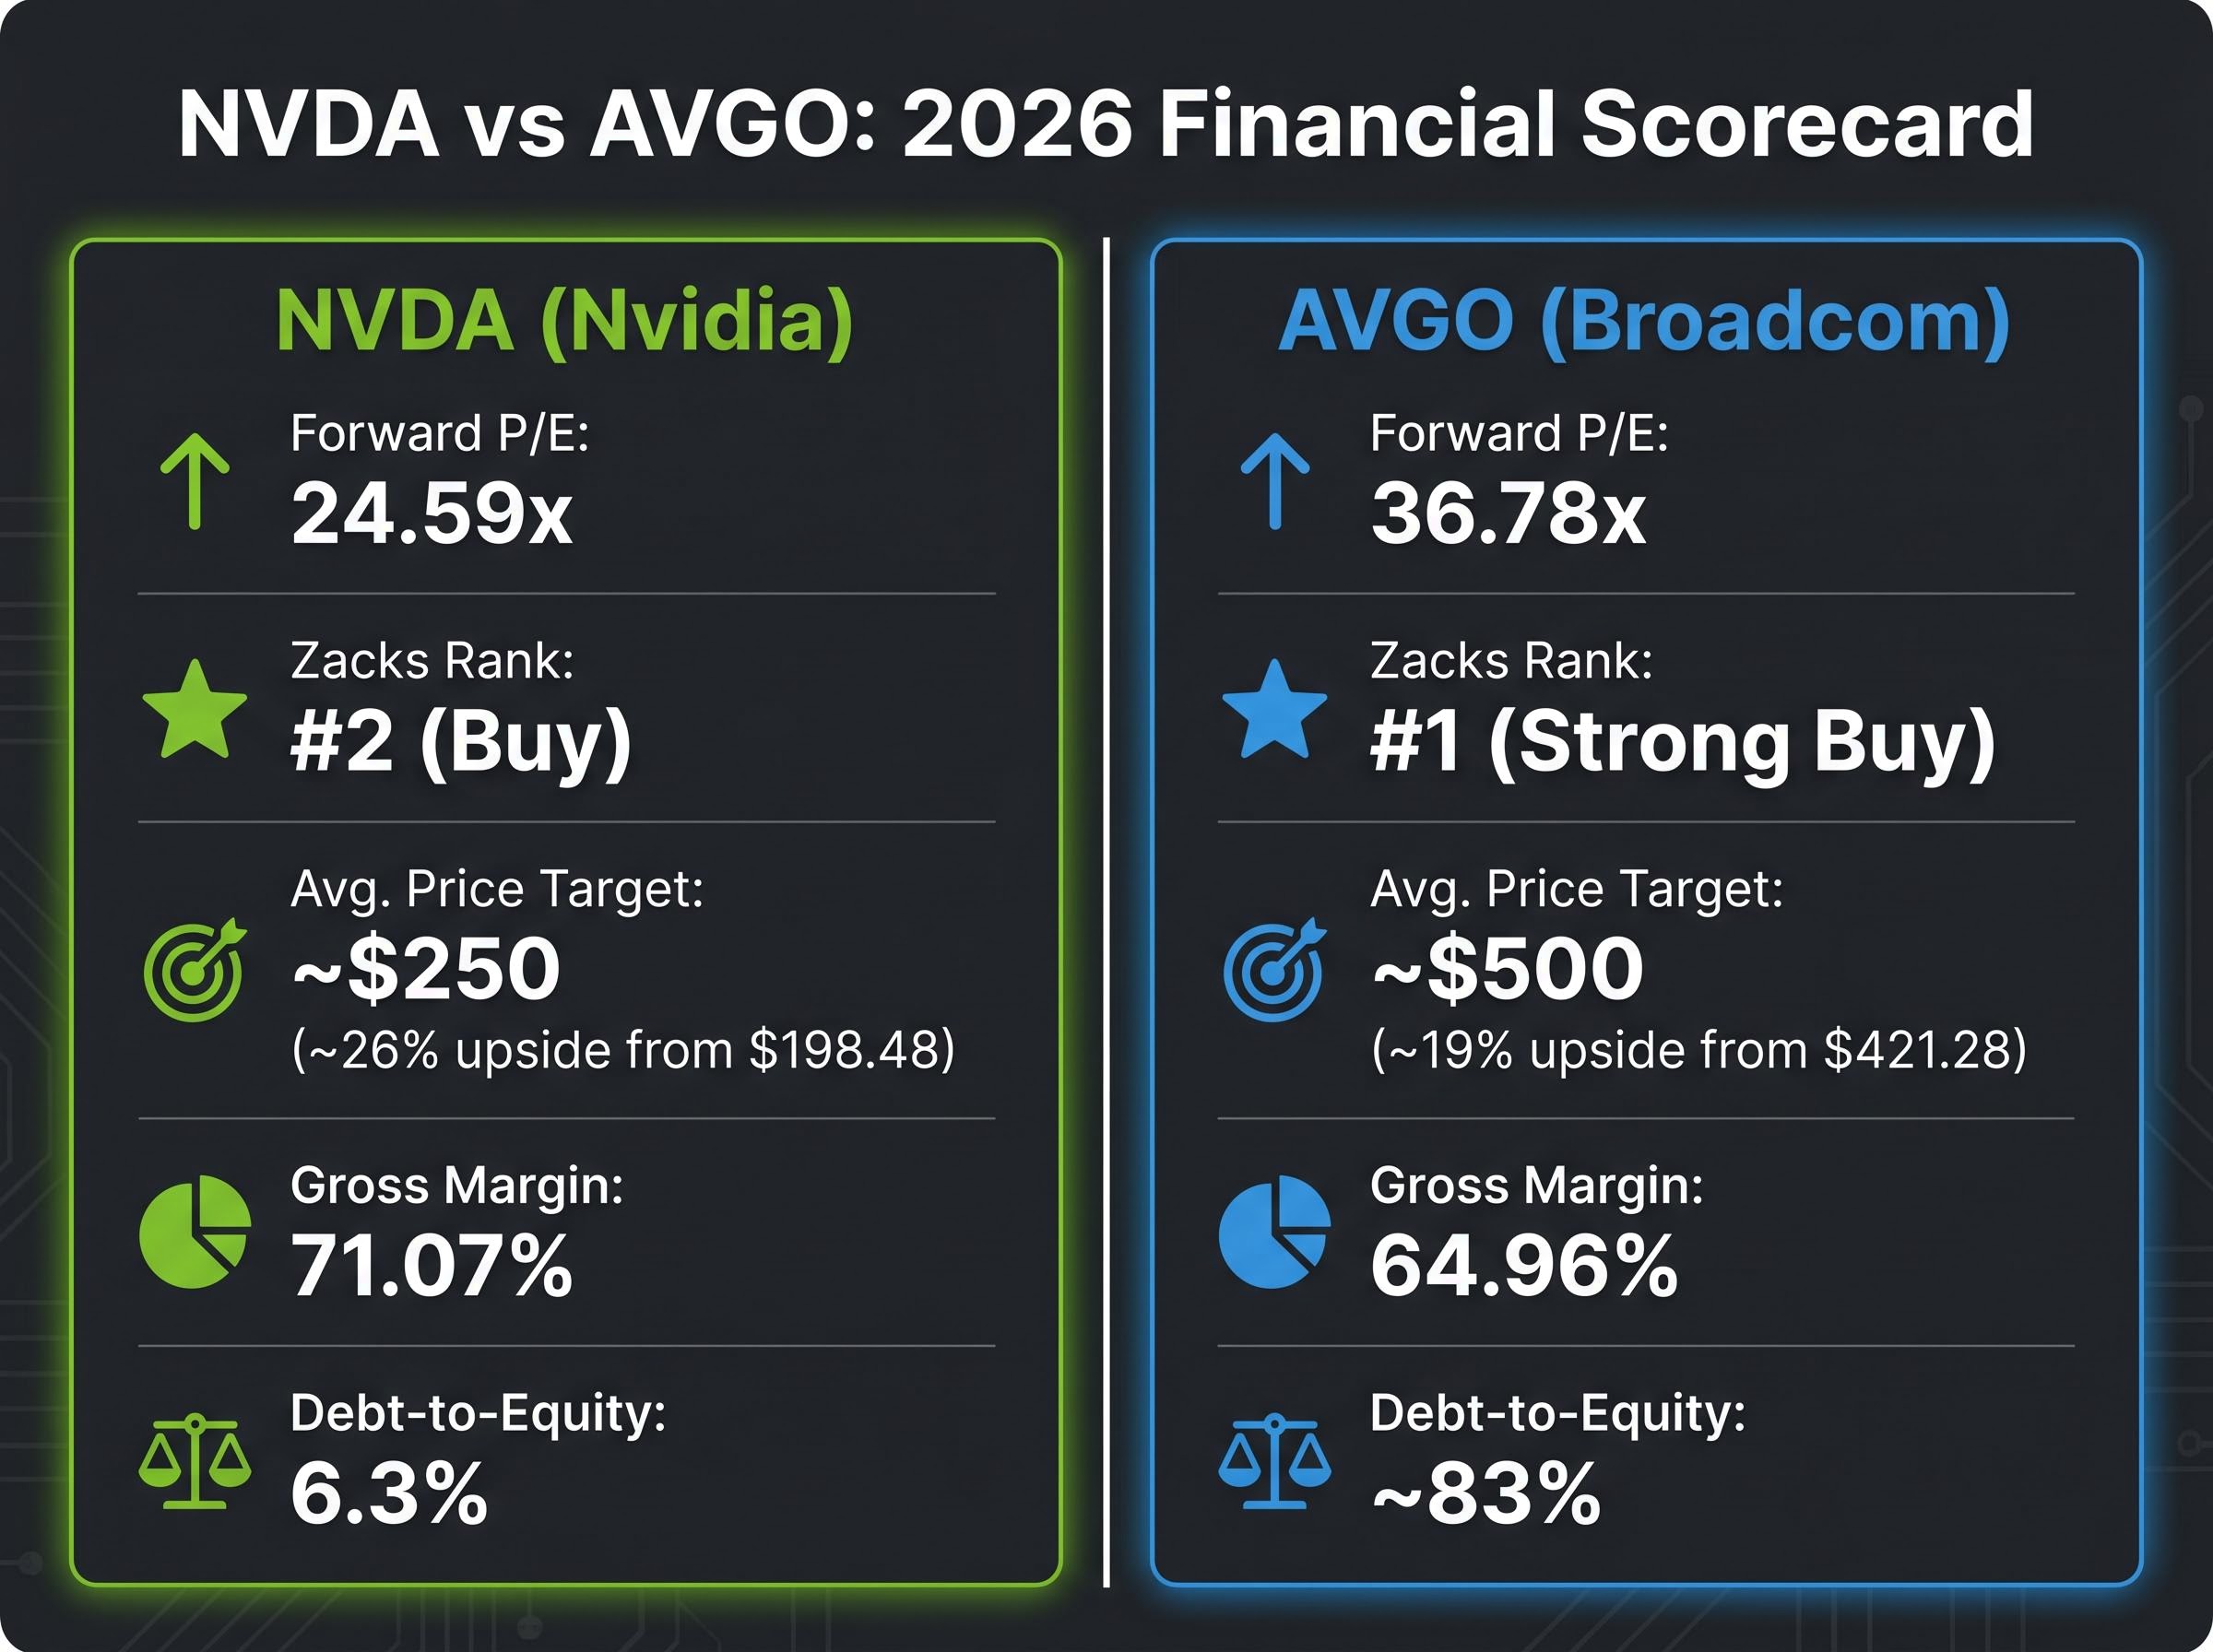
The third layer is balance sheet conservatism. Nvidia carries a debt-to-equity ratio of approximately 6.3%, leaving substantial capacity for investment, buybacks, or weathering a demand slowdown without structural financial risk.
- Hardware pipeline: Vera Rubin, Blackwell, Blackwell Ultra, and Hopper 300 provide overlapping generational coverage
- CUDA software lock-in: High switching costs for enterprises already embedded in Nvidia’s development environment
- Balance sheet strength: Debt-to-equity of approximately 6.3% supports sustained investment and earnings durability
Gross margin: 71.07% Nvidia’s gross margin of 71.07% reflects pricing power consistent with a platform business rather than a commodity hardware supplier. That margin level directly supports earnings quality and reinvestment capacity across product cycles.
Broadcom’s ASIC model: what custom silicon actually means for hyperscalers (and investors)
The question is not whether hyperscalers like GPUs. They do; they buy them in volume. The question is why they simultaneously commission custom accelerators from Broadcom, and what that parallel investment implies about revenue durability.
Broadcom reported FY2025 Q4 total revenues of $18 billion, up 28% year on year, with its AI segment growing 74% over the same period. Q1 FY2026 revenues reached approximately $19.31 billion. CEO Hock Tan has pointed to agentic AI and generative AI workloads as the demand drivers pushing hyperscalers toward Broadcom’s VMware cloud infrastructure and custom silicon offerings.
An ASIC, or application-specific integrated circuit, is a chip designed for a single defined task rather than general-purpose computation. Hyperscalers commission ASICs from Broadcom when they need silicon optimised for a known, stable workload at enormous scale, particularly inference workloads where the computational task is predictable and repeatable.
Why hyperscalers build custom chips instead of buying Nvidia GPUs
Three motivations drive the custom silicon decision at hyperscaler scale:
- Cost-per-inference economics: At the volumes hyperscalers operate, even marginal efficiency gains per chip translate to hundreds of millions in annual savings. ASICs, purpose-built for specific inference tasks, can deliver lower cost per operation than general-purpose GPUs
- Workload specificity: Training requires flexible, general-purpose compute. Inference, once the model is trained, benefits from chips optimised for a narrow, well-defined task. ASICs excel at this
- Supply chain independence: Large cloud providers have strategic reasons to avoid single-vendor GPU dependency. Commissioning custom silicon from Broadcom diversifies their hardware supply chain
That said, the concentration risk runs in both directions. Broadcom’s ASIC revenue is tied to a small number of very large customers. Any single relationship change could have an outsized impact on revenue. The company’s gross margin of 64.96% is strong but sits below Nvidia’s, reflecting the economics of a design-partner model versus a platform model. Broadcom also pays a dividend yield of 0.60%, a distinction that matters for income-oriented investors.
Valuation gap and what the numbers actually signal
The surface-level read is straightforward: Nvidia trades at a forward P/E of 24.59x, Broadcom at 36.78x, and yet Broadcom holds the higher Zacks ranking. That inversion deserves more than a glance.
A higher forward P/E does not automatically signal overvaluation. It can also reflect the market pricing a different growth profile, a different competitive position, or a different risk premium. In Broadcom’s case, the PEG ratio of 0.52 suggests the market is pricing moderated long-term growth expectations into the premium rather than speculative excess. Nvidia’s FY2027 EPS growth is estimated at approximately 22.3%, supporting its lower multiple with strong but not extraordinary forward earnings expansion.
The price target data adds another layer. Nvidia’s average analyst price target of approximately $250 implies roughly 26% upside from its $198.48 level. Broadcom’s average target of approximately $500 implies roughly 19% upside from $421.28. The stock with greater implied upside carries the lower Zacks ranking.
Nvidia’s capital return policy sits at the centre of a separate but related valuation argument: Bank of America analysts contend that raising the dividend yield from its current 0.02% to a 0.5-1.0% range would structurally expand the institutional buyer base, catalysing a multiple re-rating that is entirely independent of the AI demand case.
Zacks ranking inversion: Broadcom holds a #1 (Strong Buy) ranking despite a higher forward P/E, while Nvidia sits at #2 (Buy) with greater implied price target upside. This reflects the Zacks methodology weighting recent earnings estimate revisions, not a simple valuation call.
| Metric | NVDA | AVGO | Investor Implication |
|---|---|---|---|
| Forward P/E | 24.59x | 36.78x | AVGO commands a premium; PEG ratio contextualises it |
| Zacks Rank | #2 (Buy) | #1 (Strong Buy) | Higher rank reflects recent earnings revision momentum |
| Avg. Price Target | ~$250 | ~$500 | NVDA offers greater dollar upside from current price |
| Implied Upside | ~26% | ~19% | Greater upside at lower multiple favours NVDA on value |
| PEG Ratio | N/A | 0.52 | Suggests AVGO premium reflects moderated growth pricing |
| FY2027 EPS Growth | ~22.3% | PEG-implied moderation | NVDA growth rate supports lower multiple assessment |
The valuation comparison is where many retail investors make the largest analytical errors. These metrics allow each stock to be read on its own terms rather than through a single crude multiple.
Risk profile: where each stock is genuinely vulnerable
Both stocks carry near-unanimous analyst support. Neither is a speculative position at current revenue scale. The relevant question for portfolio construction is where each name breaks, and whether those break points overlap.
Nvidia’s key risks:
- Export controls: Tightened US restrictions on AI chip sales to China have affected an estimated 10-15% of data centre revenue, and the regulatory trajectory suggests this remains an ongoing headwind rather than a resolved event
- ASIC competition: Long-term risk that hyperscalers shift a greater share of inference workloads to custom silicon, compressing GPU addressable market
- Supply chain concentration: Manufacturing and advanced packaging constraints remain potential bottlenecks
Broadcom’s key risks:
- Leverage: A debt-to-equity ratio of approximately 83% creates vulnerability to interest rate increases or revenue slowdowns, a structural exposure that Nvidia’s 6.3% ratio does not share
- Hyperscaler concentration: Revenue depends on a small number of very large customers; the loss of any single relationship could produce outsized impact
- Export controls: Faces similar China-related regulatory risk, though with somewhat more diversified client geography than Nvidia in certain segments
Nvidia’s 52-week trading range of $110.82 to $216.82 illustrates the volatility investors have absorbed, though the trajectory has been upward within that range.
The export control overhang and what it means for both stocks
US export controls on AI chips to China are the primary exogenous variable for the sector. For Nvidia, the exposure is quantifiable: an estimated 10-15% of data centre revenue is affected, and further tightening remains possible. For Broadcom, the exposure is less direct but present, moderated by somewhat greater client geographic diversification.
Investors holding either name should monitor US-China trade policy developments as the single most important external risk factor. Neither company’s investment thesis breaks under base-case assumptions, but both carry regulatory tail risk that could alter revenue trajectories.
China AI revenue timing adds a further complication: Morgan Stanley’s AlphaWise CIO survey of Chinese enterprises found 47% of buyers targeting 2027 for initial AI project rollouts, driven by GPU supply constraints and domestic compute readiness gaps, which means the export control headwind for Nvidia compounds with a demand-side delay even in scenarios where restrictions ease.
What the GPU-versus-ASIC debate means for portfolio allocation in 2026
The comparison resolves not as a winner-loser verdict but as a portfolio construction question. Each stock fits a different investor profile.
Nvidia fits investors who:
- Prioritise greater implied upside (approximately 26% to average price target)
- Value balance sheet conservatism (debt-to-equity of 6.3%)
- Want broad AI compute exposure across training and inference through a platform ecosystem
- Accept a #2 Buy Zacks ranking in exchange for lower leverage and higher upside
Broadcom fits investors who:
- Weight analyst ranking momentum (#1 Strong Buy Zacks ranking)
- Prefer the custom silicon model and hyperscaler-partnership revenue structure
- Value income generation (0.60% dividend yield) alongside growth
- Can absorb higher leverage risk (debt-to-equity of approximately 83%)
For investors seeking broader AI value chain exposure beyond the GPU-versus-ASIC comparison, AMD (Zacks #2, forward P/E approximately 32x) and Microsoft offer diversification across the semiconductor and cloud layers respectively.
The AI infrastructure supply chain extends well beyond the GPU-versus-ASIC comparison: Samsung, SK Hynix, and TSMC collectively capture roughly 75% of hyperscaler hardware spending according to market analysis published in May 2026, and Asian semiconductor indices trade at approximately half the forward P/E of Nasdaq 100 equivalents despite faster projected earnings growth, making them a meaningful diversification consideration for investors already holding NVDA or AVGO.
The analyst consensus supporting both stocks simultaneously reflects the view that AI infrastructure spending is large enough to sustain multiple dominant players. The choice between Nvidia and Broadcom is ultimately a risk-profile decision, not a call on which technology displaces the other.
Two routes to the same AI infrastructure thesis
Nvidia and Broadcom represent structurally different expressions of the same macro bet on AI infrastructure growth. Nvidia offers greater implied upside and a conservative balance sheet; Broadcom offers a higher analyst ranking and the custom silicon model. Neither is a speculative position given their revenue scale and the breadth of analyst support behind each.
The GPU-versus-ASIC question is likely to remain unresolved through 2026-2027, making diversified exposure across both names a defensible allocation strategy for investors positioned for the full AI infrastructure buildout.
Zacks rankings and price target updates shift frequently given the active analyst coverage cycle on both stocks. Monitoring US export control policy remains the most important external variable for the sector.
This article is for informational purposes only and should not be considered financial advice. Investors should conduct their own research and consult with financial professionals before making investment decisions. Past performance does not guarantee future results. Financial projections are subject to market conditions and various risk factors.