Why Flight Centre’s Share Price Rose on an Earnings Downgrade
58 mins ago
Since 1980, the ASX 200 has returned an average of just 0.17% in May, finishing positive in roughly 63% of years. Averages, though, are made in normal years. May 2026 is not a normal year.
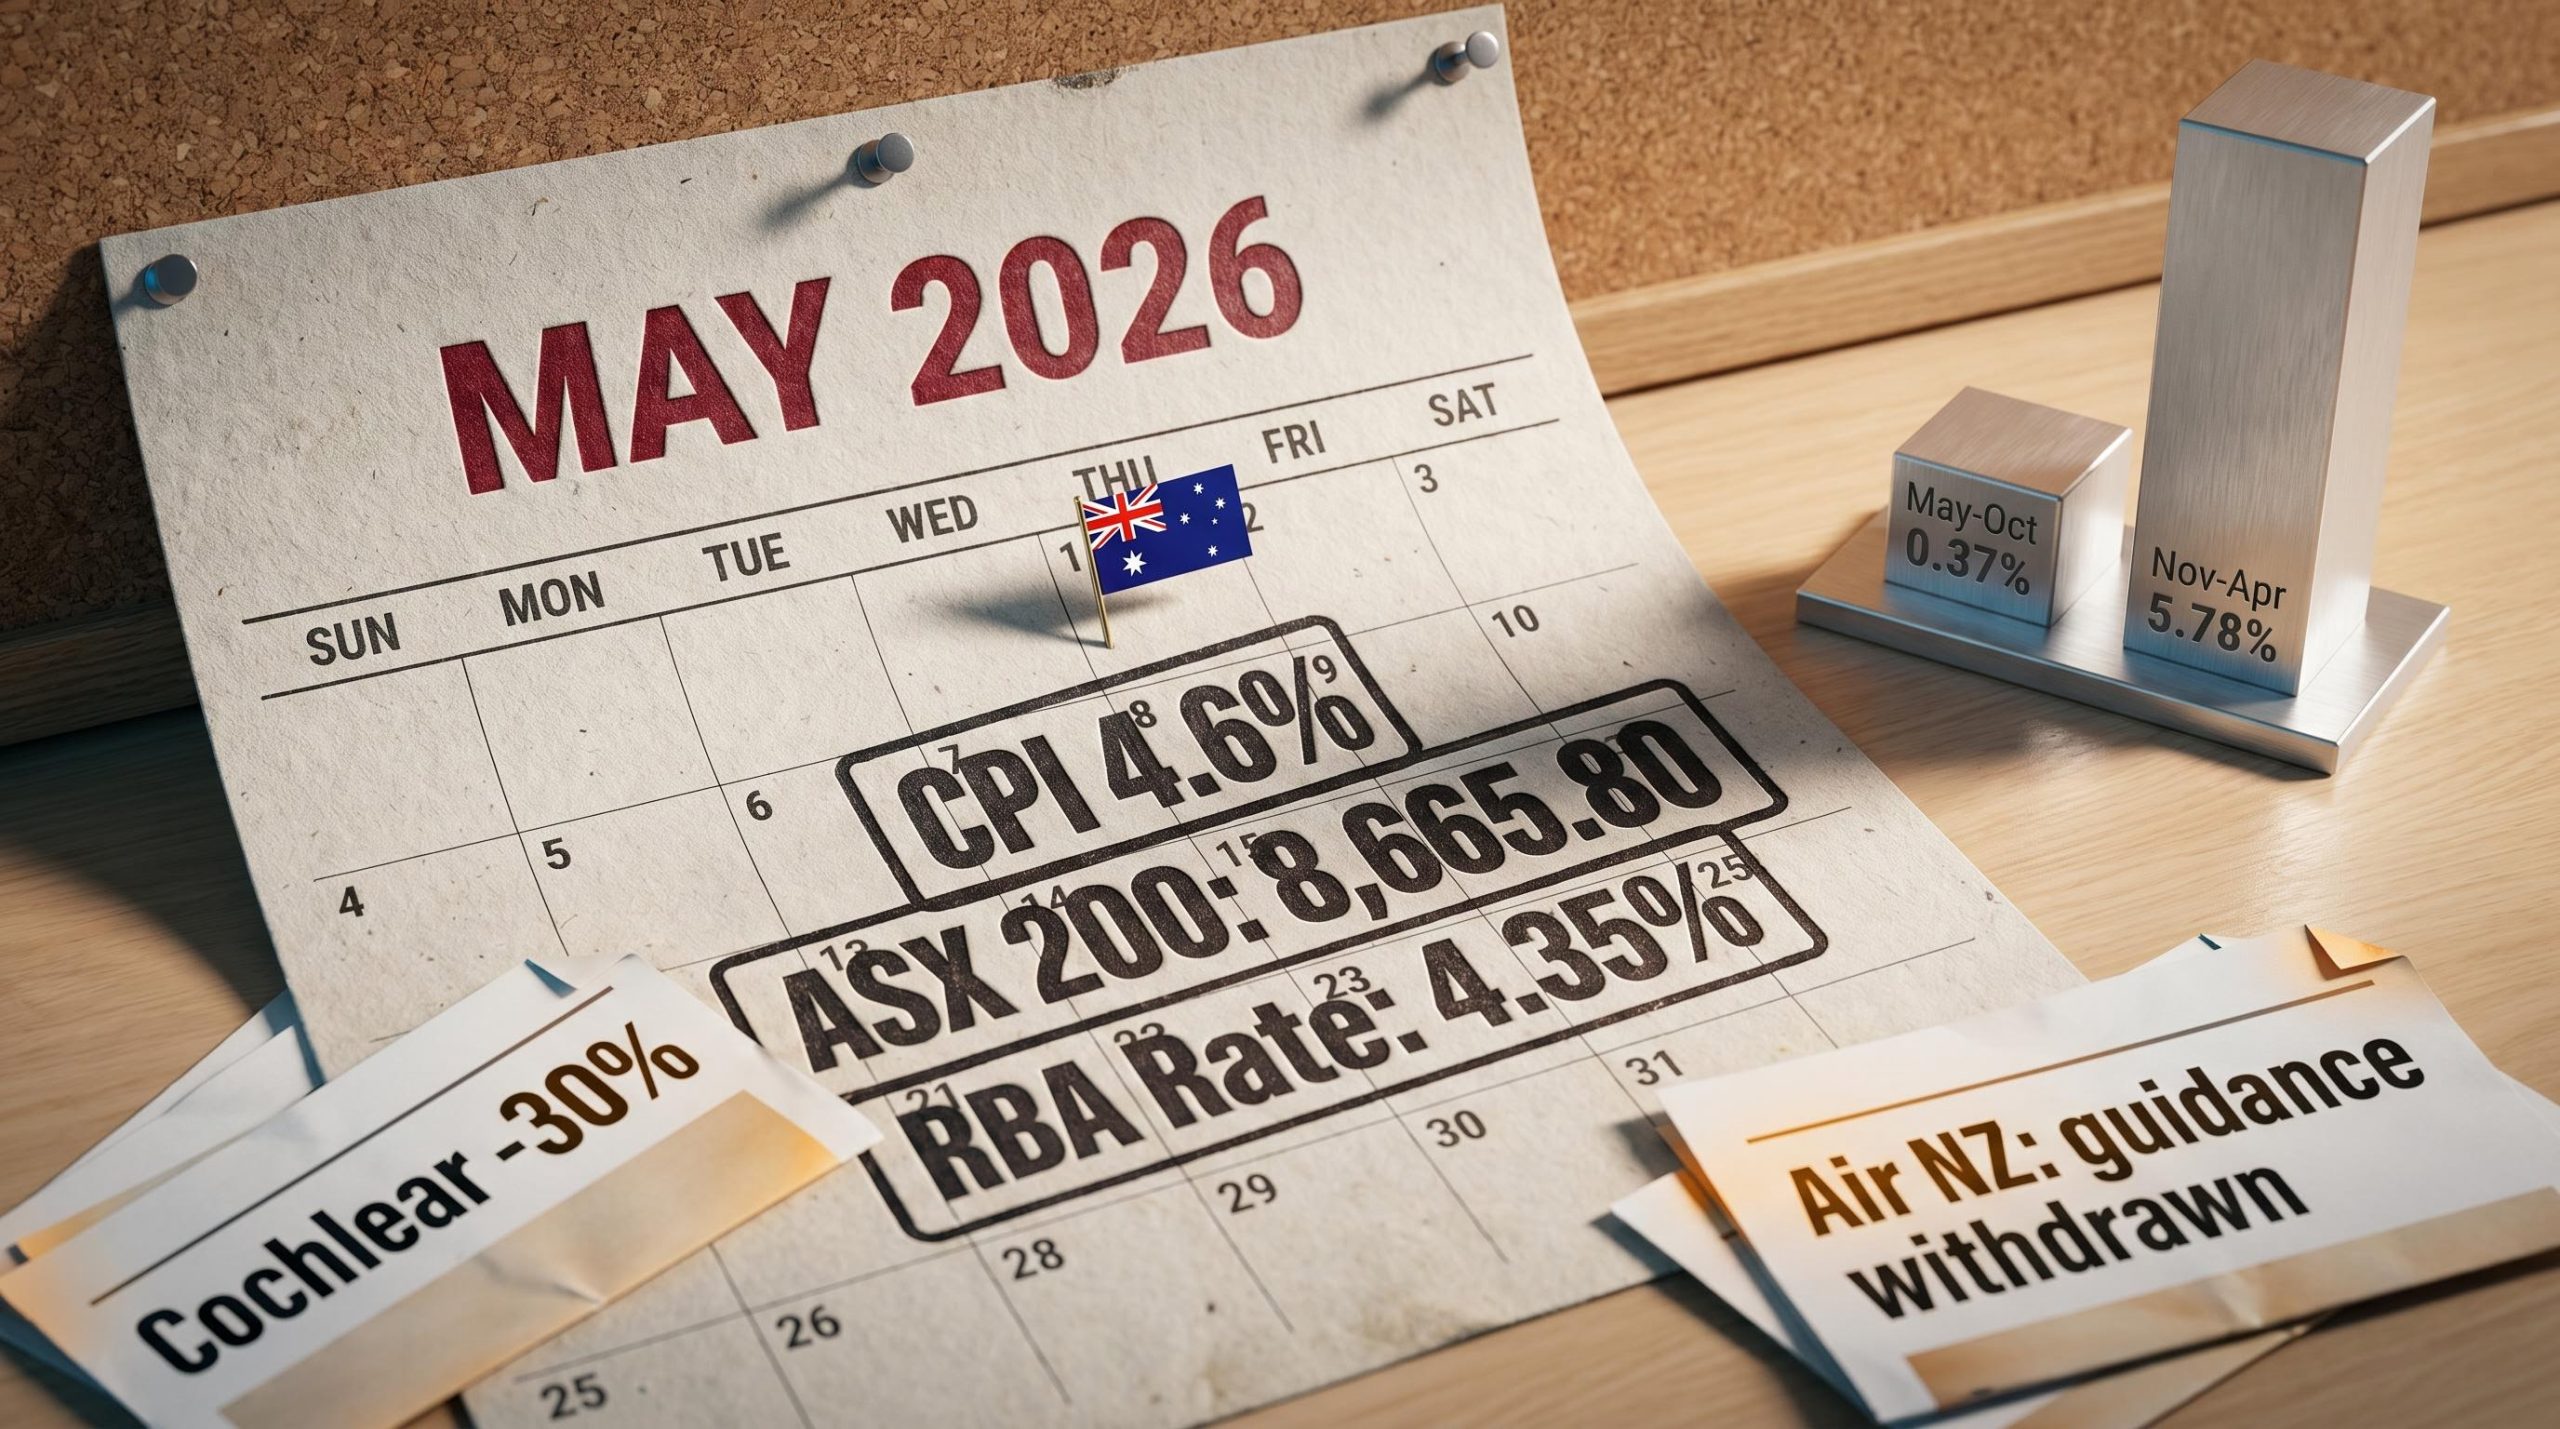
Australia’s annual inflation hit 4.6% in March, the highest reading since September 2023. The Reserve Bank of Australia (RBA) met on 4-5 May to consider what would be a third consecutive rate hike. A wave of corporate earnings downgrades has swept multiple ASX sectors over the past fortnight, touching healthcare, consumer staples, financials, and industrials. The ASX 200 itself closed April at 8,665.80, ending the month roughly flat year-to-date after a volatile run from an 8,262 March low to a 9,021 mid-April peak and back again.
What follows puts the “Sell in May” adage to work as an analytical lens rather than a trading rule. Four decades of ASX data sit alongside the specific macro conditions of May 2026 to give investors a grounded framework for what seasonal caution does, and does not, tell them right now.
The long-run numbers deserve a careful reading before any verdict. Since 1980, the ASX 200’s average May return of 0.17% and its 63% positive hit rate are real, but they describe a month that is mildly positive more often than not. That is a weaker pattern than its reputation suggests.
The most recent decade sharpens the picture further. Between 2016 and 2025, the average May return improved to 0.51%, with a 70% positive hit rate. Year by year, the variation is wide:
Two years delivered losses above 3%. Three years delivered gains above 1.5%. The pattern is inconsistent enough that acting on the single-month figure alone would have been a coin toss with a slight positive edge.
The stronger statistical claim sits not in May alone but in the six-month stretch from May to October. Using total returns data from May 2001, the mean monthly May return drops to -0.04% with a 68% positive hit rate. But the cumulative gap between halves is where the asymmetry becomes material.
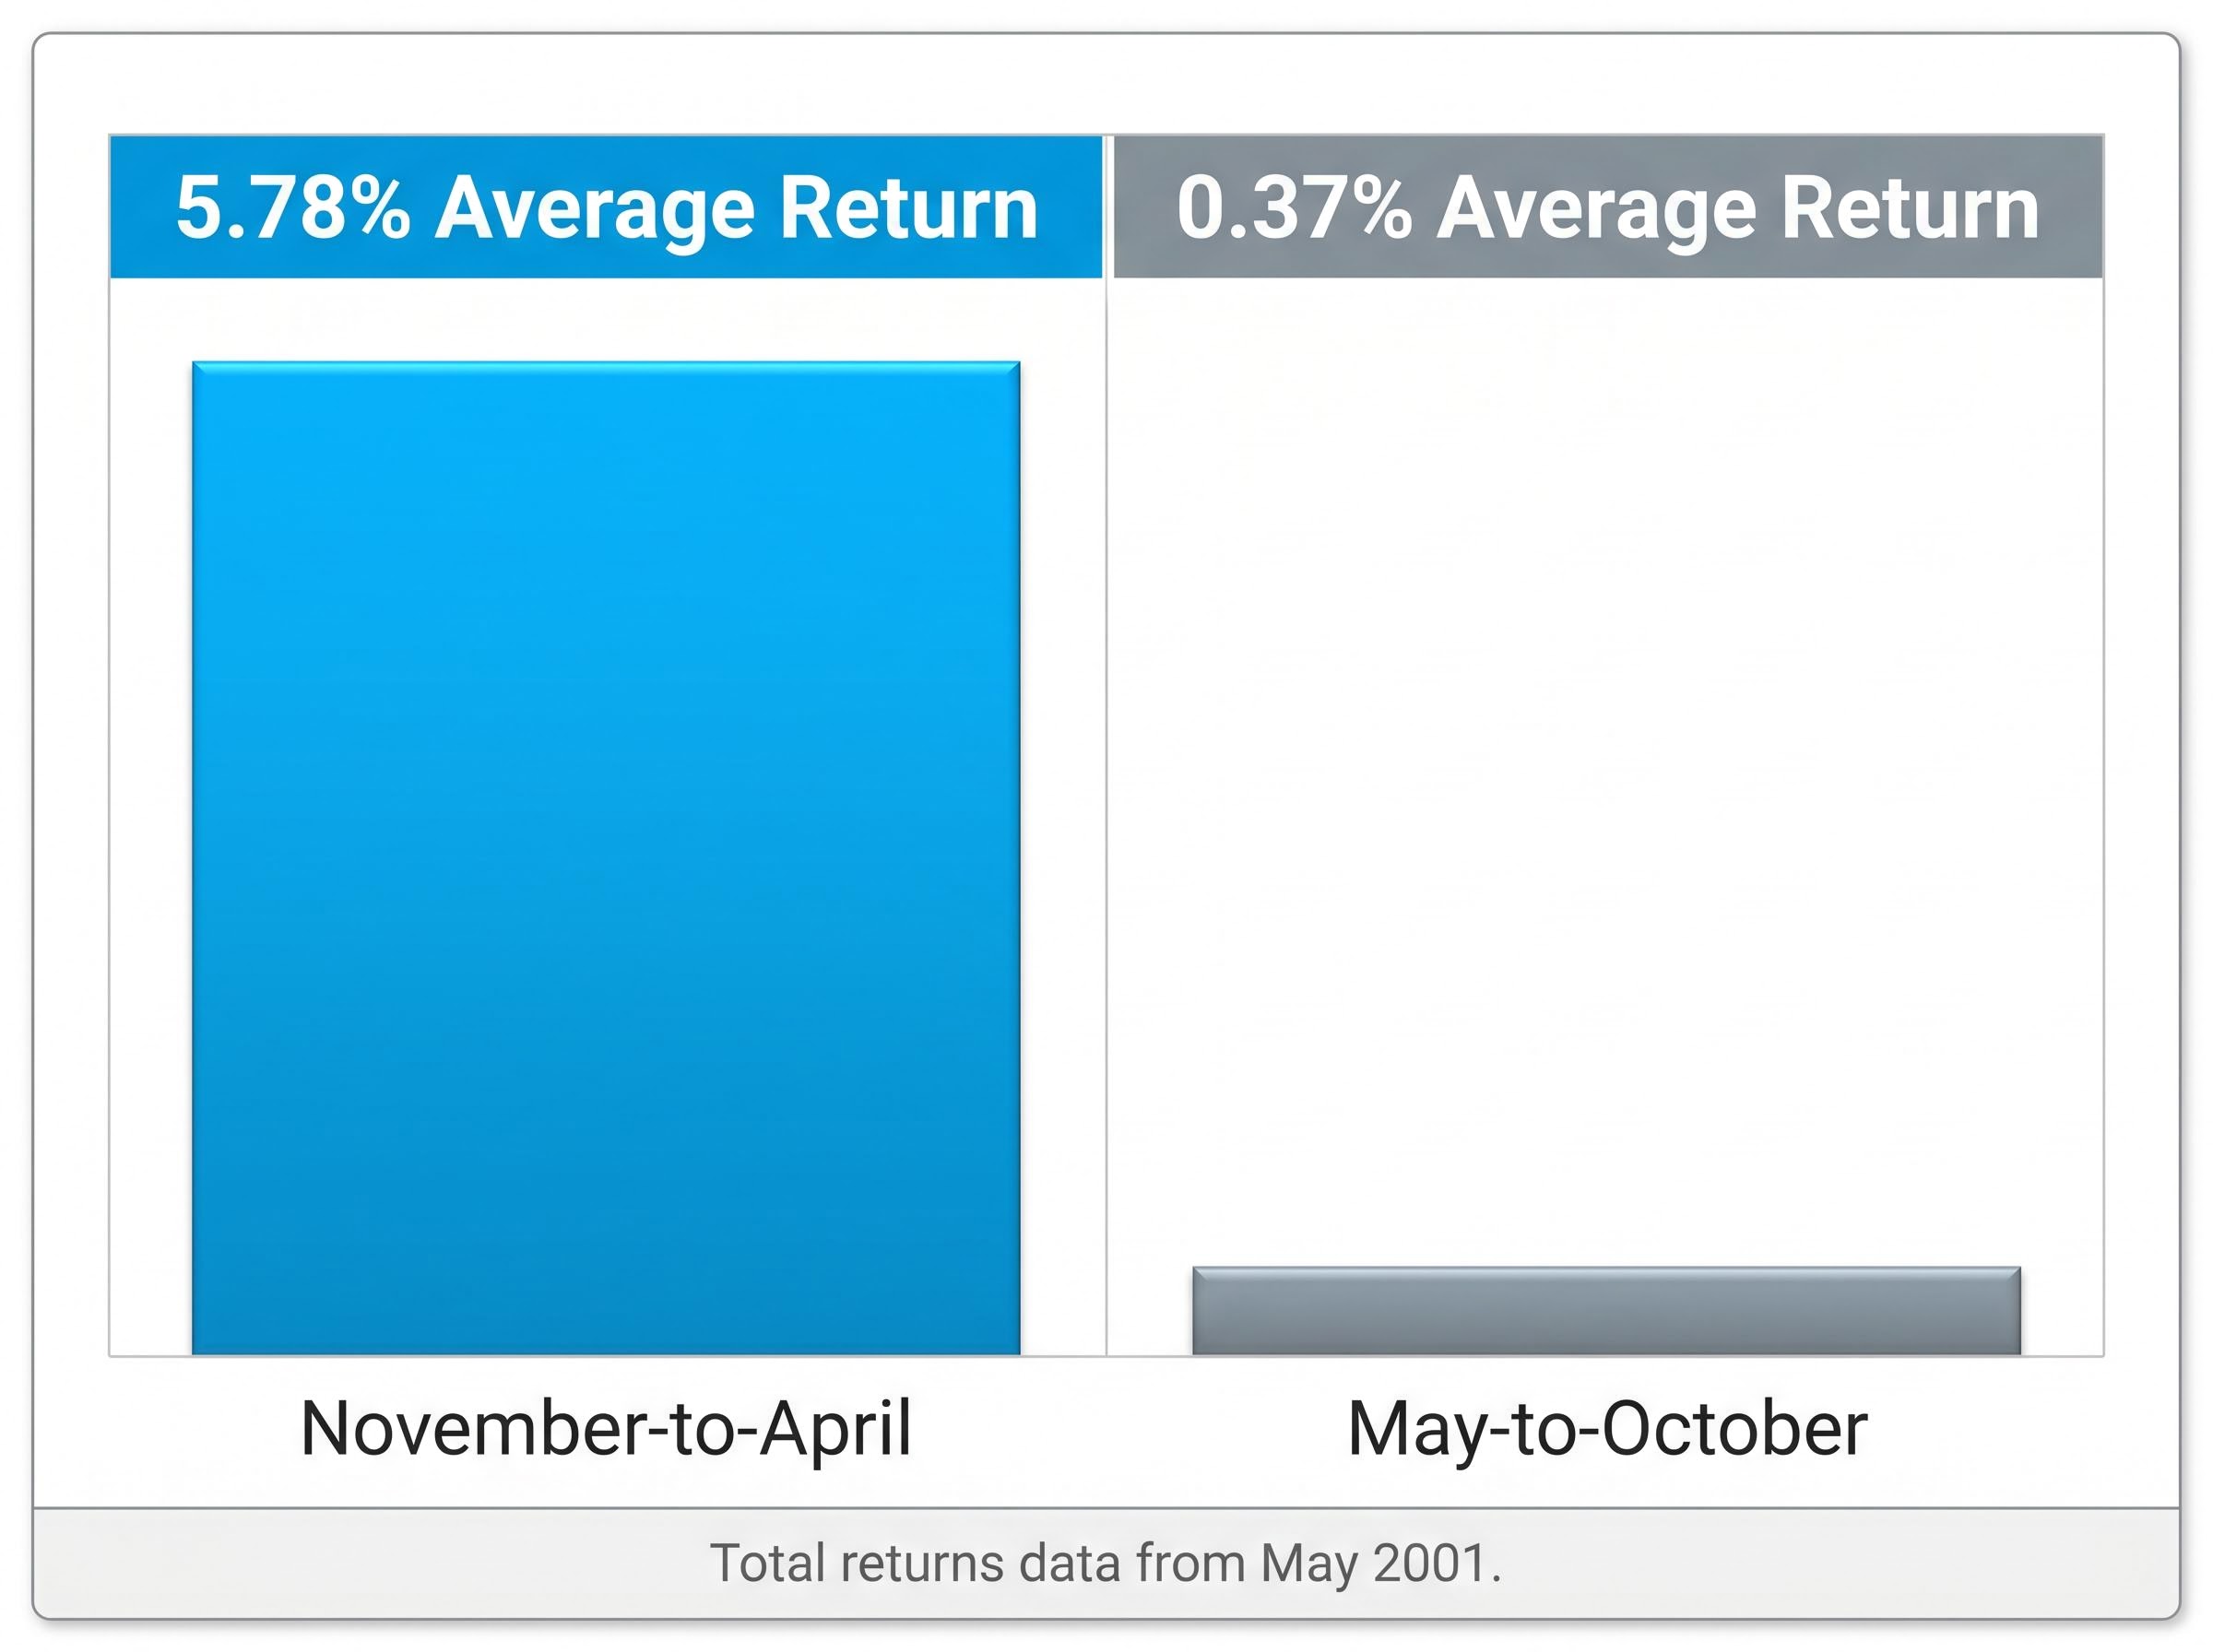
The May-to-October six-month average return is 0.37%, compared with 5.78% for November-to-April. That is the adage’s strongest single data point, and the only one that carries genuine statistical weight.
The 2006-2013 stretch, which included the global financial crisis and its aftermath, weighs heavily on the long-run total returns average. The more recent decade has been kinder to investors who ignored the adage entirely. The pattern is real. It is also far weaker than popular retellings suggest.
A 70% positive hit rate in the most recent decade of Mays is itself an argument against mechanical application. Two of the decade’s three worst Mays (2022, 2023) came during periods of aggressive central bank tightening; two of the best (2020, 2025) came during recoveries. The macro conditions of each year, not the calendar, drove the outcome.
The adage functions as a heuristic, not a reliable trading signal. Its most useful purpose is forcing a question: what are the actual conditions this May, and do they independently justify caution?
Investors who treat the rule as a decision trigger risk either panic-selling in strong Mays or dismissing genuine risk in weak ones. The framework matters more than the calendar.
The March 2026 Consumer Price Index, released on 29 April by the Australian Bureau of Statistics (ABS), came in at 4.6% annual. That is the highest reading since September 2023 and nearly double the top of the RBA’s 2-3% target band.
The distinction between headline and underlying inflation matters here: CPI mechanics and rate transmission work differently depending on whether price pressures originate from domestic demand or supply shocks, and Australia’s current 4.6% headline reading sits well above the 3.3% trimmed mean precisely because fuel and shipping costs are doing most of the work.
The ABS Consumer Price Index release for March 2026, published on 29 April, confirmed annual inflation of 4.6%, a reading that sits nearly double the top of the RBA’s 2-3% target band and represents the highest level recorded since September 2023.
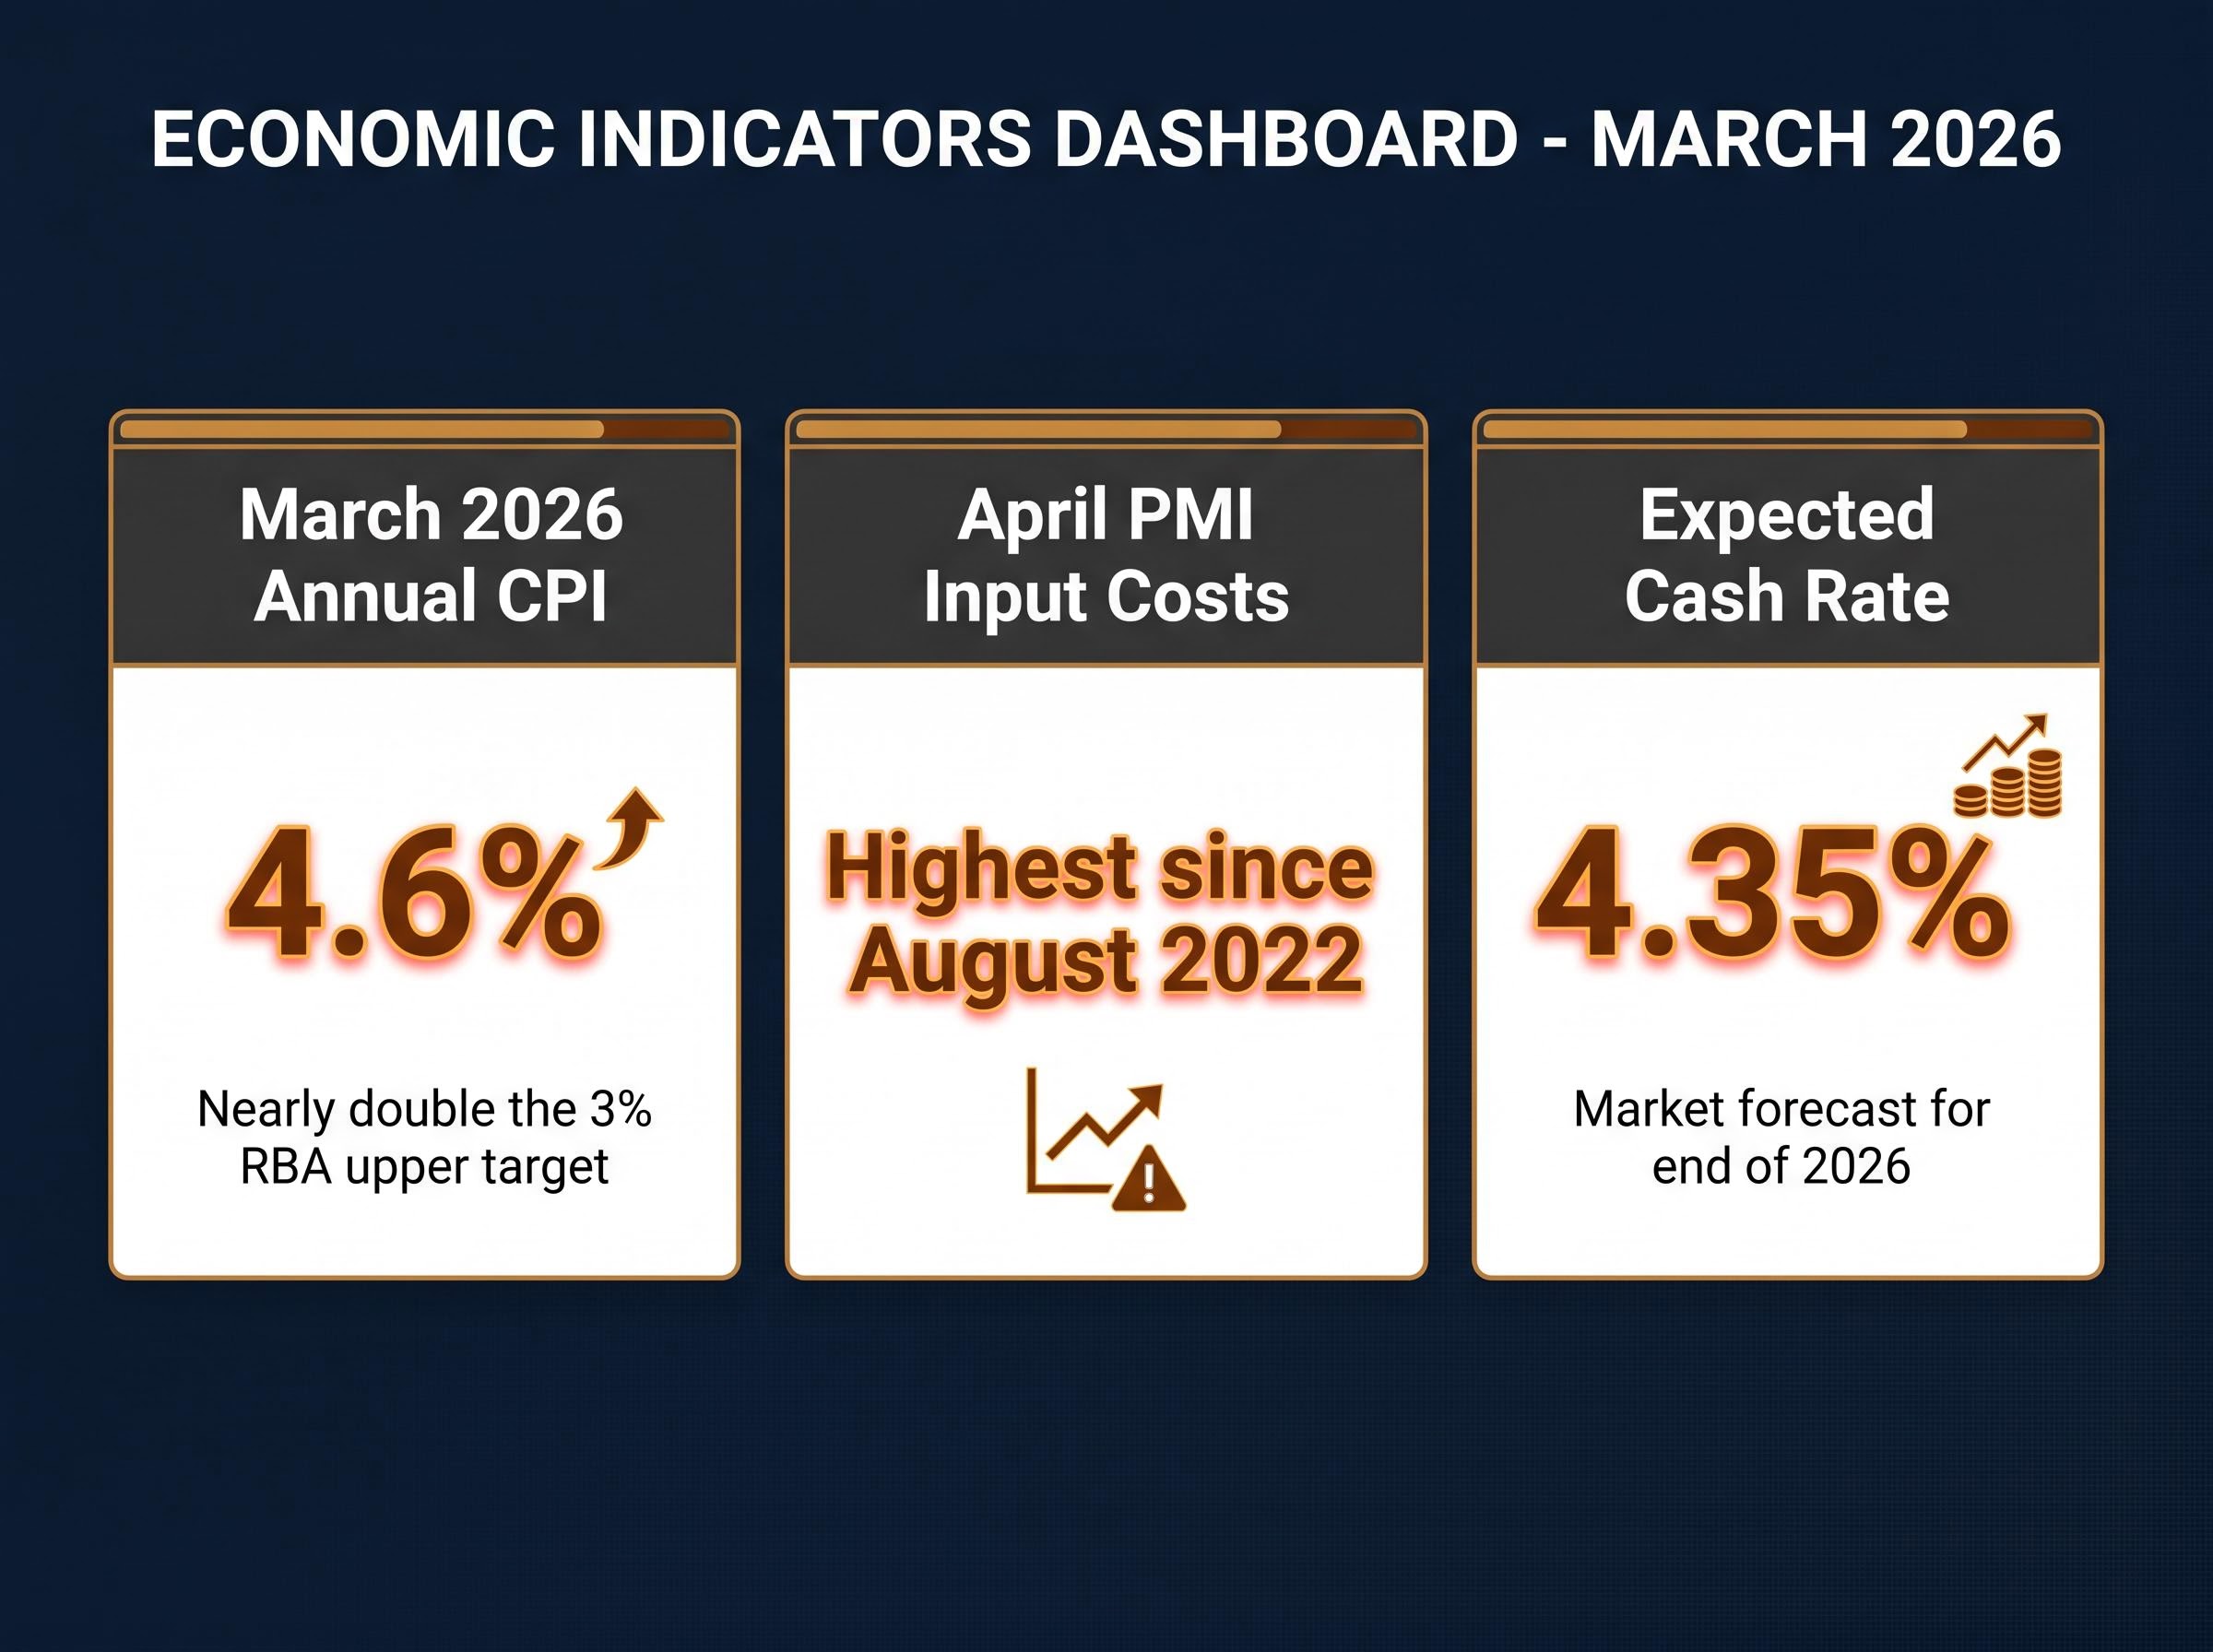
4.6% annual CPI, the highest reading since September 2023 and nearly double the RBA’s upper target of 3%.
Cost pressures are not confined to the headline figure. The April 2026 S&P Global Purchasing Managers’ Index (PMI) showed input costs climbing to their highest level since August 2022, driven by fuel and shipping expenses. Businesses passed those costs to customers, with charge inflation reaching its highest level in three and a half years.
The RBA met on 4-5 May with markets pricing approximately 86% probability of a 25 basis point hike. A move at that level would bring the cash rate to 4.35%, fully reversing the prior year’s rate reductions.
The RBA’s May 2026 rate decision confirmed an increase in the cash rate target to 4.35%, with the Board citing persistent inflationary pressures and a commitment to returning inflation to the 2-3% target band as the primary justifications for the move.
The transmission mechanism from rate hikes to equity valuations is direct: higher discount rates compress the present value of future earnings, particularly for growth stocks and long-duration assets where cash flows sit further in the future. For Australian equity investors, the macro case for caution this May does not depend on the seasonal adage at all. Inflation and rate dynamics alone create a headwind the historical averages never priced.
| Indicator | May 2026 Reading | Prior Benchmark |
|---|---|---|
| March 2026 CPI (annual) | 4.6% | RBA target band top: 3% |
| April PMI input costs | Highest since August 2022 | Prior month (lower) |
| Expected cash rate (post-hike) | 4.35% | Pre-cut-cycle peak: 4.35% |
Abstract macro indicators describe the environment. Earnings downgrades confirm the damage is already inside company income statements.
Cochlear provided the sharpest single illustration. The healthcare company cut its FY26 underlying profit guidance by approximately 30%, and the share price fell approximately 40% in a single session. The speed of that repricing showed how little margin for error the market was granting to companies exposed to cost and geopolitical disruption.
The breadth of the downgrade wave is what makes it significant. This is not a single-industry problem.
| Company | Sector | Guidance Action | Key Driver |
|---|---|---|---|
| Cochlear | Healthcare | ~30% profit guidance cut | Middle East / cost exposure |
| Woolworths | Consumer Staples | EBIT below upper guidance range | Direct Q4 fuel cost exposure |
| Westpac | Financials | Weaker revenues, larger impairment | Treasury margin compression |
| a2 Milk | Consumer Staples | NPAT at or below prior year | Elevated air freight costs |
| Air New Zealand | Industrials | Full-year guidance withdrawn | Operational uncertainty |
Beyond these, NAB increased impairment charges for segments with greatest geopolitical exposure. Endeavour Group reported half-to-date FY26 retail sales growth slowing to 0.7% from 1.3% at the February half-year, with hotels growth moderating to 3.7% from 4.5%. Orora, Worley, Cleanaway, Fletcher Building, EVT, and EBOS all issued reduced or cautious guidance updates.
The pattern across companies is consistent: either guidance has been cut outright, withdrawn entirely, or anchored to the lower end of prior ranges. That signals management caution, not confidence.
Macquarie’s FY26 ASX earnings growth forecast of 10.5% looks constructive at the headline level. The composition tells a different story. Resources (copper, gold, iron ore dynamics) and banking are the leading contributors to that growth. Industrials, consumer businesses, and healthcare face deteriorating conditions.
Sector rotation into commodities has produced a sharp internal divergence: lithium names including Liontown Resources and Pilbara Minerals recorded new 52-week highs in the same week that Consumer Discretionary and Health Care generated the most new annual lows, with lithium carbonate averaging $15,000 per tonne in April on the back of 2.1 million Chinese EV sales in Q1 providing the fundamental basis for that split.
This bifurcation matters for investors who hold sector-tilted portfolios. Headline index optimism may not reflect their actual holdings.
Before interpreting any May outcome against the seasonal average, it helps to know precisely where the market stands.
The confirmed closing levels through the first week of May trace a market caught between recovery and hesitation:
The 30 April close of 8,665.80 marked the lowest point in the sequence. The 1 May session delivered a recovery before the market retreated again on 4 May ahead of the RBA decision.
Year-to-date performance as at 30 April sits at approximately -0.56%, measured from the 31 December 2025 close of 8,714.30. The March-to-April monthly return of approximately +2.17% shows a market that recovered from its 8,262 March low but gave back gains from the 9,021 mid-April peak.
Weakness in US futures, Strait of Hormuz geopolitical tensions supporting oil prices, and the RBA meeting itself form the immediate near-term catalysts. The market is volatile but not directionally broken.
ASX market breadth deterioration tells a more granular story than headline index levels: in the week ending 1 May 2026, 22 constituents hit fresh 52-week lows while the index itself fell just 0.65%, a ratio that historically signals underlying stress not yet visible in price-weighted returns.
The seasonal data and the macro evidence now point in the same direction. That alignment is the exception, not the rule, and it is the reason the adage deserves more weight in 2026 than it typically earns.
The May-to-October six-month average return of 0.37% describes what seasonal headwinds look like in a normal year. This year adds 4.6% CPI, PMI input costs at their highest since August 2022, a potential rate hike to 4.35%, and an earnings downgrade wave that spans healthcare, consumer staples, financials, and industrials. The macro case for caution does not require the calendar to validate it.
For investors assessing positioning, three considerations form a practical framework:
The adage is useful this year not as a trading rule but as a prompt to ask whether underlying conditions independently support caution. In May 2026, they clearly do.
The “Sell in May” pattern carries weak statistical backing as a standalone rule. Its long-run average is modest, its decade-to-decade consistency is poor, and mechanical application would have produced mixed results.
May 2026 is unusual because the macro conditions independently support the caution the adage merely implies. Three pillars underpin that case: an inflation and rate environment that compresses equity valuations, a breadth of earnings downgrades that confirms cost pressures are already inside corporate income statements, and a historically weak May-to-October seasonal window that adds contextual weight.
The question for Australian equity investors is not whether to follow a calendar rule. It is whether the specific conditions of this May warrant a more defensive approach to equity exposure. The inflation data, the RBA’s policy trajectory, and the earnings evidence suggest they do.
Investors may benefit from reviewing their sector weighting in light of the two-speed FY26 earnings story. Resources and banking exposure may offer relative insulation, while consumer, healthcare, and industrial holdings face the most concentrated near-term pressure.
For investors wanting to translate the macro framework into specific portfolio decisions, our dedicated guide to ASX portfolio positioning during inflation covers ASX-listed cash ETFs, quality equity screens, and dollar cost averaging approaches suited to the current tightening cycle, with worked examples across common retail portfolio structures.
This article is for informational purposes only and should not be considered financial advice. Investors should conduct their own research and consult with financial professionals before making investment decisions. Past performance does not guarantee future results. Financial projections are subject to market conditions and various risk factors.
Sell in May refers to the historical pattern where the ASX 200 delivers weaker average returns between May and October compared to the November to April period. Since 1980, the May to October six-month average return has been just 0.37%, compared to 5.78% for the stronger half of the year.
The pattern has weak statistical backing as a standalone rule. The ASX 200's average May return since 1980 is just 0.17%, and while the market has finished May positively in roughly 63% of years, individual year returns have ranged from -3.37% to +4.22% in the past decade alone, making mechanical application unreliable.
May 2026 combines three independent headwinds: annual CPI of 4.6% (the highest since September 2023), an RBA cash rate hike to 4.35%, and a broad earnings downgrade wave spanning Cochlear, Woolworths, Westpac, a2 Milk, Air New Zealand, and others, confirming cost pressures are already inside corporate income statements.
Healthcare, consumer staples, and industrials face the most concentrated near-term pressure based on the breadth of earnings downgrades, while resources and banking offer relative buffers due to their stronger contribution to FY26 ASX earnings growth forecasts.
The seasonal adage should not be used as a trading trigger, but in May 2026 the macro fundamentals independently support heightened caution: investors may benefit from reviewing sector weightings, with resources and banking offering relative insulation compared to consumer, healthcare, and industrial holdings.