Micron Surges 9% After Guiding $6.4 Billion Above Consensus
4 hrs ago
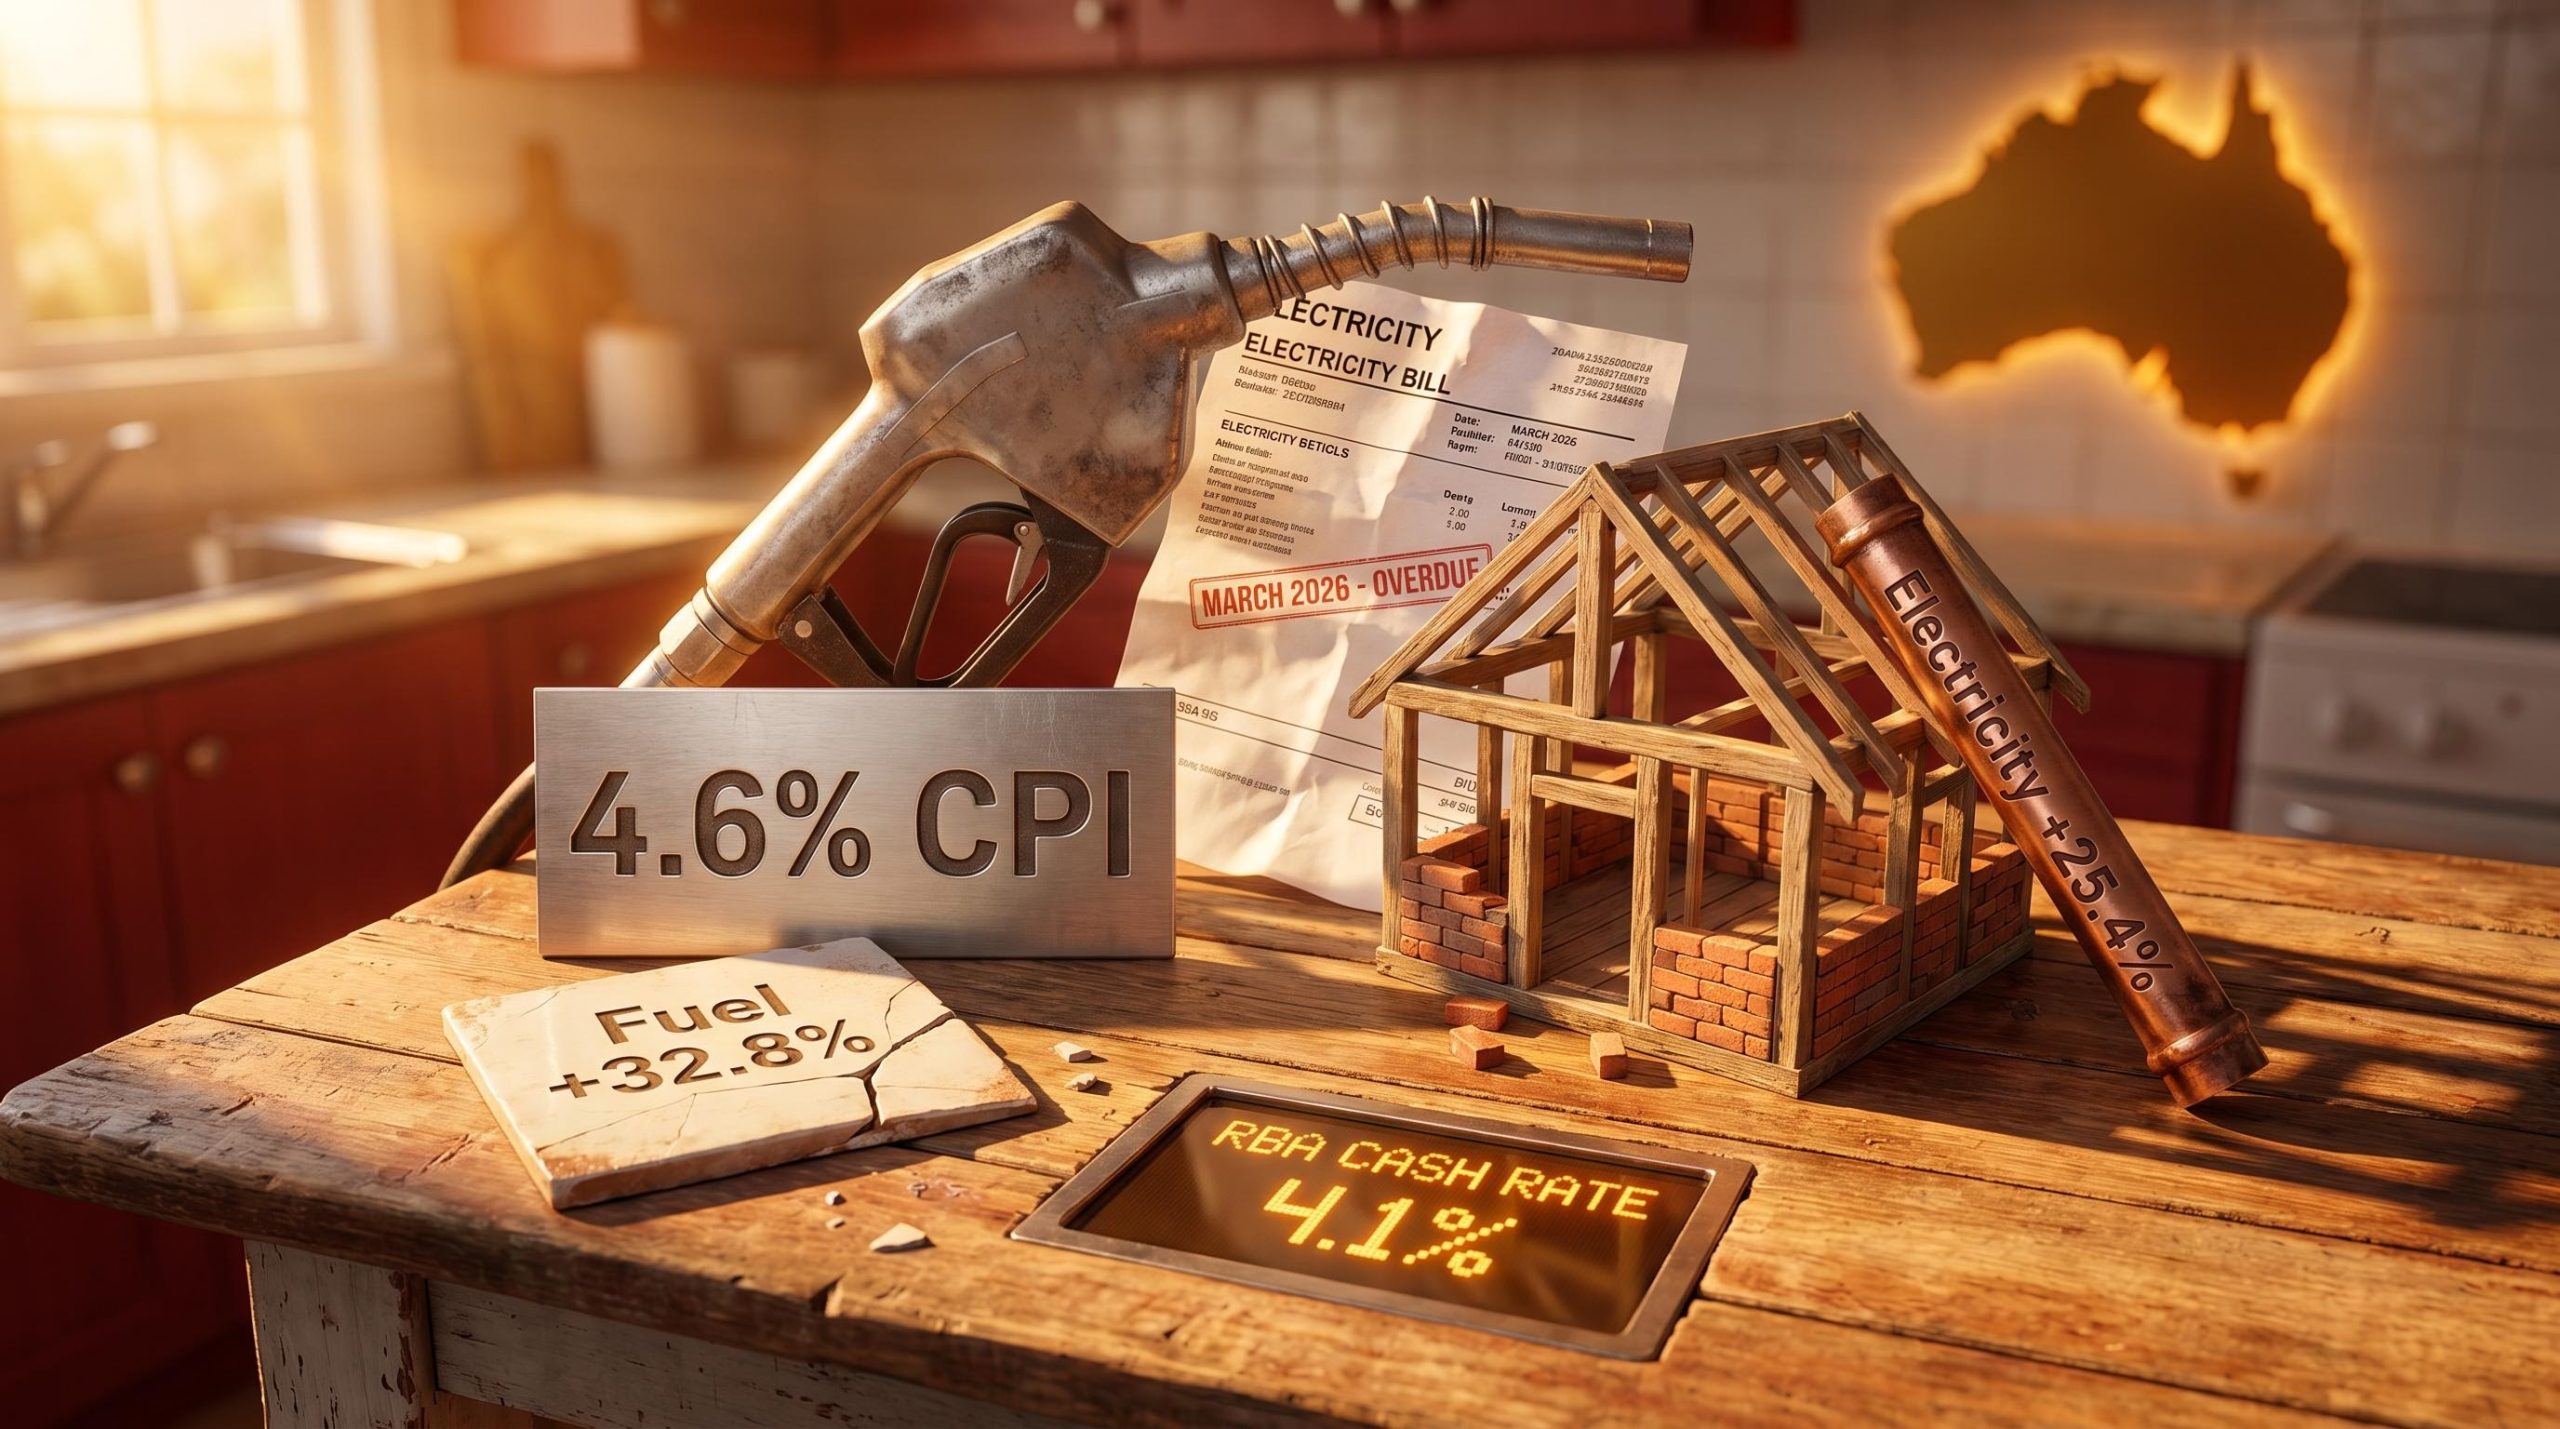
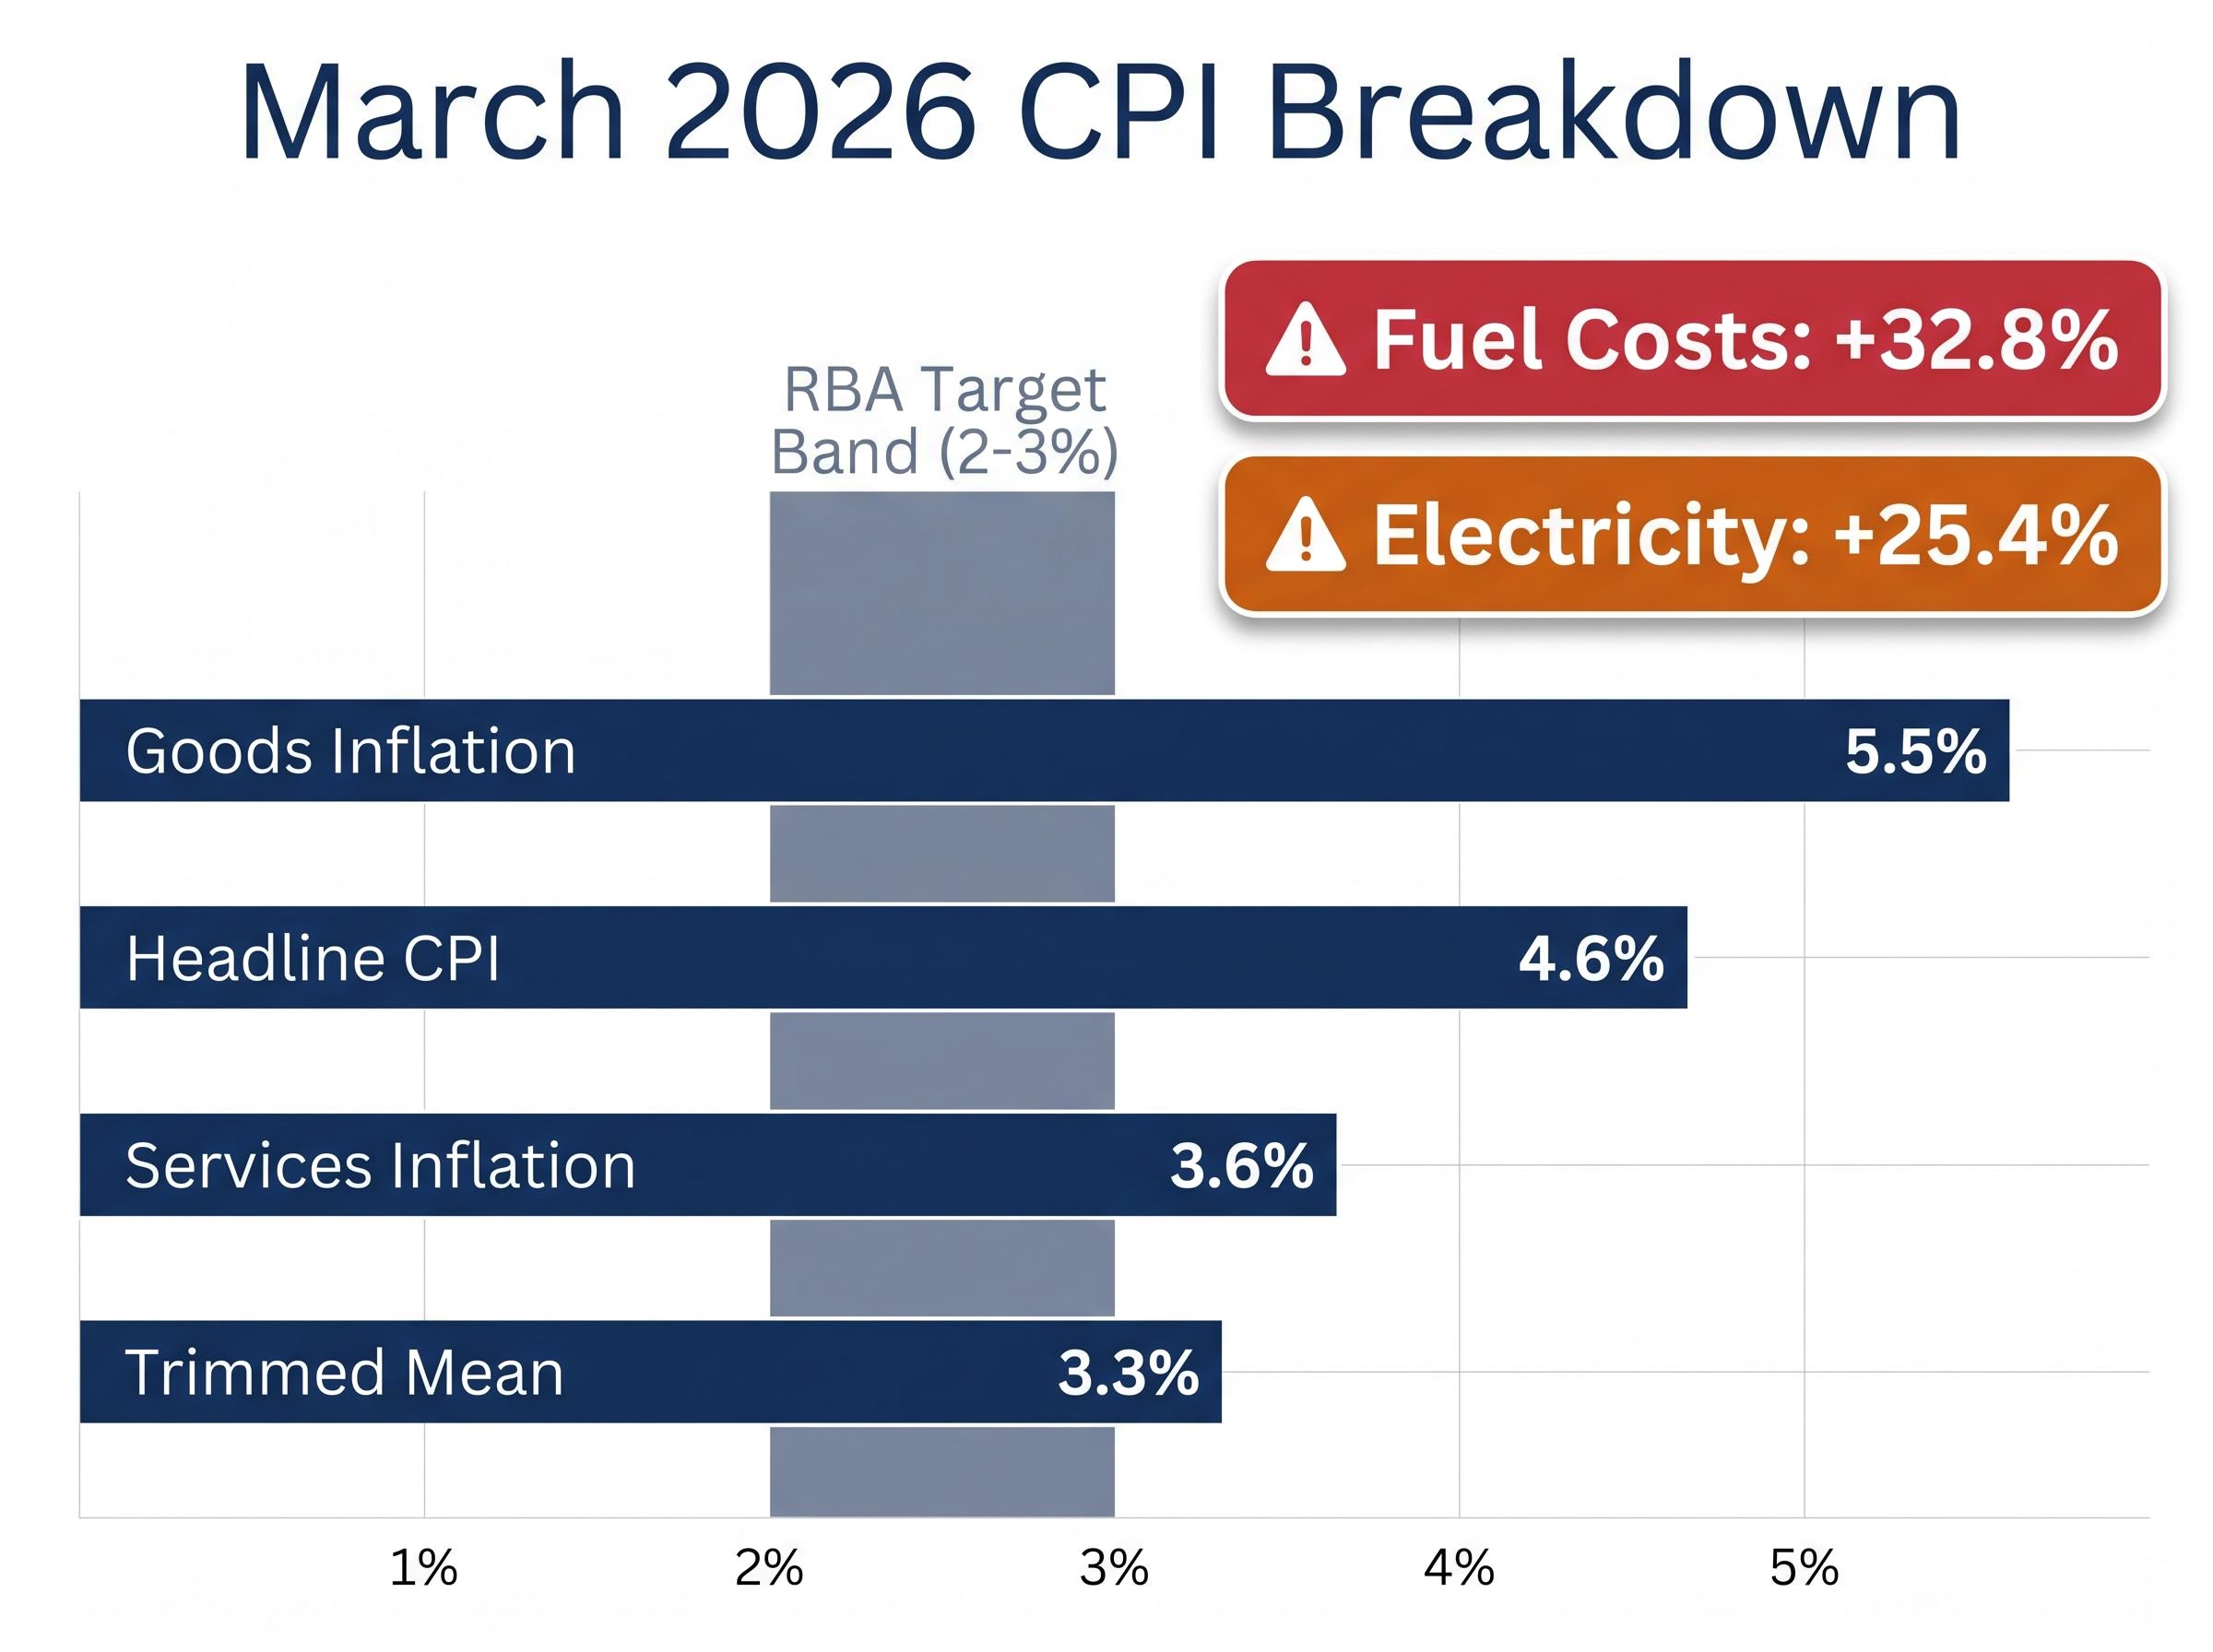
Australia’s headline inflation rate jumped to 4.6% year-on-year in March 2026, the highest reading since September 2023. The number landed hard. But the single figure obscures a far more fractured reality beneath it: fuel costs that spiked 32.8% in a single month, electricity bills sitting 25.4% higher than a year ago, and a housing market where rent growth is easing while construction costs accelerate in the opposite direction. Each of these forces has a distinct cause and a distinct trajectory, which is precisely why a single headline number tells Australian households almost nothing about where the pain is actually concentrated.
What follows is a component-level dissection of the March 2026 monthly Consumer Price Index (CPI) release, published 29 April 2026. It traces what is driving each pressure point, evaluates what the federal fuel excise reduction actually addresses, and maps why shelter inflation could worsen through 2026 even as some measures appear to stabilise.
The 4.6% annual figure is up sharply from 3.7% in February 2026, a full percentage point swing in a single month. That acceleration alone would warrant attention. But the composition of the basket tells a more instructive story than the aggregate.
Goods inflation rose to 5.5%, while services inflation fell to 3.6%. The two halves of the economy are not moving in the same direction. Meanwhile, the trimmed mean, which strips out the most volatile price movements to reveal underlying inflation momentum, held at 3.3% year-on-year, ticking up 0.2% to 0.3% month-on-month. On a quarterly basis, the Q1 2026 trimmed mean came in at 0.8% quarter-on-quarter (an annualised rate of roughly 3.5%), marginally below NAB and consensus forecasts of 0.9%.
The key sub-index figures for March 2026:
The ABS CPI release for March 2026 confirms the headline rate at 4.6% year-on-year alongside a trimmed mean of 3.3%, with the official basket data showing goods inflation at 5.5% and services inflation at 3.6%, the divergence that underpins the fractured picture this analysis traces.
Approximately two-thirds of the CPI basket was rising at an annualised rate above 3% during Q1 2026.
That breadth matters. A reader who watches only the headline will misread the policy signal; the Reserve Bank of Australia (RBA) pays closer attention to the trimmed mean, and at 3.3%, underlying inflation remains well above the 2-3% target band regardless of what happens to fuel prices next month.
Trimmed mean inflation strips out the most volatile price movements in each period, which is precisely why the RBA treats it as a more reliable policy signal than headline CPI; at 3.3% year-on-year, it confirms that persistent price pressure exists well beneath the fuel-driven headline spike.
The 32.8% monthly surge in automotive fuel prices did not arrive from nowhere. It followed a specific chain of causation that began thousands of kilometres from any Australian petrol station.
Brent crude moved from approximately $69 per barrel in 2025 to $110-$120 per barrel by late April 2026.
The March fuel CPI figure captures prices before the federal fuel excise reduction took effect on 1 April 2026. That timing distinction matters: the worst of the pump price shock hit Australian households in a month where the policy response had not yet arrived. World Bank, IEA, and Citi analysts forecast an average Brent crude price of $86 for 2026, though that average includes a range where sustained disruptions could keep prices near $110 for extended periods.
The federal government’s response was direct. Effective 1 April 2026, the fuel excise was halved from 52.6 cents per litre to 20.6 cents per litre, a measure scheduled to run until 30 June 2026. The estimated retail impact is a reduction of approximately 26.3 cents per litre nationally, with some states reaching 32 cents per litre once GST revenue adjustments are included.
By mid-April 2026, average unleaded petrol prices in major cities had fallen to approximately $1.85 per litre.
| Measure | Before 1 April | After 1 April | Expiry Date |
|---|---|---|---|
| Fuel excise rate | 52.6 cents/litre | 20.6 cents/litre | 30 June 2026 |
| Estimated retail saving | N/A | ~26.3 cents/litre (up to 32 cents in some states) | 30 June 2026 |
| Average city pump price (unleaded) | ~$2.11/litre | ~$1.85/litre | 30 June 2026 |
The relief is real. For a household consuming 40 litres per week, it amounts to roughly $10-$13 per fill. But the measure’s reach has clear boundaries.
The excise reduction expires on 30 June 2026. Unless the government announces an extension, the full rate of 52.6 cents per litre is scheduled to return on 1 July. Any Brent crude rise above current levels of $110-$120 per barrel would erode the retail saving before expiry, potentially offsetting the benefit entirely.
World Bank and IEA forecasts project an average Brent price of $86 for the full year, but that average assumes some resolution to the Middle East disruption. If supply constraints persist through Q2 2026, the $110 ceiling in those forecasts becomes a floor. Households planning budgets around the excise cut need to treat the saving as temporary and contingent, not locked in.
Electricity prices were 25.4% higher in March 2026 than twelve months prior.
That figure looks like a shock. It is not. It is arithmetic.
The federal Energy Bill Relief Fund expired on 31 December 2025 and was not extended into 2026. That single policy decision removed rebates estimated at up to $300 annually for some households. When the rebate disappeared in January, electricity bills stepped up immediately, creating the elevated year-on-year comparison that now shows in the data.
Month-on-month, electricity prices were flat in March 2026, recording a 0% change. The annual figure reflects the January step-change, not fresh acceleration. This distinction matters for reading the trajectory: without a further price rise, the 25.4% annual figure will persist through mid-2026 purely due to the base effect before it begins to normalise.
Some partial offsets remain available to households:
Without additional federal relief, Q2 2026 electricity prices are projected to remain 5-10% higher year-on-year.
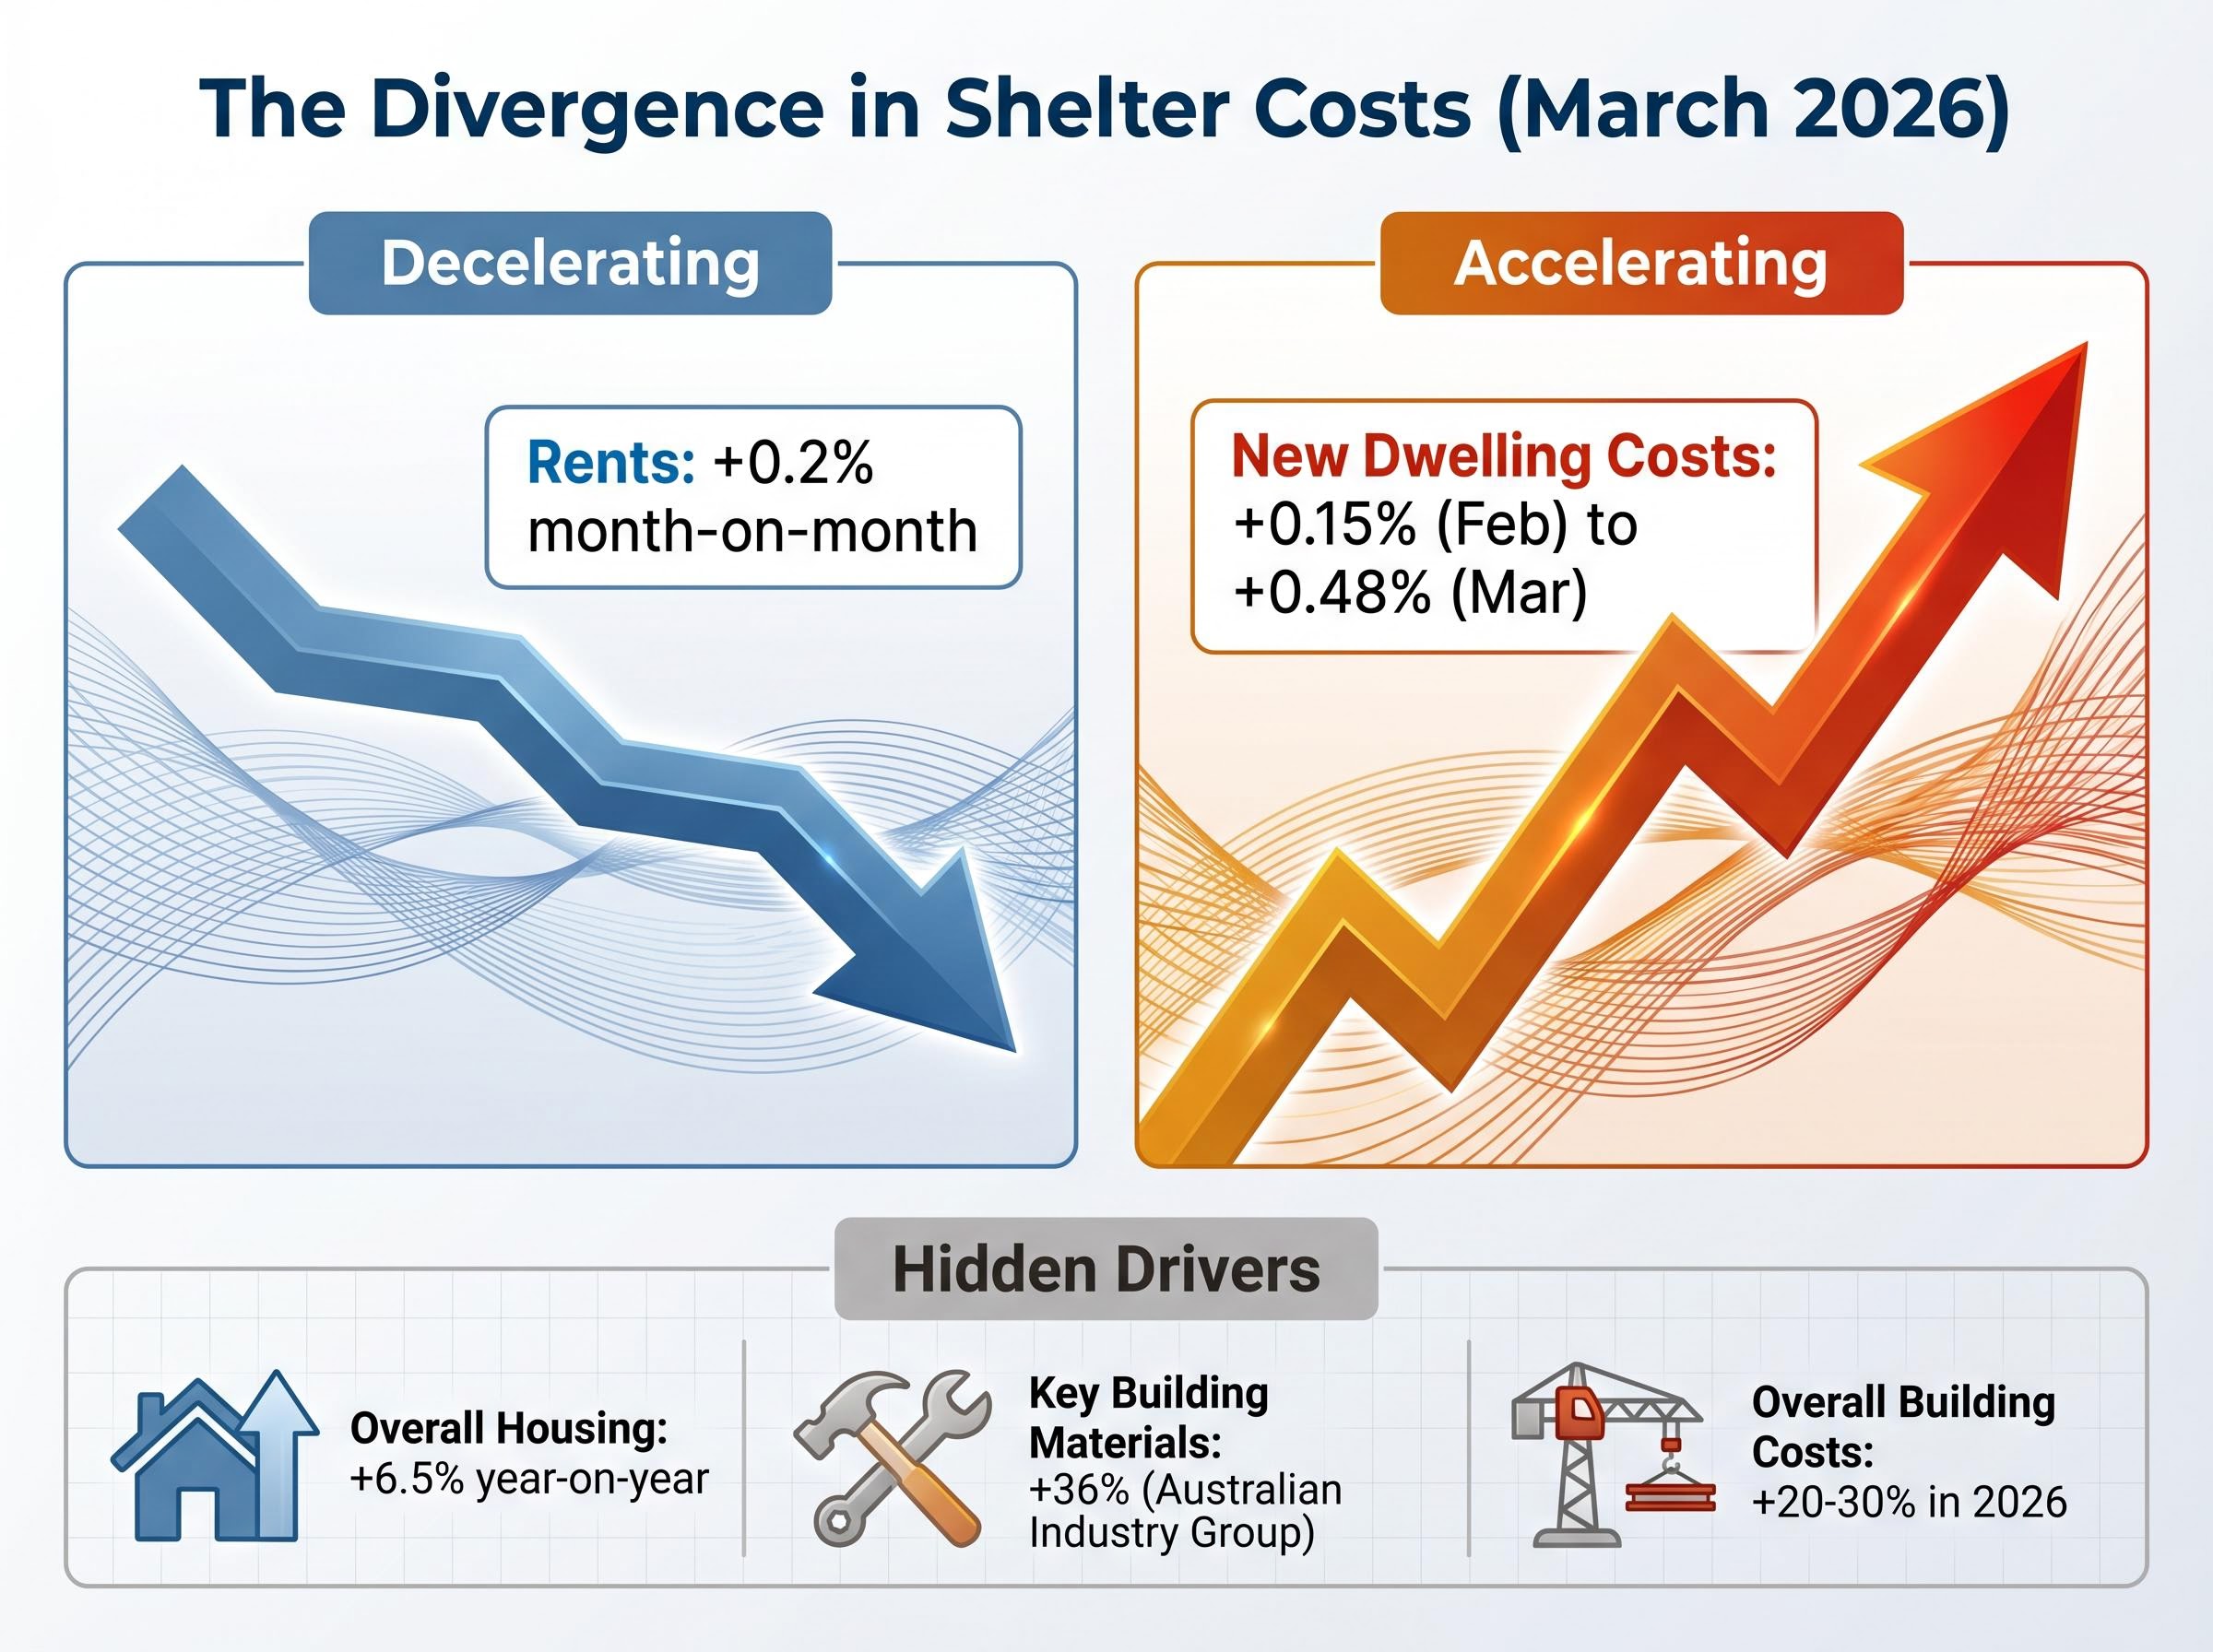
Rent growth is easing. New dwelling costs are not. That divergence is the most underappreciated risk in the current inflation picture.
Rents rose just 0.2% month-on-month in March 2026, a clear deceleration from recent months. On its own, that figure suggests shelter inflation is cooling. But new dwelling purchase costs accelerated to 0.48% month-on-month in March, more than triple the 0.15% recorded in February. Housing overall remains 6.5% higher year-on-year.
| Shelter Component | February 2026 (mom) | March 2026 (mom) | Direction of Travel |
|---|---|---|---|
| Rents | Higher than 0.2% | 0.2% | Decelerating |
| New dwelling purchase costs | 0.15% | 0.48% | Accelerating |
The apparent contradiction resolves once the supply chain is traced back to its inputs.
Construction costs are being driven by the same global oil price shock that pushed fuel to the top of the CPI. PVC pipes, insulation, sealants, and other petrochemical-derived materials are direct oil derivatives. Diesel fuel powers heavy machinery on building sites. Transport costs for materials move with crude prices.
According to the Australian Industry Group, key building materials have seen a 36% price increase, with overall building costs rising 20-30% in 2026. Analysis from The Good Builder describes the escalation as echoing the cost spikes experienced during the COVID-era supply chain disruptions.
NAB has explicitly identified new dwelling construction costs as a primary channel through which the oil price shock will propagate into Q2 and Q3 2026. For prospective buyers and existing homeowners alike, the signal is clear: shelter inflation will not ease uniformly. Rental supply dynamics and construction cost pressures are independent forces on different trajectories.
The RBA enters this inflation cycle from an unfavourable starting position. The cash rate sits at 4.1%, having been raised 25 basis points in March 2026. Core inflation was already running at approximately 3.5% before the oil price shock began feeding through to consumer prices.
Markets are pricing an 86% probability of a further rise to 4.35% at the May 2026 meeting, with at least two hikes anticipated by mid-2026.
Stagflation risk has re-entered the conversation among Australian policymakers, with RBA Deputy Governor Hauser flagging the scenario in which inflation remains elevated while growth slows, a combination that severely limits the central bank’s policy options compared to a standard demand-driven inflation cycle.
The rate outlook breaks down across three scenarios:
Cumulative inflation pressures are estimated to add $1,500-$2,000 annually to average household expenses.
For mortgage holders, each 25 basis point increase translates directly to higher monthly repayments. For renters, construction cost pressures feed into the supply pipeline that determines future housing availability. The timeline for relief, based on the RBA’s own projections, extends well into 2027.
The three dominant inflation forces of early 2026, fuel, electricity, and shelter, appear distinct on the surface. They are not. All three share a common transmission mechanism: global oil prices. Fuel costs are the direct expression. Electricity prices are shaped by the policy gap left when the relief fund expired. Construction costs are fed by oil-derived materials and diesel-powered supply chains.
The single most consequential variable for Australia’s 2026 inflation outlook is the persistence of the Middle East supply disruption and whether Brent crude stabilises near current levels or escalates further.
ASX sector exposure to the oil shock is highly uneven: energy producers such as Woodside and Santos benefit directly from higher crude, while transport, consumer staples, and financials each face distinct cost and margin headwinds that the aggregate index return conceals.
Three conditions would materially shift the trajectory:
NAB has flagged the risk of “broad and rapid secondary-round price transmission” across Q2 and Q3 2026. With headline inflation at 4.6%, the RBA’s 2-3% target band sits a long way below. The fuel excise cut expires on 30 June 2026. No replacement energy rebate has been announced. And the construction cost channel is only beginning to show in the data.
Australian households and the RBA alike face the same constraint: the variable that matters most, the price of oil, is determined in a conflict zone neither can influence.
For investors wanting to translate the inflation and rate outlook into concrete portfolio decisions, our comprehensive walkthrough of ASX portfolio positioning during inflation covers how cash ETFs, quality equity screens, and dollar cost averaging interact across the current tightening cycle, with worked examples of how reactive selling on CPI headlines has historically damaged long-term returns.
This article is for informational purposes only and should not be considered financial advice. Investors should conduct their own research and consult with financial professionals before making investment decisions. Financial projections referenced in this article are subject to market conditions and various risk factors. Forward-looking statements regarding interest rates, oil prices, and inflation trajectories are speculative and subject to change based on geopolitical developments and policy decisions.
Australia's headline inflation rate rose to 4.6% year-on-year in March 2026, the highest reading since September 2023, driven primarily by a 32.8% monthly surge in fuel prices and a 25.4% annual rise in electricity costs.
Trimmed mean inflation strips out the most volatile price movements in each period to reveal underlying inflation momentum; the RBA uses it as a more reliable policy signal than headline CPI, and in March 2026 it sat at 3.3% year-on-year, well above the 2-3% target band.
The federal government halved the fuel excise from 52.6 cents per litre to 20.6 cents per litre from 1 April 2026, reducing average pump prices to around $1.85 per litre and saving a typical household roughly $10-$13 per fill, though the measure expires on 30 June 2026.
Electricity prices were 25.4% higher in March 2026 than a year earlier primarily because the federal Energy Bill Relief Fund expired on 31 December 2025 and was not renewed, removing rebates worth up to $300 annually for some households and creating a sharp step-up in bills from January 2026.
Markets are pricing an 86% probability of a further 25 basis point rate rise at the May 2026 RBA meeting, which would push the cash rate to 4.35%, with at least two hikes anticipated by mid-2026 as underlying inflation remains well above the central bank's 2-3% target band.