How Australia’s 2026 Capital Gains Tax Changes Affect Investors
16 mins ago

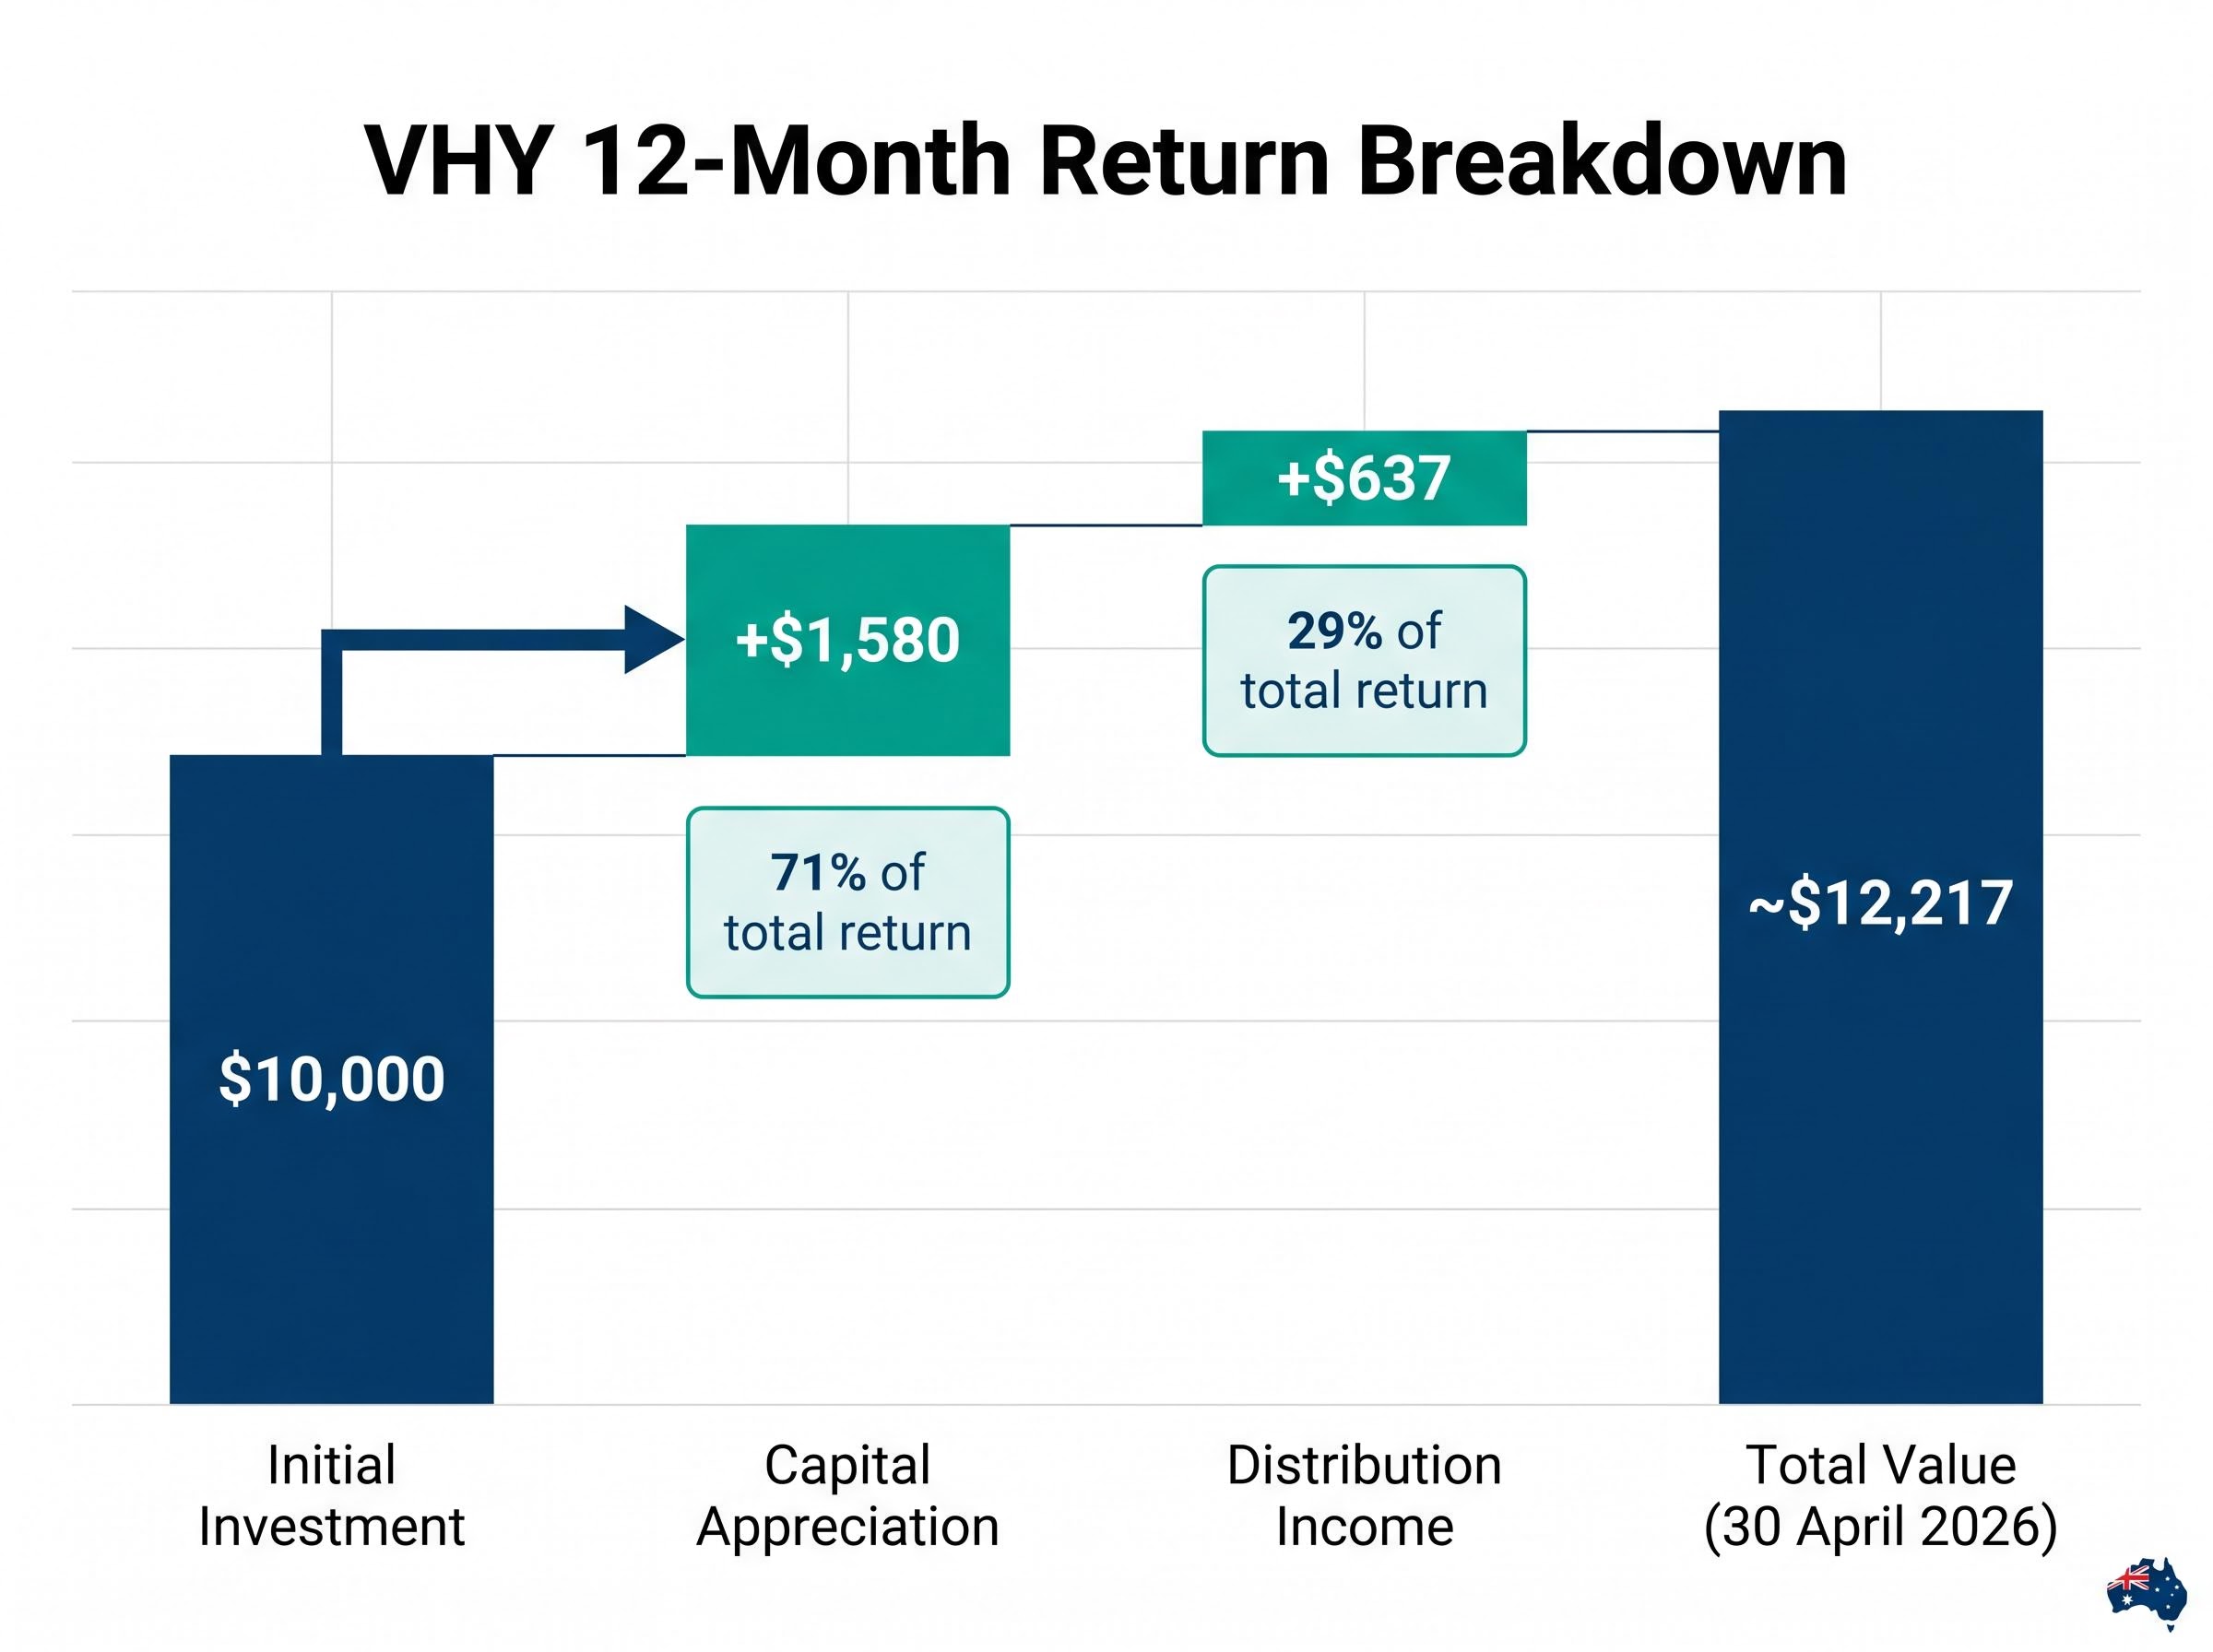
A $10,000 investment in the Vanguard Australian Shares High Yield ETF one year ago is now worth approximately $12,217. The figure did not come from a single outsized holding or a fortunate entry point. It came from a structural tilt toward Australian financials and resources that happened to align with where ASX markets ran hardest over the past 12 months. With income-focused strategies outperforming growth counterparts across the board, VHY has become a reference point for retail investors re-evaluating how dividend-paying ETFs fit into a portfolio. A total return in the 22%-plus range for an income ETF warrants serious examination of what drove the result, and whether the conditions that produced it still exist.
This analysis unpacks exactly how that $10,000 grew, separating capital gains from distribution income, identifying the holdings that did the heavy lifting, and providing a clear-eyed framework for evaluating VHY going forward.
The arithmetic starts with the entry price. One year ago, VHY traded at approximately $71.63 per unit. A $10,000 investment purchased roughly 139.6 units.
As of 30 April 2026, the unit price sat at $82.88. Those 139.6 units now carry a capital value of approximately $11,570, representing the price appreciation component alone.
Distribution income added the second layer. VHY made four quarterly payments over the trailing 12 months, each contributing to a cumulative income return:
On 139.6 units, that totals approximately $637 in distribution income.
Combined capital appreciation and distributions bring the total portfolio value to approximately $12,217, equating to just over 22% total return. Broader reported 12-month total returns range from 23.31% (as of 31 March 2026) to 25.57%-27.9% from other data sources, placing this 22% figure as a conservative baseline.
| Component | Value |
|---|---|
| Entry Price (per unit) | $71.63 |
| Units Purchased | 139.6 |
| Capital Value (30 April 2026) | ~$11,580 |
| Distribution Income | ~$637 |
| Total Value | ~$12,217 |
Distributions contributed roughly $637 of a $2,217 total gain, or about 29% of the total return. The remaining 71% came from capital appreciation. That ratio matters: it clarifies how much of VHY’s appeal over this period was genuinely income-driven versus driven by unit price gains.
Income ETFs generate returns through two distinct channels, and conflating them leads to poor decision-making. VHY’s own numbers over the past year provide a useful live example.
Unit price appreciation reflects the market’s collective revaluation of the ETF’s underlying holdings. When Commonwealth Bank of Australia shares rise 44% in a year and represent 9.79% of VHY’s portfolio, that gain flows directly into VHY’s unit price. The investor does not need to do anything to capture it; the value is embedded in each unit held.
Distributions are periodic cash payments derived from dividends received on the ETF’s underlying shares, passed through to unitholders. The process follows a specific sequence:
ASX ETF distribution mechanics, including how DRP prices are calculated relative to NAV and why the same quarterly window saw payouts from Vanguard (VAS, VHY), Betashares (A200, DHHF), and iShares (IHD and 14 others) on 20-21 April 2026, follow a consistent ex-date, record date, and payment date sequence that applies across all major fund families.
VHY’s projected annual distribution yield sits at approximately 5.51%, based on recent distribution payments, providing a forward-looking income baseline distinct from the capital appreciation that dominated returns this year.
Franking credits enhance the after-tax value of these distributions for Australian resident investors. Recent franking levels have been substantial: 88.60% for the March 2026 quarter, 72.17% for January 2026, and 87.56% for October 2025. For investors accessing VHY through a superannuation fund in pension phase, where the marginal tax rate is zero, franking credit refunds represent a material addition to after-tax income.
Academic research on Australian franking credit valuation confirms that resident shareholders, particularly those in tax-exempt structures such as superannuation pension phase accounts, capture a material proportion of the implied value embedded in franked dividends, reinforcing why VHY’s consistently high franking ratios represent a structurally significant component of after-tax income.
A common misconception holds that reinvesting distributions is the only way to compound returns inside an ETF structure. In practice, the unit price itself compounds as underlying holdings grow earnings and are revalued by the market. Distributions and capital appreciation are parallel return streams, and investors can choose to take distributions as cash income without forfeiting the compounding embedded in unit price growth.
VHY’s management expense ratio (MER) of 0.25% provides context: for every $10,000 invested, the annual cost is $25, against a projected income stream of approximately $551 at the current yield.
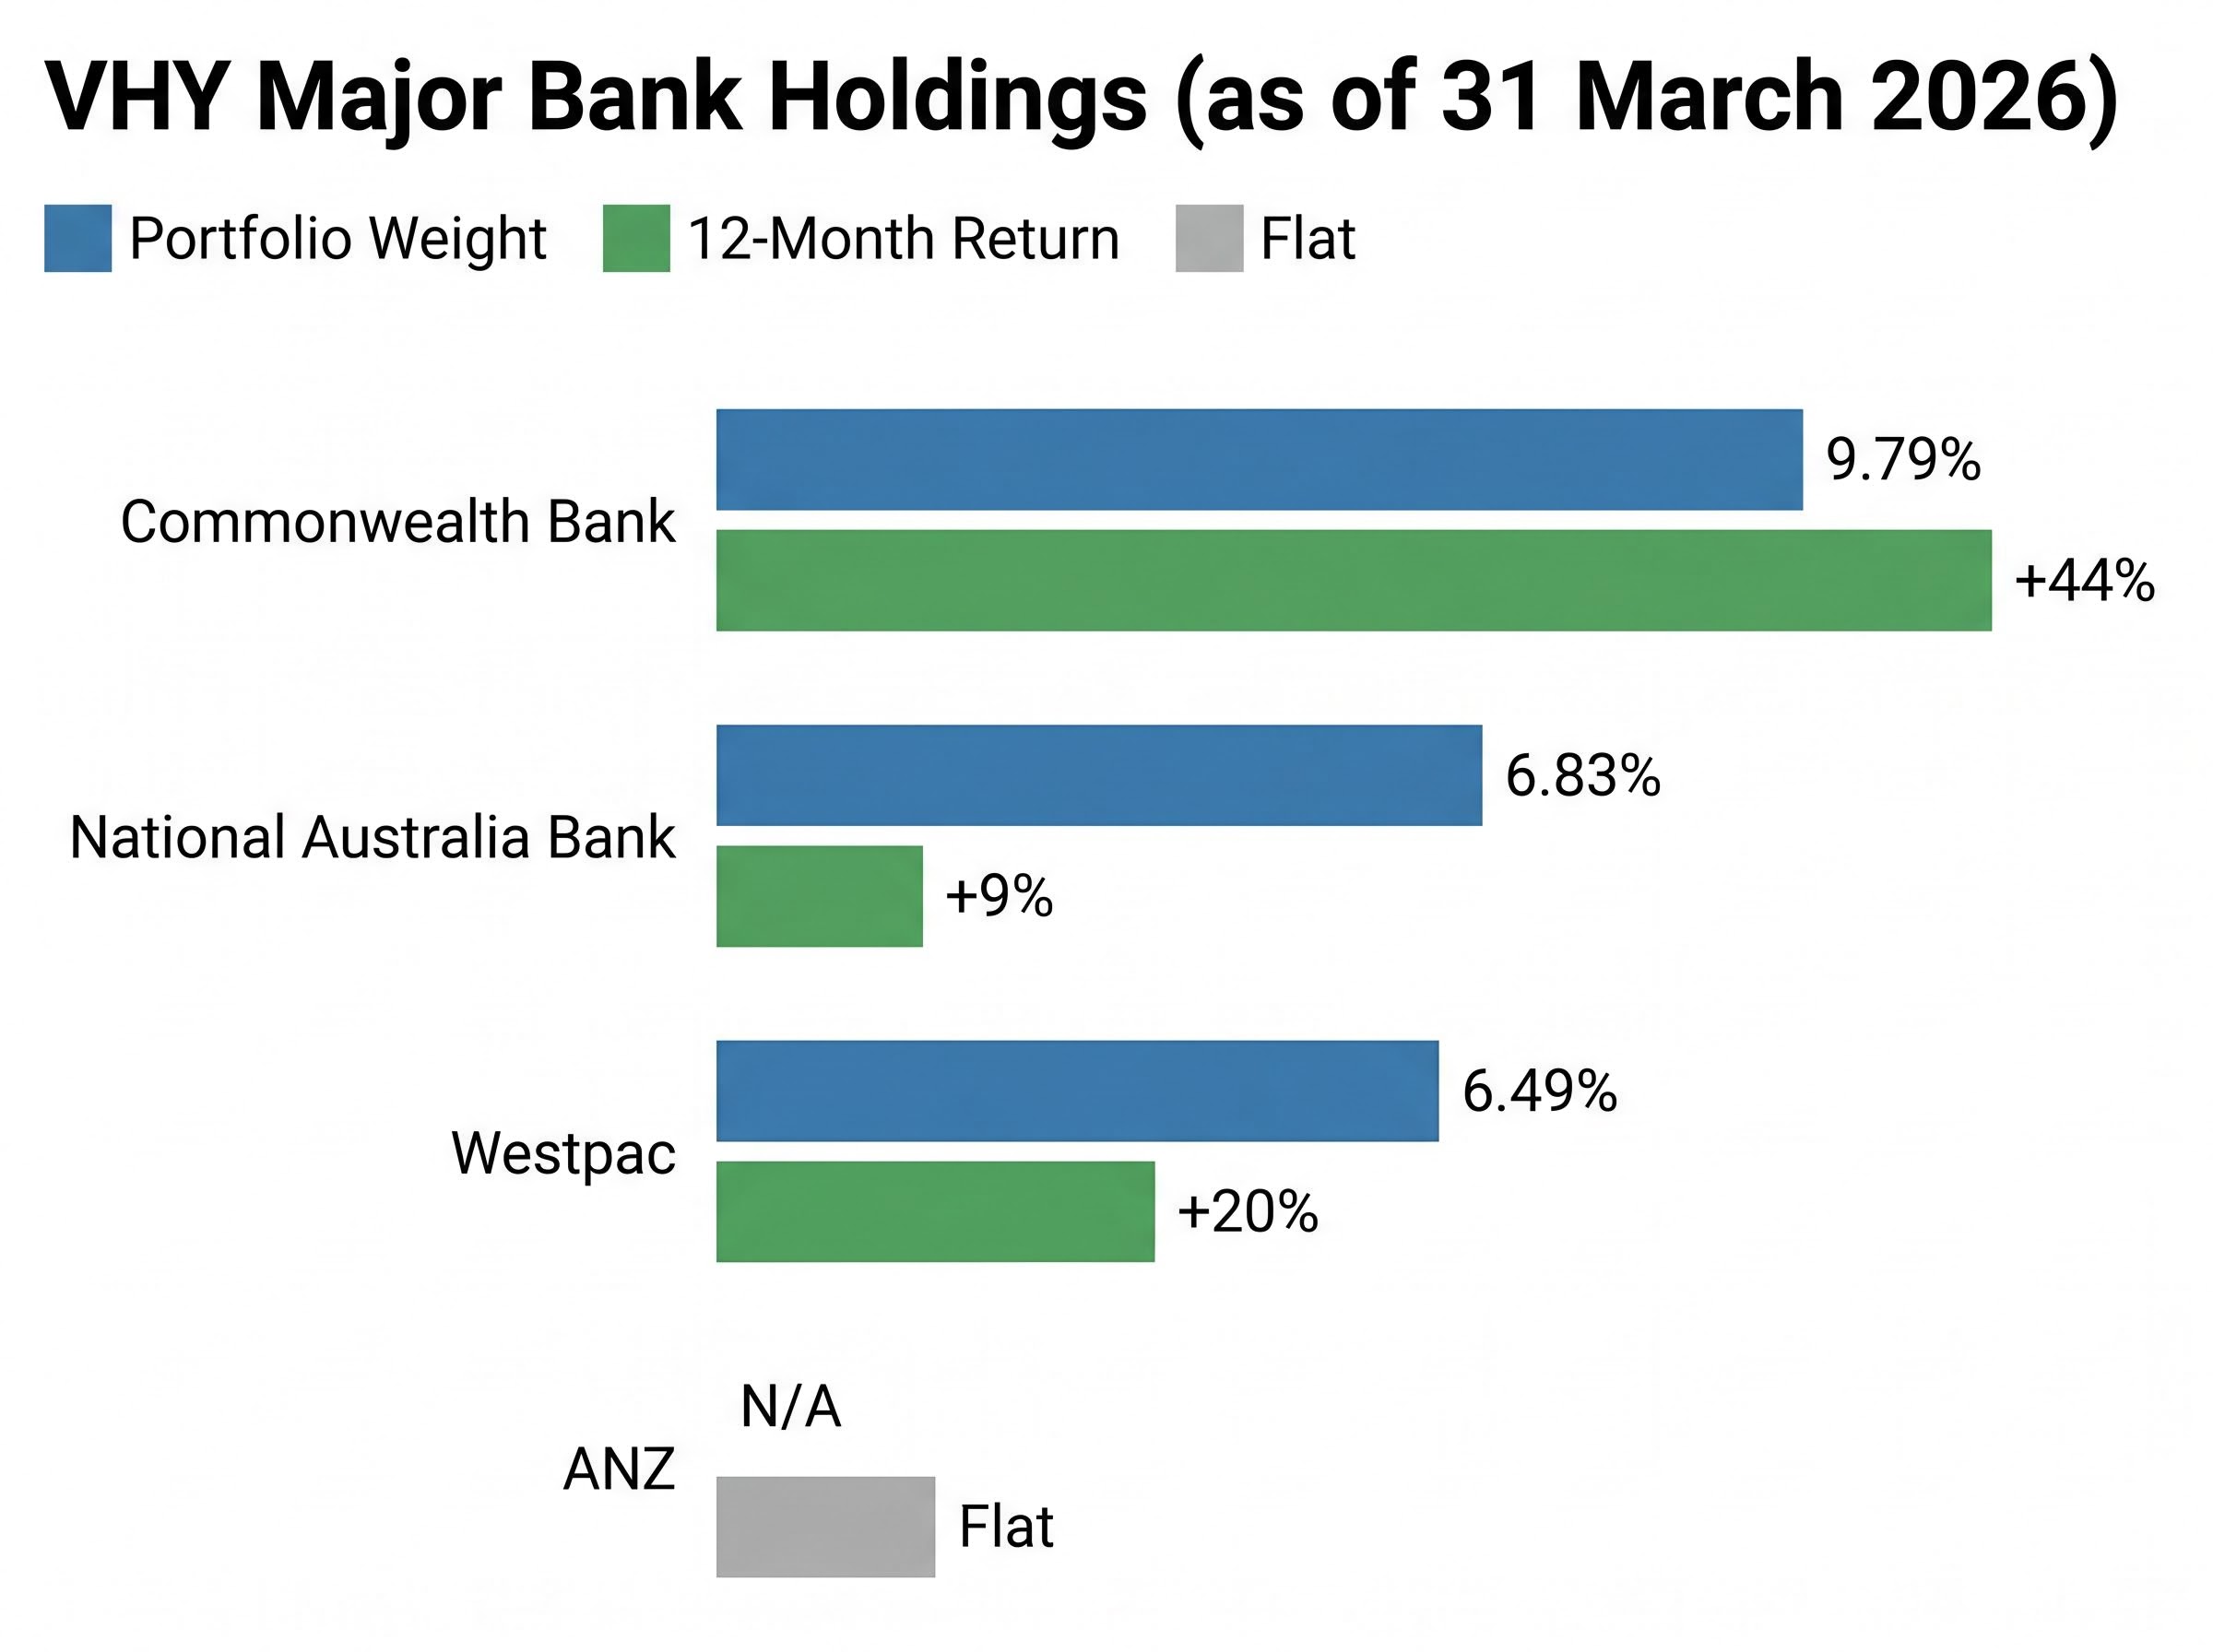
The fund-level return obscures a sharply uneven picture at the constituent level. VHY’s top five holdings as of 31 March 2026 accounted for over 40% of the portfolio, and their individual performances diverged widely.
| Holding | Weight | 12-Month Return |
|---|---|---|
| BHP Group | 10.26% | Not independently verified |
| Commonwealth Bank | 9.79% | +44% |
| National Australia Bank | 6.83% | +9% |
| Woodside Energy | 6.75% | Not independently verified |
| Westpac | 6.49% | +20% |
CBA’s 44% return at a 9.79% weighting was the single largest contributor to VHY’s capital appreciation. Westpac added further support at +20%, while NAB delivered a modest +9%. ANZ, although outside the top five by weight, was flat over the period, illustrating the divergence even within the big four.
CBA’s total return over the two years to April 2026 illustrates exactly this compounding dynamic: a 52.5% price gain was extended to an estimated 72% once fully franked dividends were reinvested, with pension-phase superannuation investors receiving the franking credit component as a direct ATO cash refund.
Two sector themes explain the broader pattern:
The concentration that produced outperformance is the same concentration that can work in reverse. If CBA had delivered a flat year alongside ANZ, VHY’s total return profile would look materially different.
The iShares S&P/ASX Dividend Opportunities ETF (IHD) is the most commonly cited alternative for Australian income investors weighing a high-yield ASX ETF allocation. The differences between the two are real but narrow.
| Metric | VHY | IHD |
|---|---|---|
| AUM | ~$7.00B | ~$376.66M |
| MER | 0.25% | 0.23% |
| Holdings Overlap | 60.06% | |
IHD’s 0.02% MER advantage is statistically insignificant for most retail portfolio sizes. On a $50,000 holding, the annual cost difference amounts to $10.
The more material differentiator is fund size. VHY’s $7 billion in assets under management dwarfs IHD’s $377 million, and that gap translates directly into tighter bid-ask spreads in normal market conditions. For investors who intend to add to or reduce their position regularly, whether through dollar-cost averaging or periodic income withdrawals, spread efficiency matters more than a fractional MER difference.
The 60.06% holdings overlap confirms these are similar strategies with meaningful shared exposure, not true alternatives. Directly comparable 12-month return data for IHD was not available in current sources, so a performance comparison should not be drawn without verified figures.
VHY’s 22%-plus return was not a broad market phenomenon. It was sector-specific, tied to a rotation away from growth and technology into financials and resources.
Over the same 12-month window, growth and technology stocks faced valuation headwinds and AI-disruption uncertainty that weighed on returns. Capital rotated toward dividend-paying sectors where earnings visibility was higher and yield offered a more immediate return. VHY’s mandate placed it squarely in the path of that rotation.
Income strategies lead market returns in certain cycles and lag in others. The past 12 months represent the former, not a structural shift in how markets reward yield-focused portfolios.
The fund’s 52-week high of $86.19 and the subsequent decline to approximately $82.88 (a pullback of roughly 3.7%) illustrate that even within a strong year, unit price volatility is present. A short-term sell signal was issued following the 52-week high, consistent with the subsequent pullback, though this is noted as context rather than actionable trading guidance.
Investors should monitor three risk factors in particular:
CBA’s dividend sustainability is the central question for income investors weighing whether VHY’s largest bank holding can continue delivering both franked income and capital support: with a trailing price-to-earnings ratio of 27.9x against a 10-year median of 16.8x, the valuation premium embedded in VHY’s unit price carries a specific repricing risk if consensus targets around A$130 eventually reassert themselves.
The 22% total return is one data point in what should be a multi-year evaluation. The 31 March 2026 reported total return of 23.31% (comprising 14.52% growth and 8.79% income) provides a cross-check that confirms the strong period, but neither figure should be treated as a repeatable annual expectation.
The more durable forward-looking metric is VHY’s projected annual distribution yield of approximately 5.51%. Combined with the ongoing cost of 0.25% MER, that yield figure represents the structural income proposition investors can reasonably anchor to when evaluating a long-term hold.
Before making an allocation decision, investors should answer three questions:
VHY is well-suited to income-focused, long-term holders comfortable with Australian equity concentration. For investors seeking global diversification or low-volatility income streams, the fund’s sector tilt may represent a poor fit regardless of its recent performance.
For investors who have concluded that VHY’s domestic concentration does not fully meet their portfolio objectives, our dedicated guide to building an inflation-aware ASX ETF portfolio walks through six funds across fixed income (VBND at 5.91% yield, CRED at 5.2%), global equities, and cash reserves, with a three-layer framework designed to generate positive real returns against Australia’s current 4.6% CPI.
The appropriate next step is to review the fund’s most recent Product Disclosure Statement (PDS) and distribution history via Vanguard Australia before making any allocation decision.
This article is for informational purposes only and should not be considered financial advice. Investors should conduct their own research and consult with financial professionals before making investment decisions. Past performance does not guarantee future results.
VHY’s 22%-plus total return over 12 months was the product of two quantifiable forces: capital appreciation driven by sector tailwinds and distribution income from a high-yield mandate that delivered as designed. The favourable macro condition, a rotation into financials and resources at the expense of growth and technology, amplified both.
The fund’s forward case rests on its 5.51% projected yield, its $7 billion liquidity base, and its structural tilt toward Australia’s highest-yielding large caps. It does not rest on the expectation of another above-average capital gain year. Investors considering a position should review the most recent PDS and distribution history on Vanguard Australia’s fund page as the starting point for any allocation decision.
The Vanguard Australian Shares High Yield ETF (VHY) is an ASX-listed fund that targets Australian companies with above-average dividend yields, generating returns through two channels: unit price appreciation as underlying holdings are revalued by the market, and quarterly cash distributions passed through from dividends received on portfolio holdings.
A $10,000 investment in VHY one year ago would be worth approximately $12,217 as of 30 April 2026, comprising roughly $11,570 in capital value and approximately $637 in distribution income, equating to a total return of just over 22%.
VHY's projected annual distribution yield sits at approximately 5.51%, and distributions carry substantial franking credits (ranging from 72% to 89% in recent quarters), which reduce the tax liability for Australian resident investors and can result in cash refunds for those in zero-tax structures such as superannuation pension phase.
VHY and IHD share approximately 60% holdings overlap, but VHY holds around $7 billion in assets under management versus IHD's $377 million, giving VHY significantly tighter bid-ask spreads; the MER difference (0.25% versus 0.23%) amounts to just $10 per year on a $50,000 holding.
The main risks include high sector concentration in Australian financials and resources (meaning a downturn in either sector would weigh heavily on unit price and distributions), unit price volatility within an otherwise strong year, and the possibility that earnings moderation at major holdings could reduce the forward distribution yield below its current 5.51% projection.