ASX Lithium Stocks Hit 52-Week Highs as Spodumene Tops $2,500
3 hrs ago

A $10,000 investment in Commonwealth Bank of Australia (CBA) five years ago would have purchased roughly 111 shares. The same $10,000 today buys around 57. That halving of purchasing power is the story behind a 94% price appreciation that has left investors, analysts, and even CBA’s own institutional holders asking whether the next five years can possibly rhyme with the last.
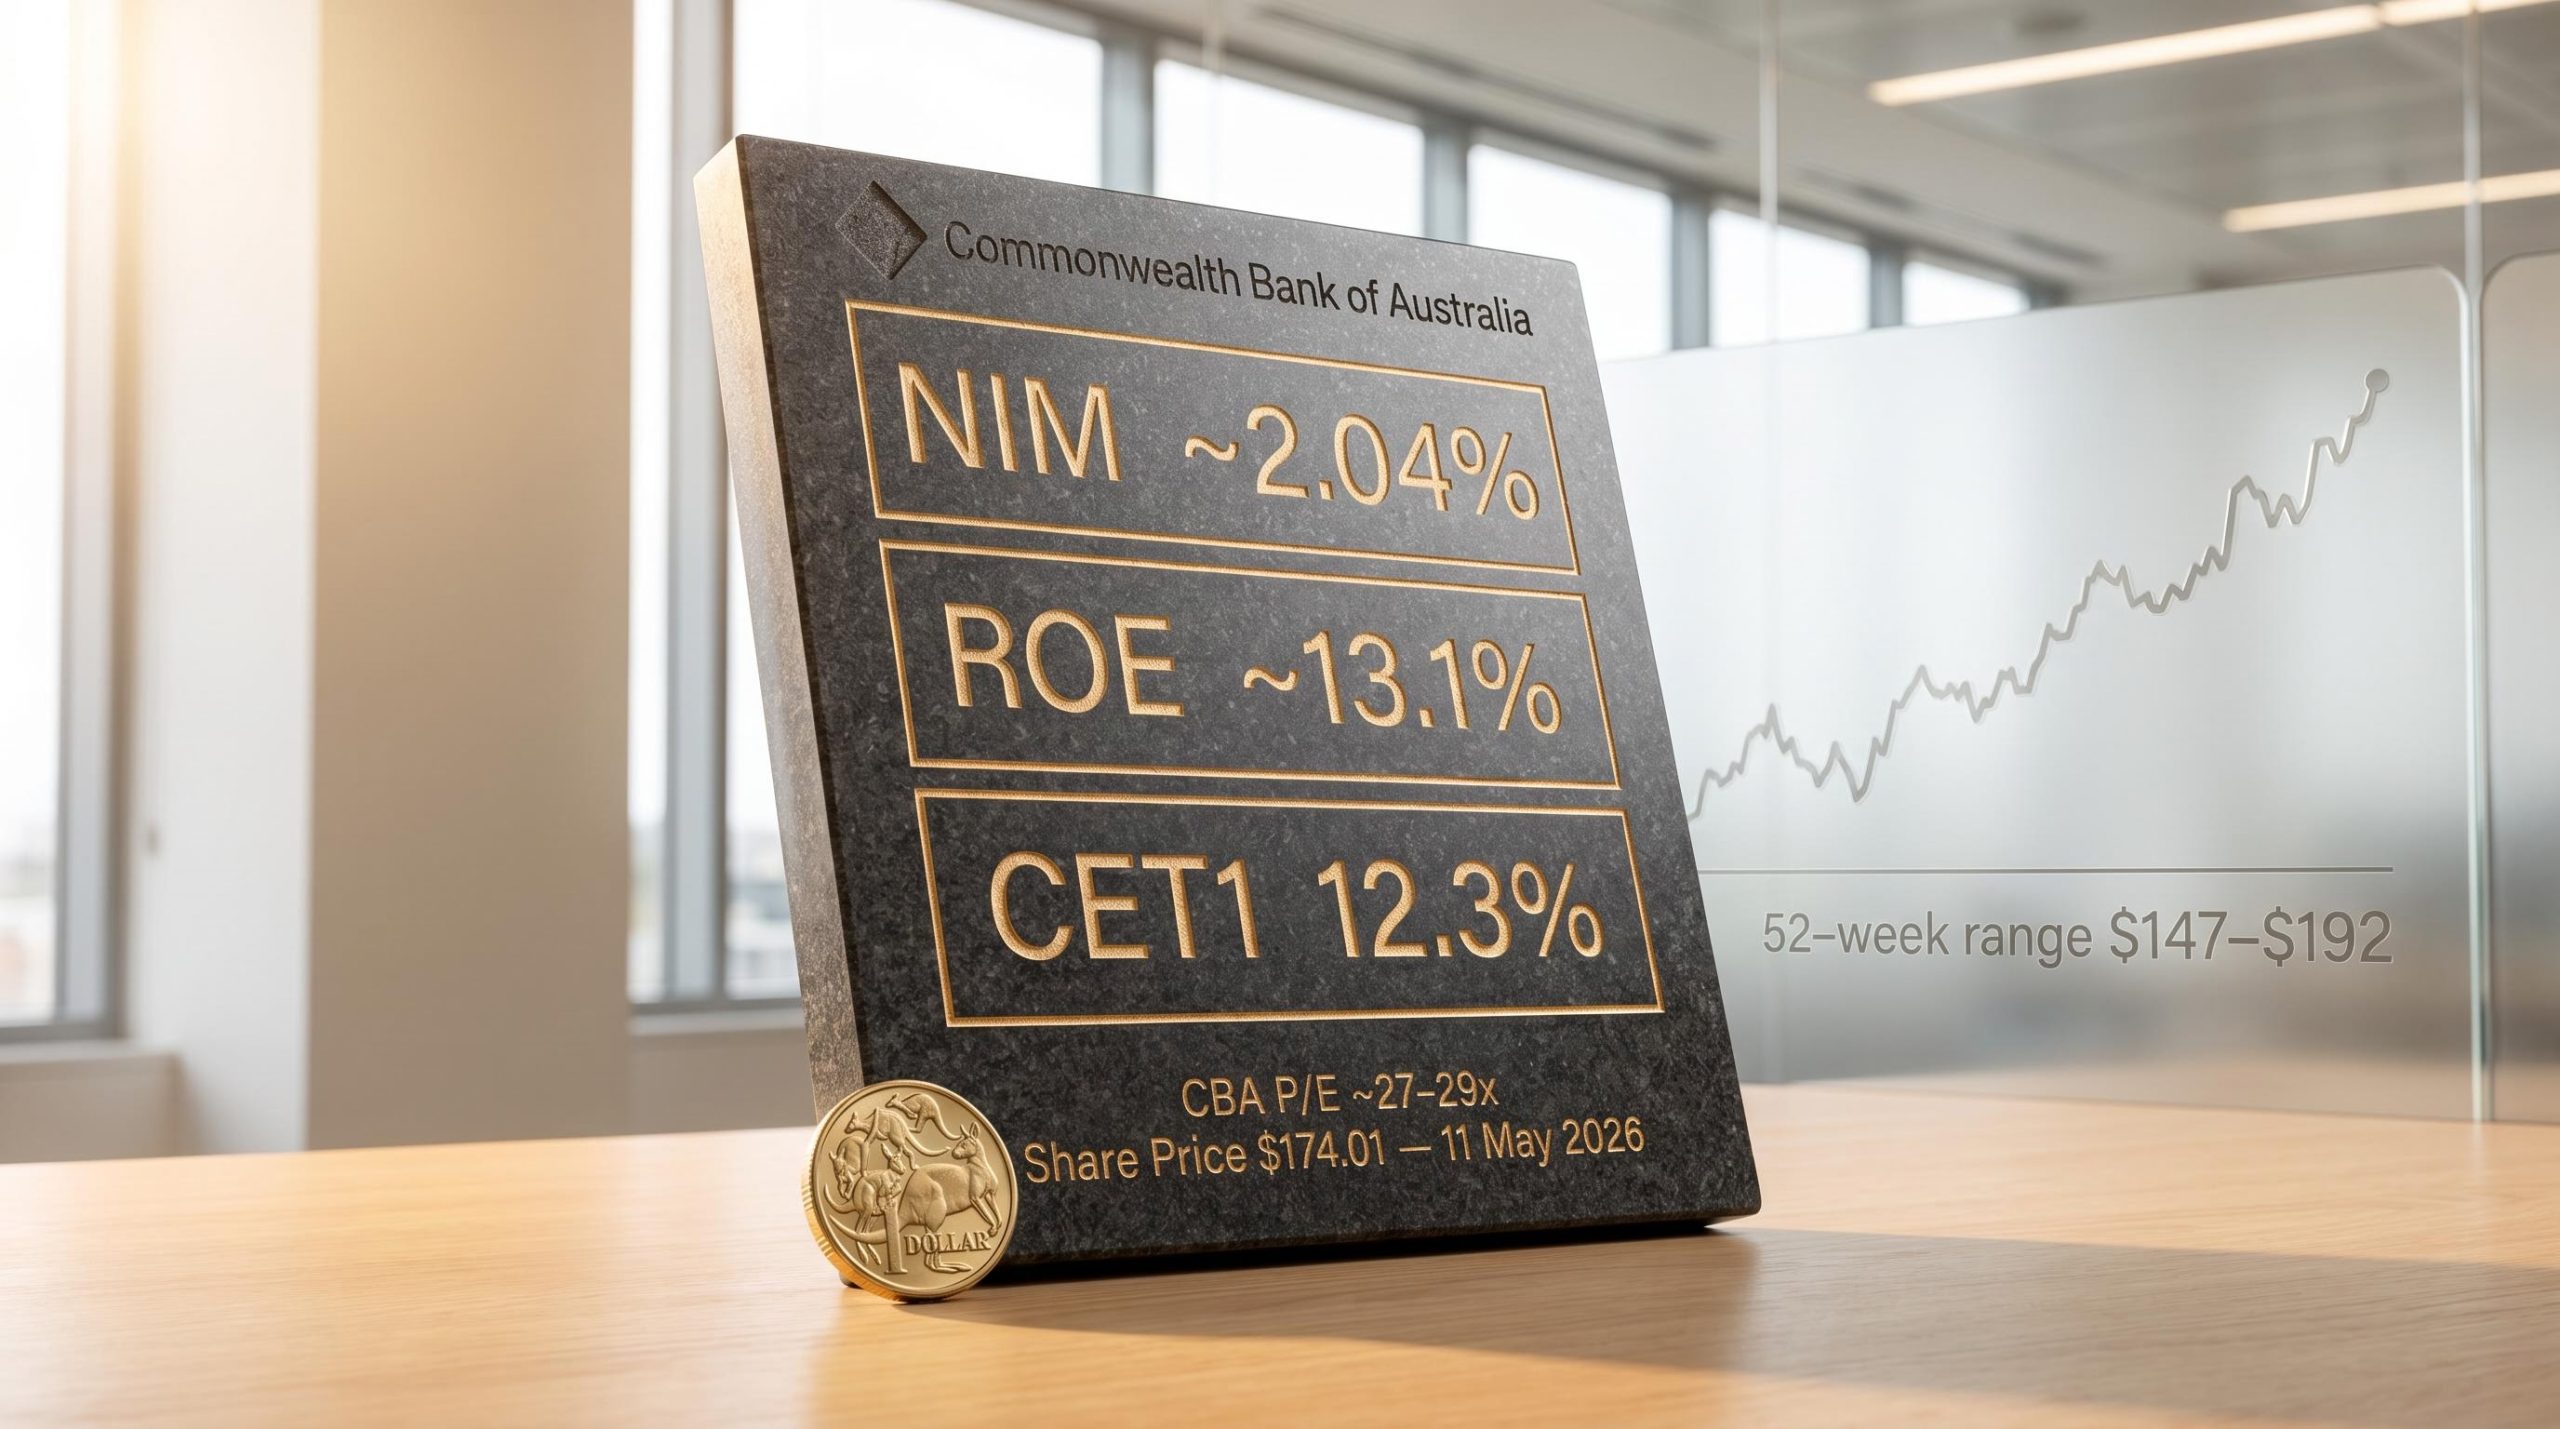
With the CBA share price trading at approximately $173.66 as of 30 April 2026, and a forward price-to-earnings (P/E) ratio near 26x, the bank sits at one of the most contested valuations in Australian market history. Fourteen of fourteen analysts covering the stock carry a Sell rating. Understanding why the share price reached this level, and why the path forward looks structurally different, requires separating two distinct forces that have both been pulling in the same direction, until now.
This analysis breaks down exactly how much of CBA’s rise came from genuine profit growth versus a re-rating of what the market is willing to pay per dollar of earnings, and explains what happens to shareholders when only one of those two engines remains available.
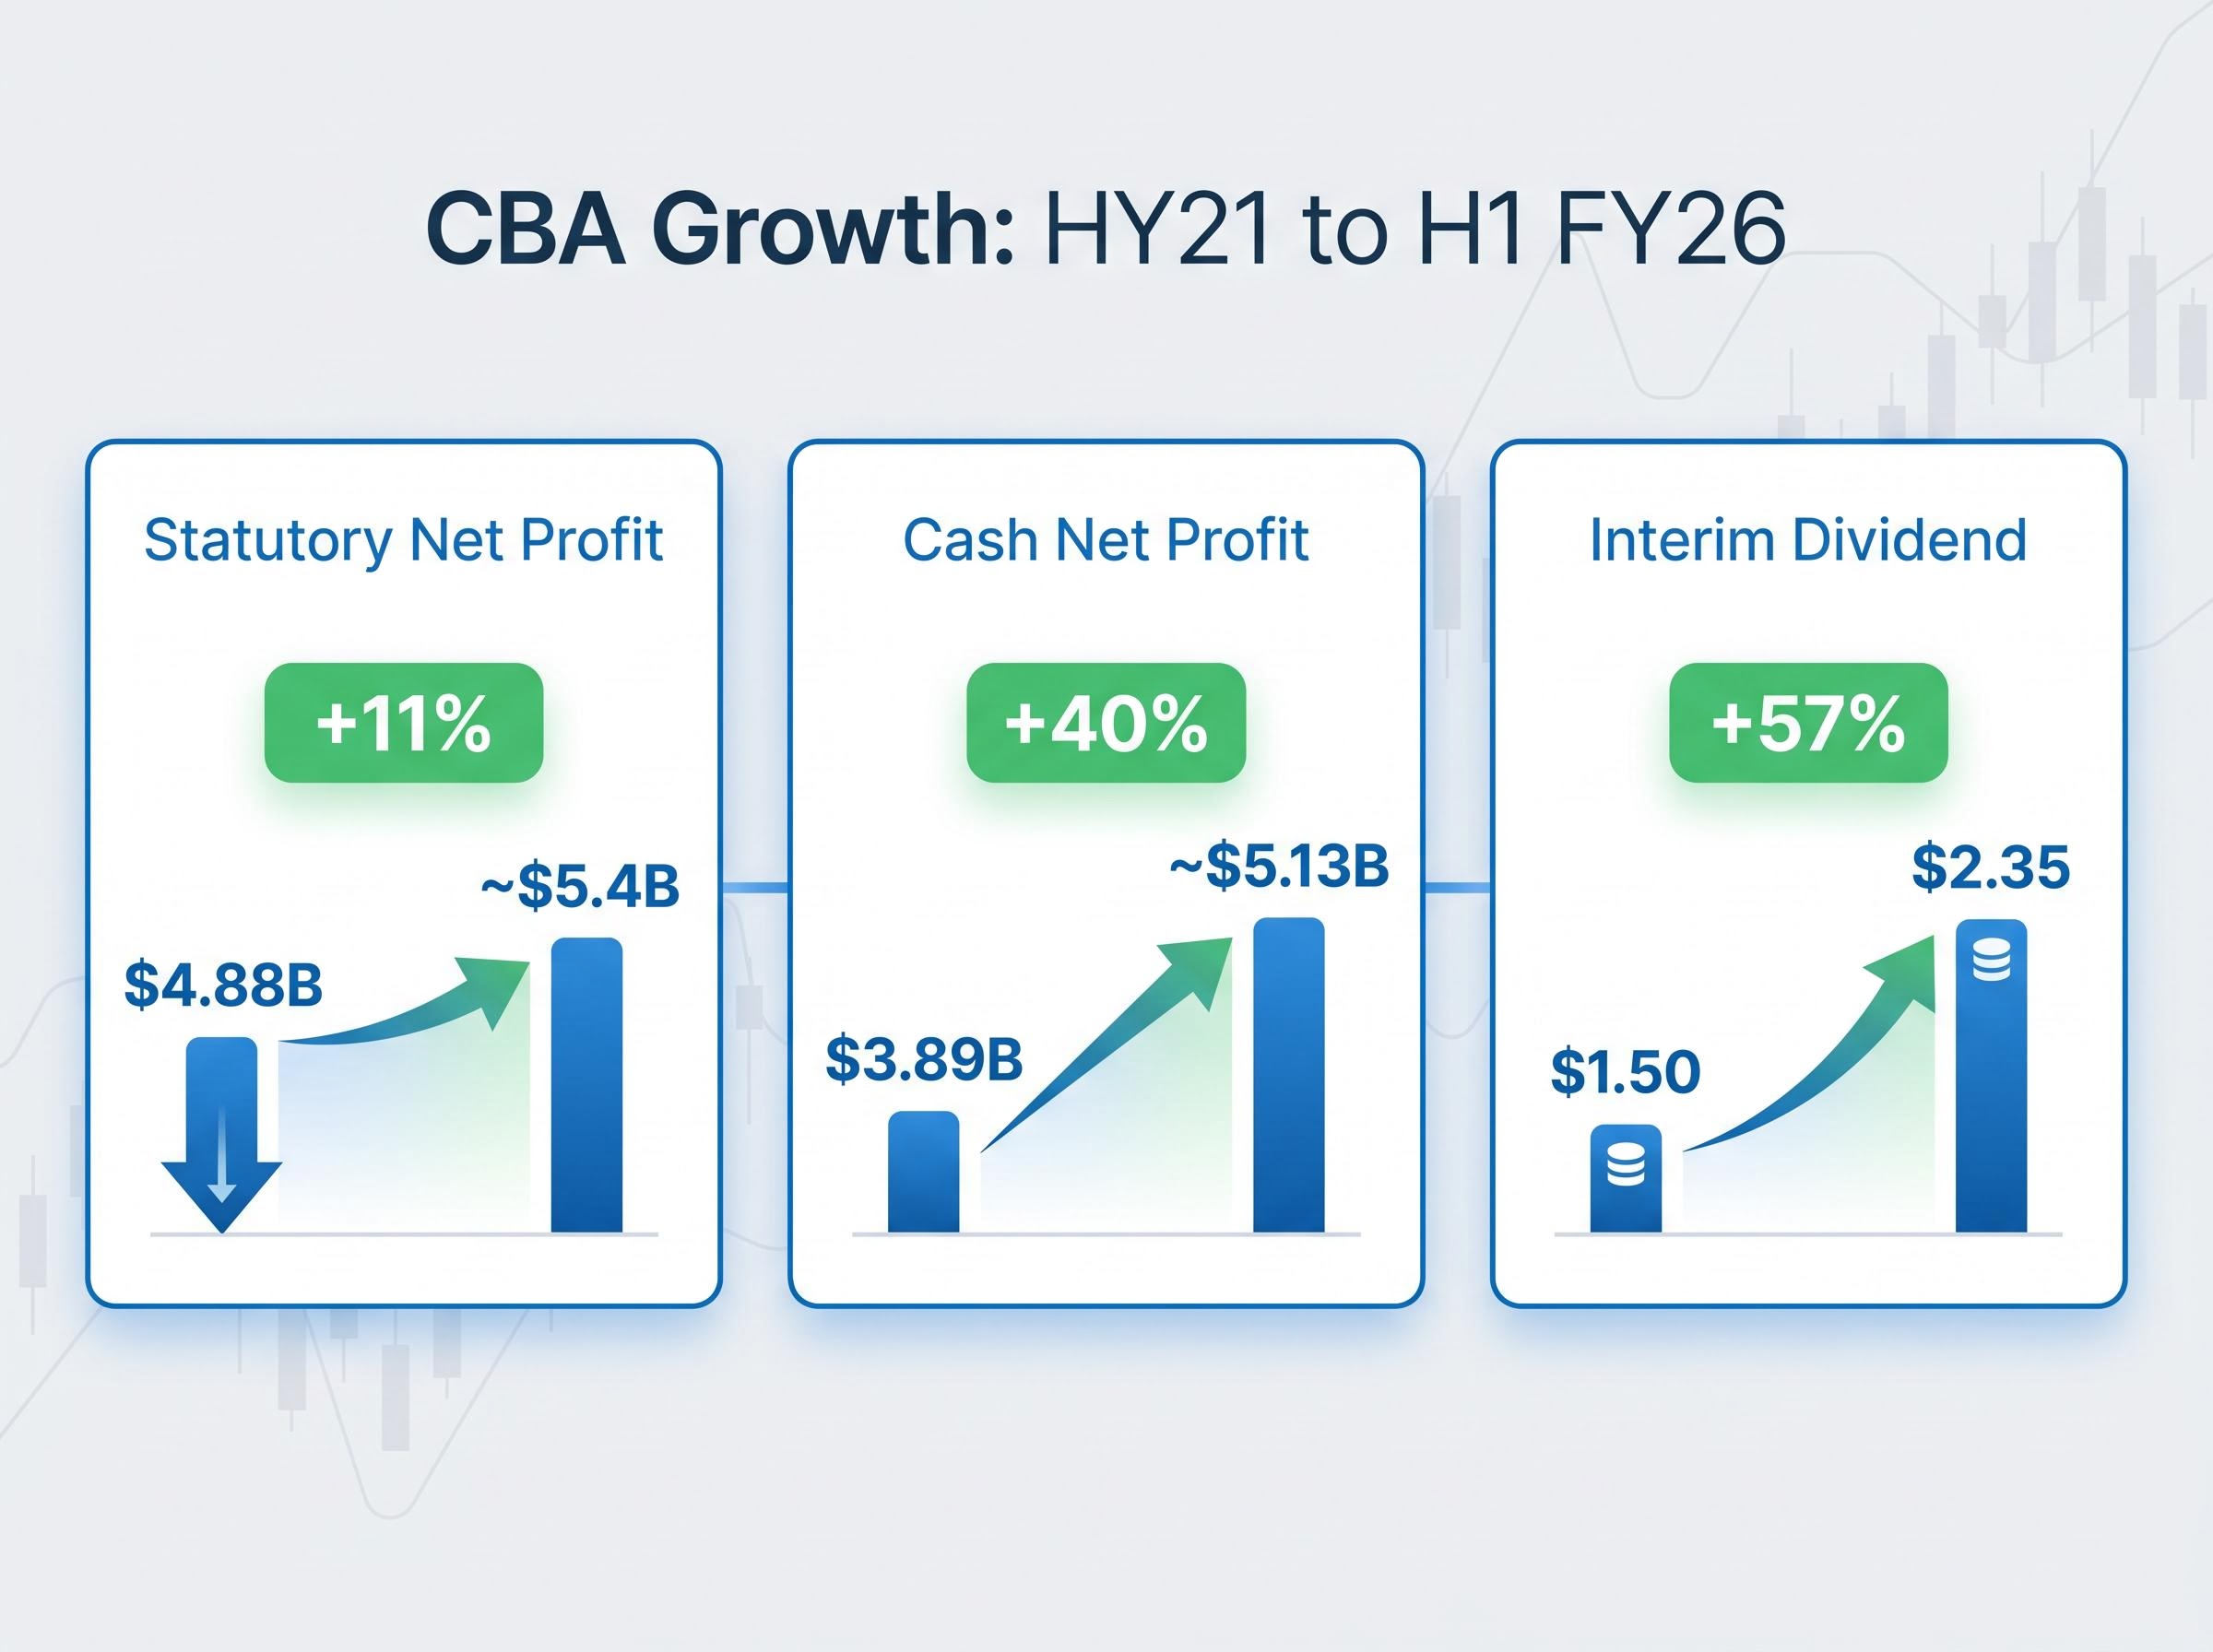
The headline numbers tell an impressive story. From HY21 through H1 FY26, CBA’s cash net profit rose from $3.89 billion to approximately $5.13 billion, a cumulative increase of roughly 40%. Pre-provision profit for the latest half came in at $8.1 billion, up approximately 5% year-on-year. These are real gains from a real banking franchise.
The statutory figures tell a quieter version. Statutory net profit grew from $4.88 billion in HY21 to approximately $5.4 billion in H1 FY26, an increase of roughly 11%. The gap matters. Cash net profit strips out one-off items and hedging distortions to isolate core banking earnings; it is the number institutional analysts anchor to when assessing operational performance. Investors tracking only the statutory headline may be overstating the trajectory.
It is also worth noting that HY21 was a deliberately low base, shaped by COVID-era disruptions, suppressed interest rates, and elevated provisioning. Growth from that trough, while genuine, should be contextualised accordingly.
Dividend growth: $1.50 to $2.35 CBA’s interim dividend rose 57% over the period from HY21 to H1 FY26, the clearest signal to income-oriented holders that genuine value was created.
| Metric | HY21 | H1 FY26 | Change |
|---|---|---|---|
| Statutory net profit | $4.88B | ~$5.4B | ~11% |
| Cash net profit | $3.89B | ~$5.13B | ~40% |
| Interim dividend | $1.50 | $2.35 | +57% |
| Pre-provision profit | N/A | ~$8.1B | ~5% YoY |
CBA’s share price appreciation over the past five years was not driven by earnings growth alone. A second force was working simultaneously, and understanding it changes how the next five years should be evaluated.
Two engines have powered the price higher:
P/E expansion is the market re-rating its willingness to pay. When a stock’s P/E ratio rises from, say, 18x to 26x, shareholders benefit from that re-rating even if earnings remain flat. It is a powerful tailwind. It is also, by definition, a one-time tailwind; a multiple can only expand to a given level once.
CBA’s forward P/E sits at approximately 25.6x as of late April 2026, with a trailing P/E of roughly 27.6x. According to CommSec projections, the FY26 forward P/E of approximately 26x is near an all-time high for the bank.
This is the analytical pivot. When a stock’s multiple is already at or near its historical ceiling, the P/E expansion engine cannot contribute meaningfully to future price appreciation. The entire burden of generating returns shifts to earnings growth. For Australian retail investors who attribute CBA’s price rise entirely to profit improvement, this distinction directly affects how they should think about forward return expectations.
The P/E premium becomes viscerally clear when measured against peers.
| Bank | Forward P/E (approx.) |
|---|---|
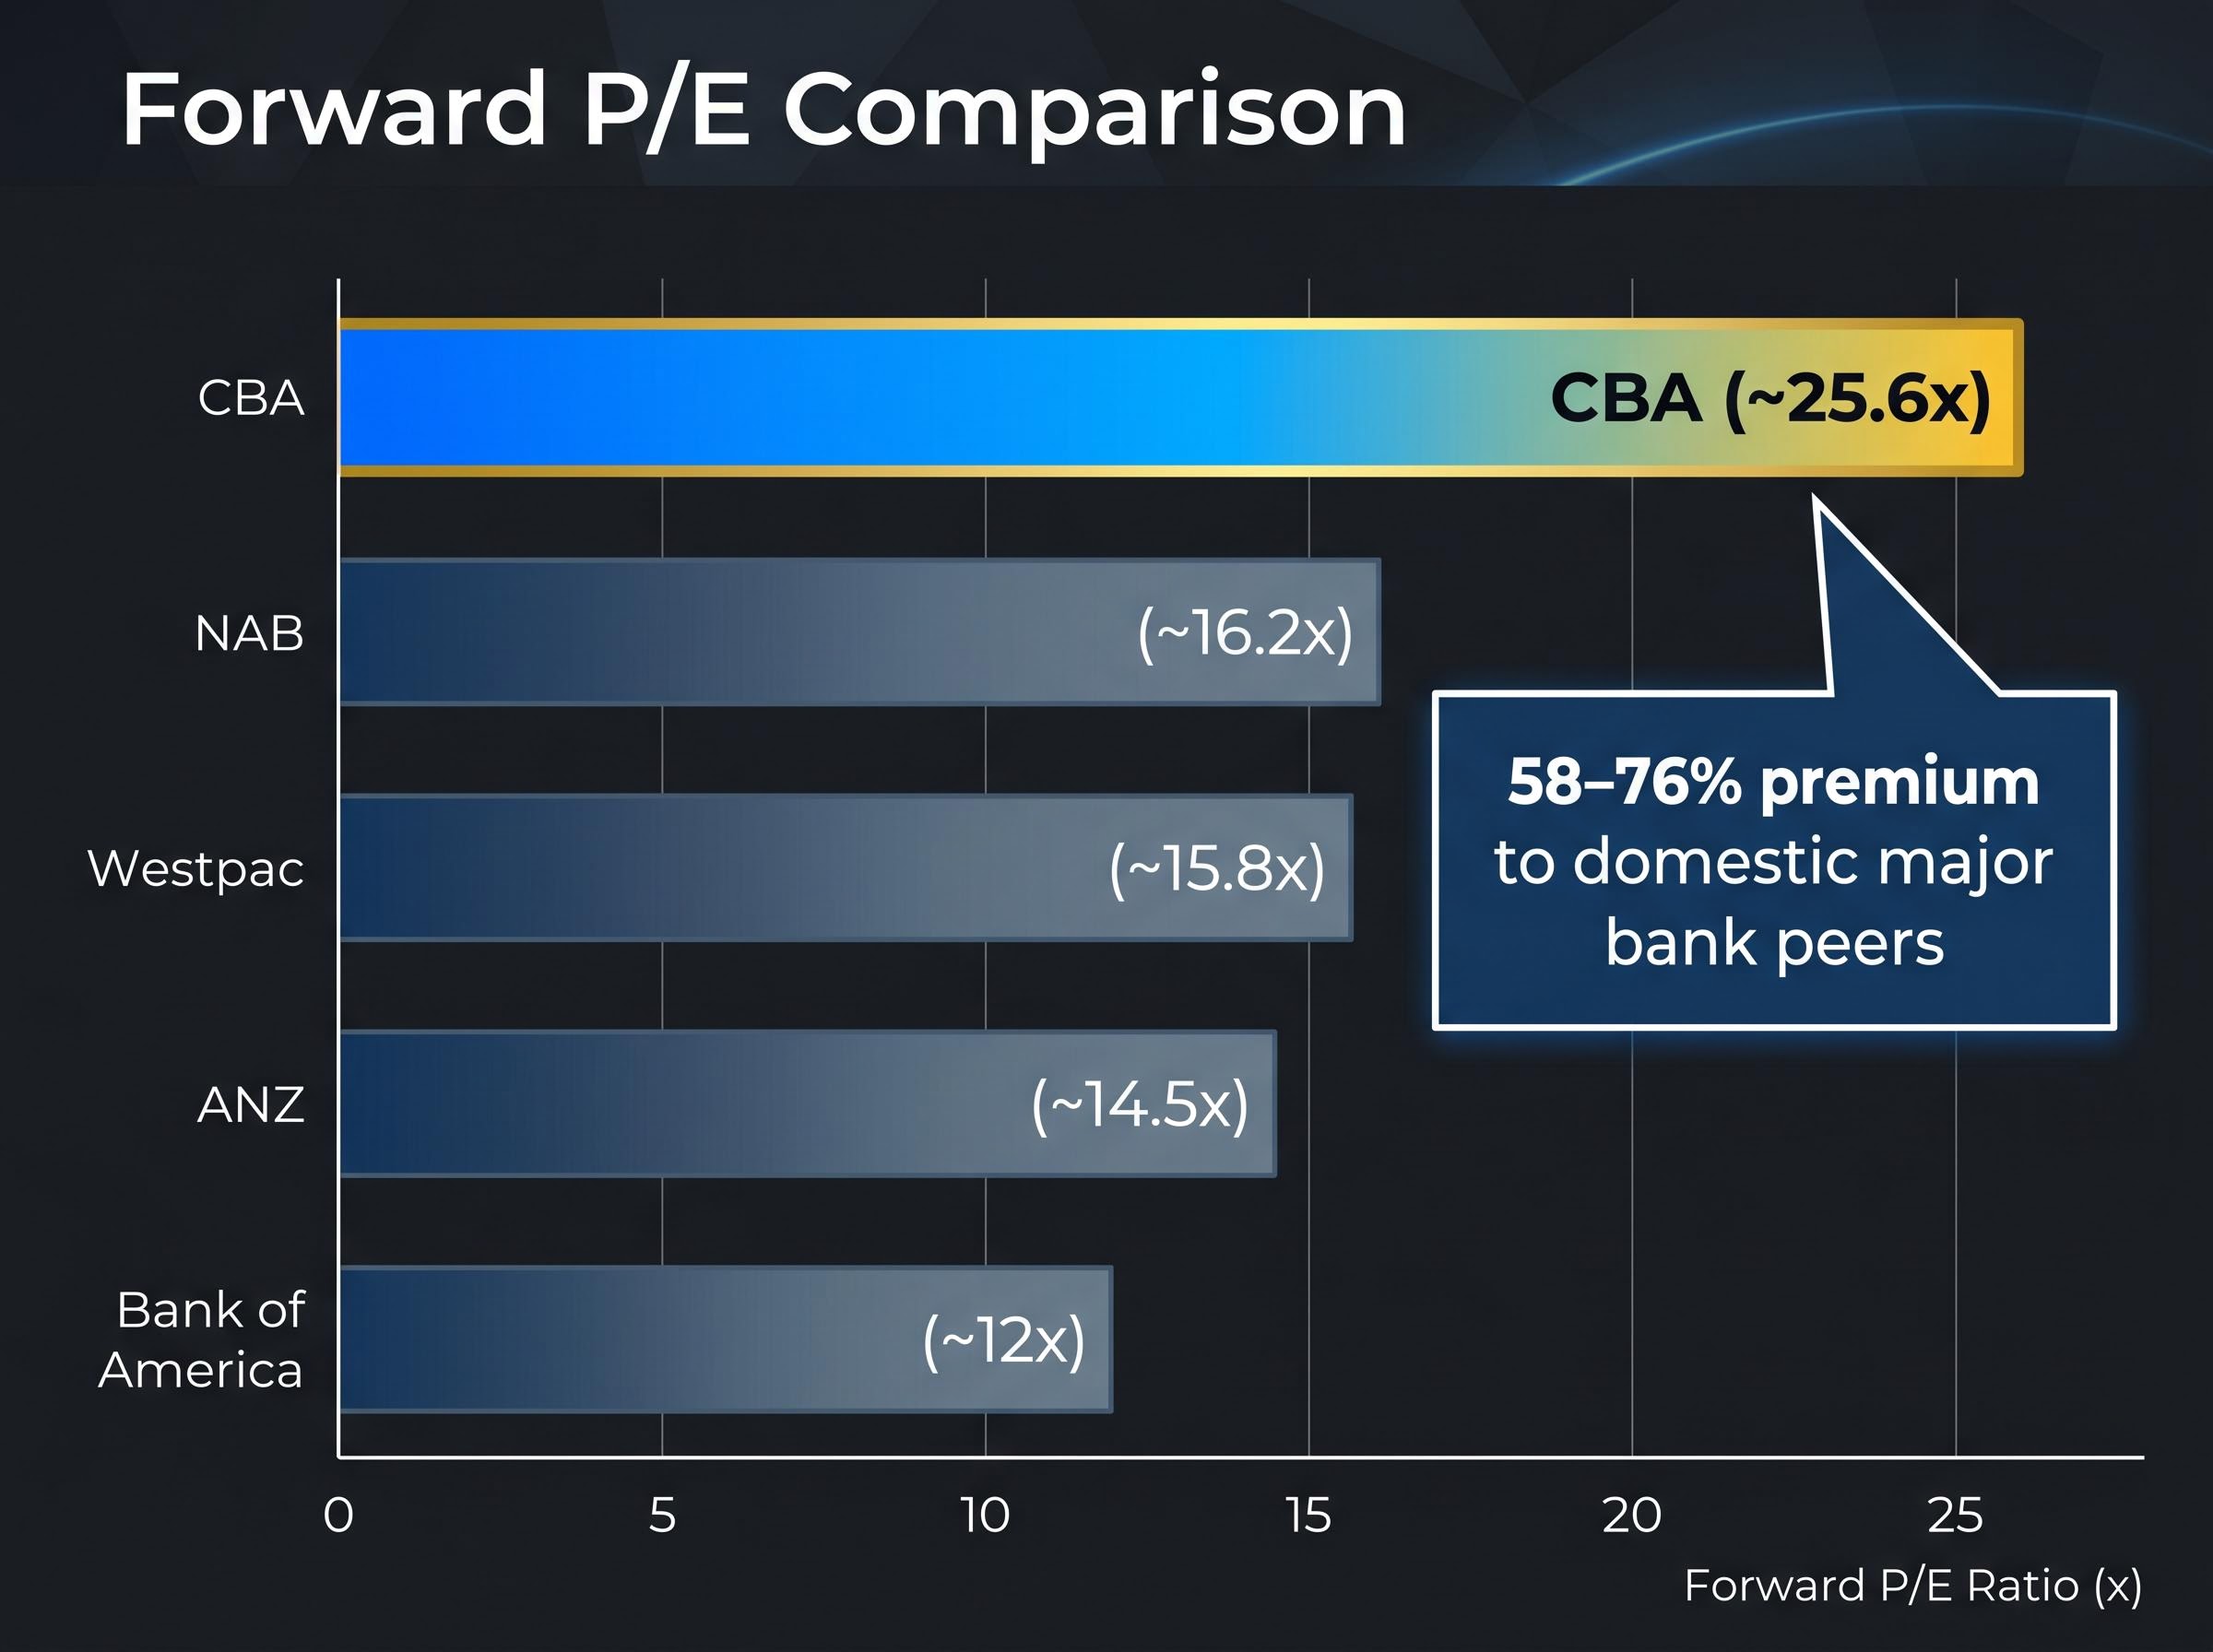
| CBA | ~25.6x |
| NAB | ~16.2x |
| Westpac | ~15.8x |
| ANZ | ~14.5x |
| Bank of America | ~12x |
CBA trades at a 58-76% premium to its domestic major bank peers on a forward P/E basis. Against Bank of America, the gap is more than double.
The Betashares valuation comparison of global banks published in late 2025 placed CBA’s forward P/E at 25.7x against a MSCI World Banks Index of 12.7x, a gap that contextualises just how far the re-rating has carried the stock beyond any plausible global peer benchmark.
According to Betashares commentary reviewing 2025, CBA achieved “most expensive bank in the world” status during mid-2025, when the share price rose approximately 45% across FY25, pushing valuations to globally extreme levels relative to earnings.
A premium can be rationally justified. CBA’s franchise quality is high; it holds the largest retail deposit base in Australia, dominates mortgage origination, and carries the liquidity premium that comes with being the ASX’s largest financial constituent. Fitch Ratings upgraded CBA to AA on 5 March 2026, reinforcing the credit quality argument.
The analytical controversy is not whether a premium is warranted. It is whether a premium of this scale is sustainable when measured against the growth rate the bank can realistically deliver.
As of April 2026, all 14 analysts covering CBA carry a Sell rating. Zero carry a Buy. The average price target sits at approximately $124.57, implying roughly 28% downside from the 30 April 2026 closing price of $173.66.
The unanimity is unusual and worth examining carefully. Specific broker positions illustrate the reasoning:
Commentary from Motley Fool Australia and Firstlinks has separately flagged CBA as a potential drag on ASX index performance in coming years.
The same dynamic playing out in CBA reflects a sector-wide valuation problem: across all four major Australian banks, record profits have been met with higher share prices rather than a closing of the gap between analyst targets and market prices, pushing the overvaluation further from resolution rather than toward it.
The core analytical argument is straightforward. A forward P/E of 25-26x is a valuation typically associated with high-growth businesses delivering 20% or more annual earnings expansion. CBA’s recent cash profit growth rate is approximately 5-6% year-on-year.
That gap between the multiple and the growth rate is the structural tension. Morgans’ discounted cash flow (DCF) modelling, a methodology that values a company based on the present value of projected future cash flows, independently arrives at a similar overvaluation conclusion. The bearish case is not that CBA is a poor bank. It is that the market is pricing the stock as though earnings growth will be substantially higher than any available forecast supports.
At $173.66, with a forward P/E near 26x and recent earnings growth of 5-6%, the arithmetic for future returns narrows considerably. The 52-week range of $146.98 to $192.00 illustrates how wide the market’s own uncertainty already is.
Three scenarios frame the forward outlook:
Firstlinks characterised CBA as likely to be “a significant drag on the overall share market in coming years,” a view that reflects the weight CBA carries in ASX-tracking index funds such as Vanguard VAS, where passive holders may not fully appreciate their concentration exposure.
Past performance does not guarantee future results. Financial projections are subject to market conditions and various risk factors.
The next major near-term catalyst for the sector is the RBA rate decision scheduled for 5 May 2026, where a hold would sustain net interest margin benefits for the banks but prolong loan demand headwinds, while a cut could trigger a sector-wide re-rating that further complicates the relationship between CBA’s earnings trajectory and its current multiple.
The profit growth was real. A 40% cumulative increase in cash earnings and a 57% dividend increase from HY21 to H1 FY26 created genuine value for long-term holders. That achievement deserves acknowledgement.
The re-rating was also real. The market’s willingness to pay progressively more for each dollar of CBA’s profit amplified returns well beyond what earnings growth alone would have delivered. Both engines ran at full capacity, and shareholders benefited.
The analytical question going forward is not whether CBA is a good bank. It is whether CBA is a good investment at this price. A forward P/E near its all-time high of approximately 26x, a unanimous Sell consensus with an average target of $124.57, and earnings growth projections in the low-to-mid single digits describe a stock where the re-rating engine has largely done its work.
For investors holding CBA through superannuation, through ASX-tracking funds like VAS, or through direct ownership, the concentration risk warrants conscious evaluation. The conditions that produced the last five years of returns, simultaneous profit growth and multiple expansion, may not repeat.
For investors reassessing their domestic equity concentration after reviewing CBA’s valuation, our dedicated guide to Australian home bias and global diversification examines the structural shift away from ASX-only portfolios, including the generational adoption data, ETF flow evidence from Q1 2026, and the macro forces driving Australian investors toward international allocations for the first time on record.
ASX 200 index fund concentration risk sits at the centre of this concern: the index’s modest year-to-date gain as of late April 2026 is almost entirely dependent on bank stock performance, meaning a valuation reset in financials would remove the primary structural support for every passive holder tracking the benchmark.
The distinction that matters from here: CBA the business continues to operate as Australia’s strongest retail banking franchise. CBA the stock, at 26x forward earnings with 5-6% growth, asks investors to accept a return profile that looks structurally different from the one that brought them here.
This article is for informational purposes only and should not be considered financial advice. Investors should conduct their own research and consult with financial professionals before making investment decisions.
P/E expansion occurs when the market pays a higher multiple for each dollar of a company's earnings, boosting the share price independently of profit growth. For CBA, this re-rating from lower multiples to a forward P/E of roughly 26x amplified returns well beyond what earnings growth alone would have delivered, but a multiple can only expand to a given level once.
The unanimous Sell consensus reflects a structural mismatch: CBA trades at a forward P/E of approximately 25.6x while delivering cash profit growth of only 5-6% annually, a combination typically seen in high-growth businesses expanding earnings at 20% or more. The average analyst price target of $124.57 implies roughly 28% downside from the April 2026 price of $173.66.
CBA trades at a 58-76% premium to its domestic peers on a forward P/E basis, with NAB at roughly 16.2x, Westpac at 15.8x, and ANZ at 14.5x. Against Bank of America at approximately 12x and the MSCI World Banks Index at 12.7x, CBA's premium is more than double.
At a forward P/E near 26x, CBA would need to sustain double-digit annual profit growth to make its valuation look reasonable relative to history and peers, yet no current broker forecast projects this outcome. Morgans has moved in the opposite direction, downgrading FY26-28 EPS and DPS forecasts by approximately 3%.
CBA is the largest financial constituent of the ASX 200, meaning investors holding index funds such as Vanguard VAS carry significant concentration exposure to the stock. A valuation reset in CBA could remove the primary structural support for every passive holder tracking the benchmark, as the ASX 200's year-to-date gains as of late April 2026 are almost entirely dependent on bank stock performance.