Cook Warns Memory Costs Will Force Apple Price Increases in 2026
52 mins ago

Morningstar‘s Associate Portfolio Manager Matt Wilkinson has flagged Australian bank stocks as overvalued at current prices, even as those same banks have been among the few bright spots in an otherwise muted domestic market in 2026. The apparent contradiction sits at the heart of Australian equity markets right now: the stocks keeping the ASX afloat are precisely the ones drawing the sharpest valuation warnings. With the S&P/ASX 200 up roughly 1.1% year-to-date versus a declining S&P 500 and Nasdaq, Australia’s relative resilience rests almost entirely on the major banks, and that concentration carries real risk.
This analysis unpacks Morningstar’s valuation warnings, examines what stretched bank multiples mean for retail investors, and sets the domestic picture against a global market where US tech stocks are also trading at thin margins for error.
On the surface, Australian equities are outperforming. The S&P/ASX 200 has returned approximately +1.10% year-to-date as of 28 April 2026, while the S&P 500 sits at roughly -2.5% and the Nasdaq at approximately -3.2%. Even the MSCI Emerging Markets index, at around +1.8%, offers only a modest lead.
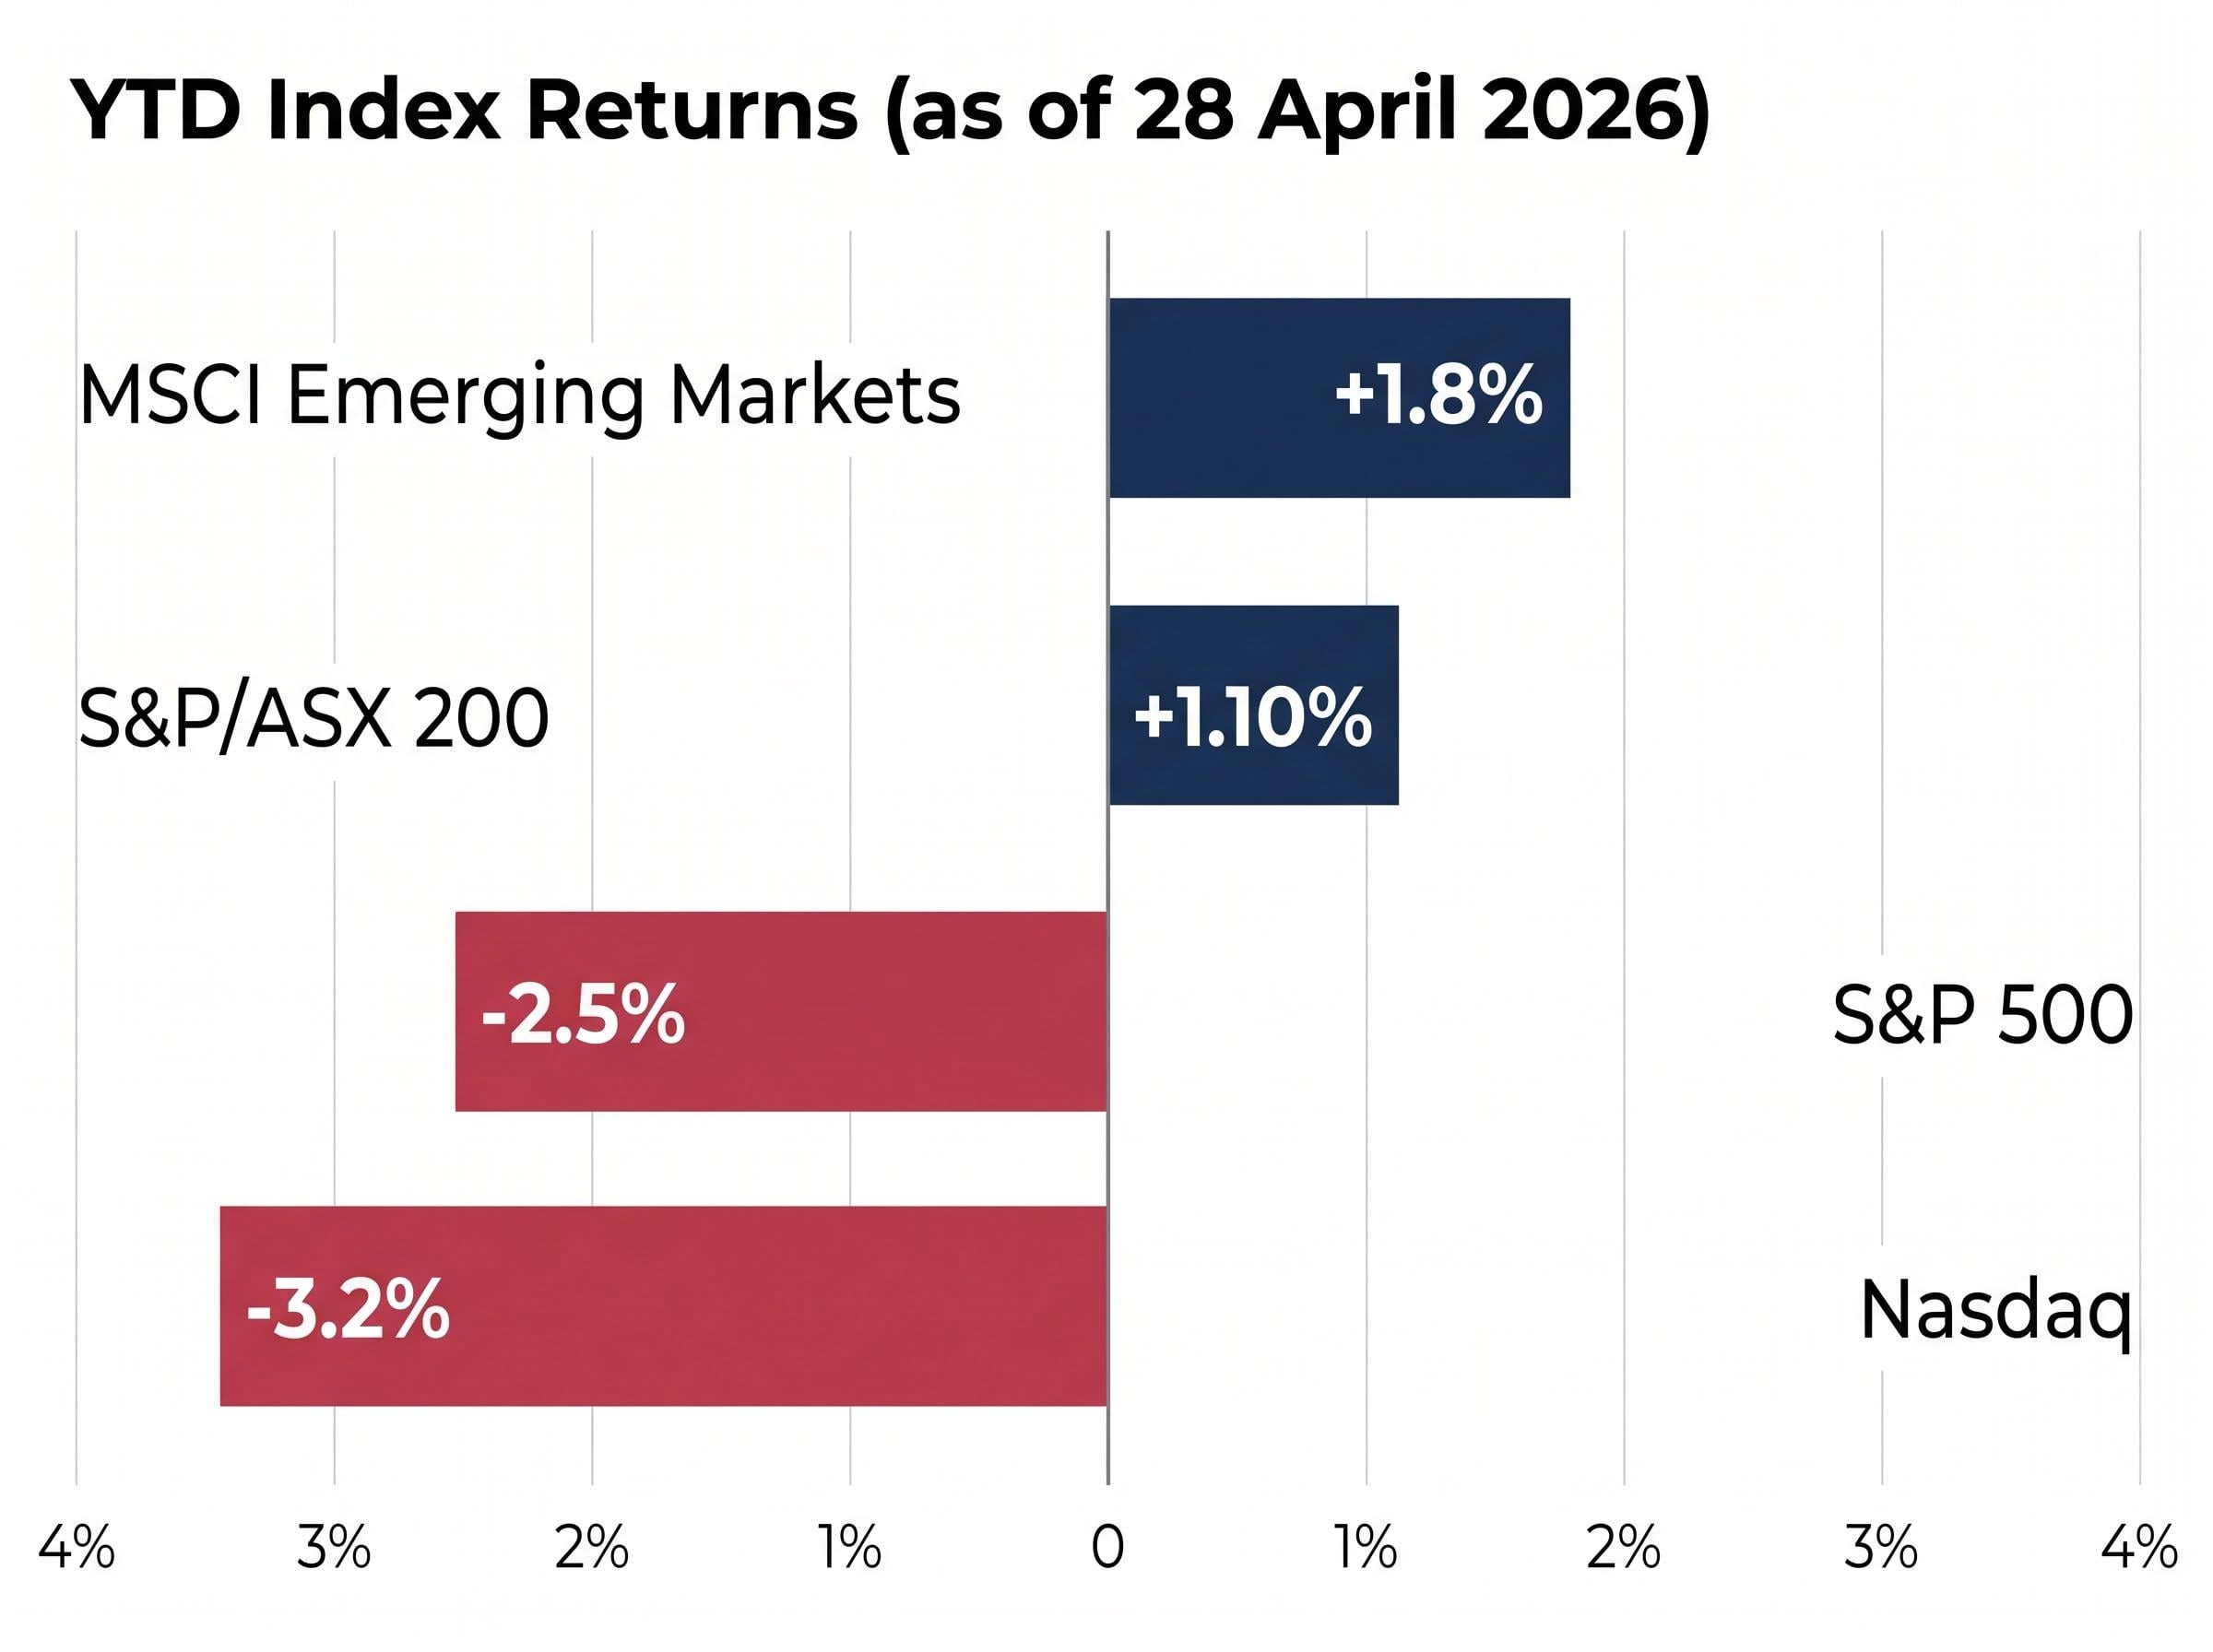
| Index | YTD Return (as of 28 April 2026) |
|---|---|
| S&P/ASX 200 | +1.10% |
| S&P 500 | -2.5% |
| Nasdaq | -3.2% |
| MSCI Emerging Markets | +1.8% |
The headline comparison flatters Australia. Peel back the index composition and the picture narrows considerably.
NABtrade and Livewire analysis confirmed that the four major banks did the “heavy lifting” for S&P/ASX 300 returns in Q1 2026, with the top five stocks, four of them banks, driving the index’s performance amid broader weakness.
The ASX 200 itself declined approximately 1.8% from January to March before recovering through April. That recovery was not broad-based. It was concentrated in the same financial names that had propped up Q1 returns. When four stocks account for most of the index’s movement, the label “outperformance” requires an asterisk. A shift in the outlook for those four names would not just trim returns; it would remove the structural support beneath the index entirely.
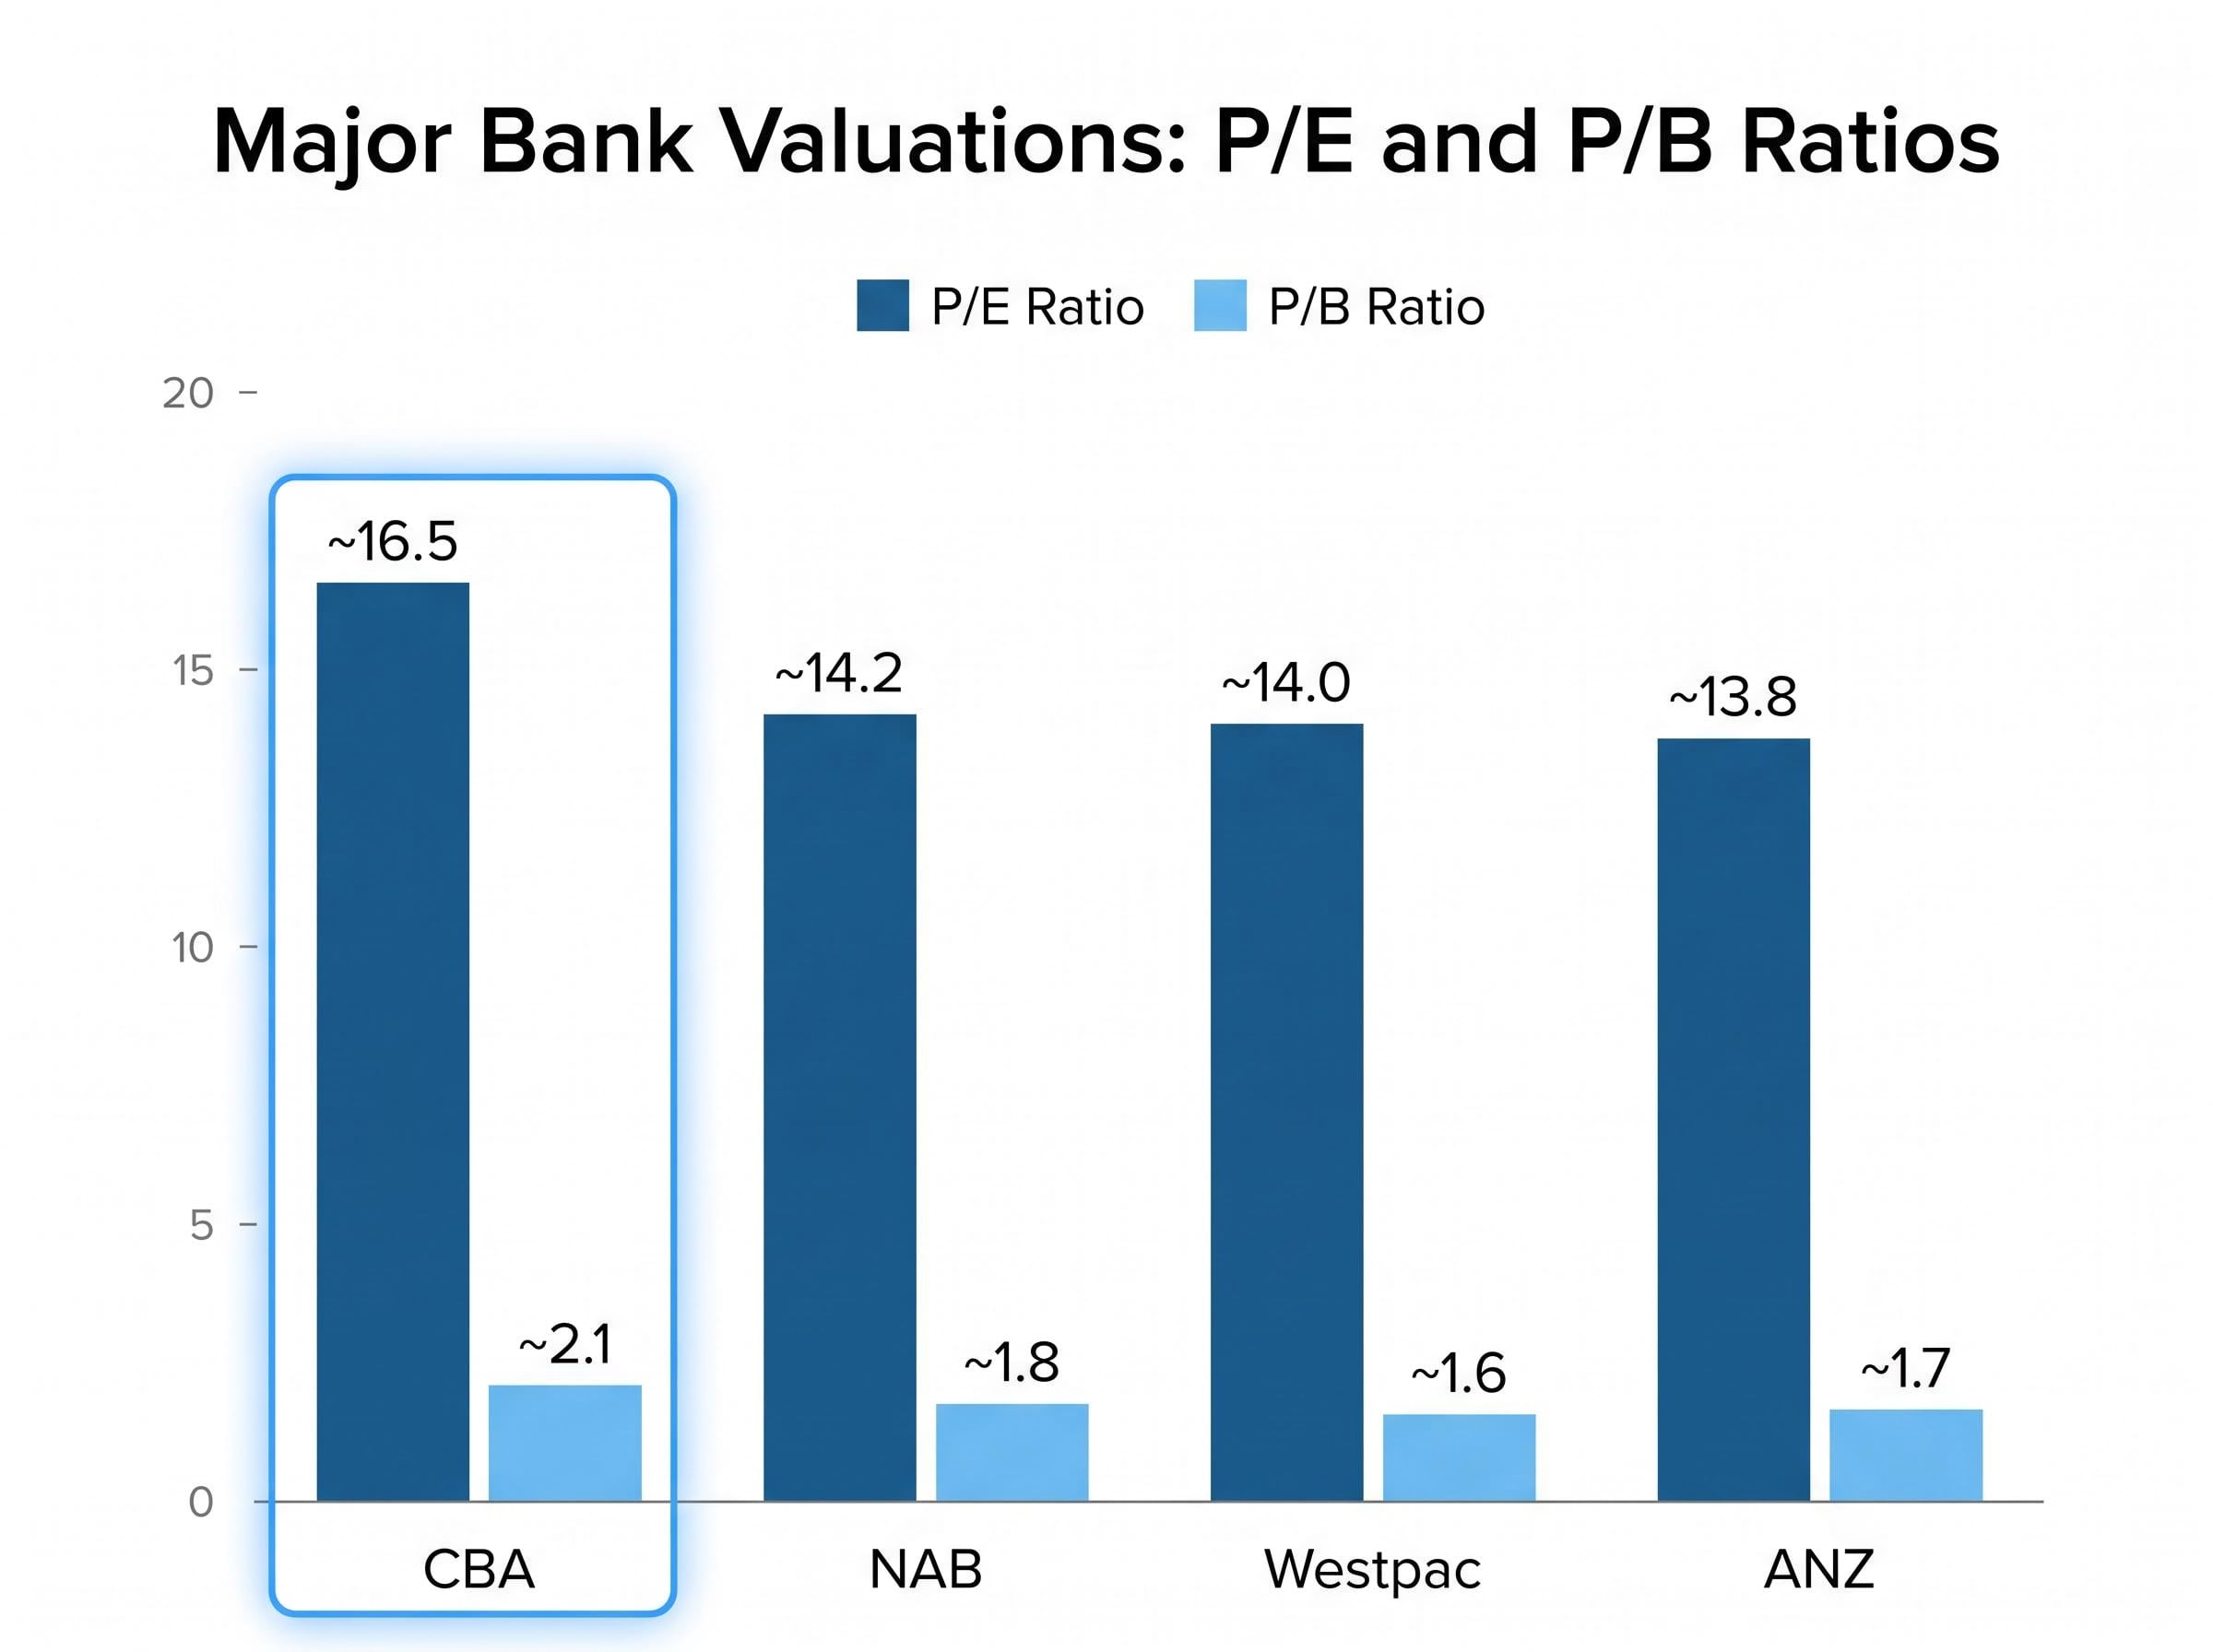
The valuation data explains why Morningstar’s concern is specific rather than general. Each of the four major banks currently trades at multiples above historical norms.
| Bank | P/E Ratio | P/B Ratio |
|---|---|---|
| CBA | ~16.5 | ~2.1 |
| NAB | ~14.2 | ~1.8 |
| ANZ | ~13.8 | ~1.7 |
| Westpac | ~14.0 | ~1.6 |
CBA stands out at a price-to-earnings ratio of approximately 16.5 and a price-to-book of 2.1, a premium that implies sustained earnings growth the broader environment may not deliver. NAB, ANZ, and Westpac trade at lower but still historically elevated levels.
CBA’s Fitch credit upgrade to AA in March 2026 illustrates the paradox at the core of the overvaluation argument: the same earnings strength and balance sheet quality that satisfied Fitch’s criteria for a rating lift also underpins the premium P/E multiple of approximately 16.5 that Morningstar now flags as leaving little margin for disappointment.
Matt Wilkinson of Morningstar Investment Management has assessed that current bank pricing reflects little margin for earnings disappointment. The multiples assume a benign credit environment and sustained net interest margin (NIM) support from elevated rates. Joseph Palmer’s April 2026 analysis noted the ASX dividend yield sits around 3.5% and that share buybacks are supporting earnings per share (EPS), a metric that measures a company’s profit allocated to each outstanding share.
Morningstar’s bank valuation analysis identifies CBA as the most stretched of the major lenders by P/E multiple, while flagging ANZ as having the most relative value among the four, a distinction that matters for investors considering whether to reduce rather than exit sector exposure entirely.
Elevated interest rates have delivered a short-term NIM boost to the major banks. A higher cash rate widens the gap between what banks earn on lending and what they pay on deposits. That margin benefit, however, carries a medium-term credit quality cost.
Westpac‘s April 2026 update flagged higher loan loss provisions, a concrete signal that mortgage and consumer loan stress is building. With the Reserve Bank of Australia (RBA) cash rate at 4.10% and a further 25 basis point hike expected in May 2026, the conditions driving provision increases are intensifying rather than easing. Palmer’s analysis acknowledged that while buybacks boost EPS, they raise debt risk if the economy deteriorates. The provisions disclosure suggests that deterioration may already be underway.
Investors wanting to examine the specific mechanics behind Westpac’s provisions increase will find our full explainer on Westpac’s 1H26 provision build, which covers the RAMS mortgage portfolio sale, the new energy-sector overlay, and the $75 million post-tax profit impact that will flow through to reported results when full 1H26 numbers are released on 5 May 2026.
The overvaluation concern is not confined to Australian banks. Wilkinson has also flagged US equity markets, particularly the technology and technology-adjacent sectors, as trading at stretched multiples.
The S&P 500 and Nasdaq reached or approached all-time highs in late April 2026 despite year-to-date volatility. Morningstar’s assessment is that US market pricing reflects near-perfect expectations for future performance. “Priced for perfection” is the operative framing: when a stock or sector trades at multiples that already assume strong revenue growth, margin expansion, and favourable macro conditions, any shortfall in any one of those assumptions can trigger a sharp repricing.
The underpriced risk in the S&P 500 rally carries its own structural logic: with WTI crude near $100 per barrel embedding persistent cost pressure into corporate margins, and the S&P 500 having already hit its consensus year-end target in April, the same dynamic of elevated multiples meeting deteriorating macro conditions that Morningstar identifies in Australian banks is operating simultaneously in US equities.
Morningstar’s Wilkinson has identified that current pricing in both Australian banks and US equities leaves “little room for disappointment.”
The structural parallel is instructive. Both Australian banks and US tech function as concentration risks within their respective indices, though the mechanisms differ:
Australian investors with global equity exposure through exchange-traded funds (ETFs) or superannuation balanced options are simultaneously exposed to both overvaluation risks. Morningstar has identified certain global pockets as offering more attractive valuations, though the firm has not specified which regions or sectors in the available commentary.
The macro policy layer is reshaping relative returns in ways that are not immediately visible in index-level data. The RBA’s tightening cycle now sits in direct contrast to the US Federal Reserve’s anticipated hold, and that divergence is flowing through to currency markets.
March 2026 Consumer Price Index (CPI) data came in at 4.6% year-on-year, materially above the RBA’s 2-3% target band. Energy-led inflation tied to Strait of Hormuz supply disruptions has proven structurally persistent, and it is not the kind of price pressure that rate hikes can easily address. The RBA faces a scenario where it must keep tightening to anchor inflation expectations even as consumer stress builds under the weight of prior hikes.
The transmission mechanism from policy divergence to portfolio impact follows a logical sequence:
The AUD has also strengthened against the euro, pound, and yen. For Australian investors, a rising dollar reduces the AUD-denominated value of unhedged international equity holdings while providing relief on imported inflation. Exporters and ASX-listed multinationals with offshore revenue face compressed earnings when translated back into a stronger home currency. Resources stocks, priced globally in US dollars, are particularly exposed.
The case for and against bank exposure at current levels can be set out in direct terms:
The question for investors is one of margin of safety: at current multiples, how much bad news can bank stocks absorb before valuations reset? Morningstar’s assessment suggests the margin is thin. Palmer’s observation that buybacks are supporting EPS adds an important nuance: if the economy deteriorates, those same buybacks may increase balance sheet risk rather than reward shareholders.
Historical context sharpens the diversification question. Data shows 86.9% and 86.0% of Australian funds underperformed the S&P 500 over five- and ten-year periods ending prior to 2026. Morningstar’s broader identification of more attractively valued global pockets serves as an implicit prompt for investors to examine whether their domestic equity allocation is a deliberate choice or a passive default.
The structural shift away from ASX home bias is already measurable in flow data: international ETFs overtook domestic ETFs as the most purchased category on Selfwealth by Syfe in Q1 2026, with millennials allocating approximately 70% of their portfolios to ETFs and international funds capturing the strongest demand across every generational cohort, a pattern consistent with investors arriving independently at the same diversification conclusion Morningstar’s valuation warnings imply.
The SPIVA Australia Year-End 2025 scorecard records that more than 88% of global equity general funds underperformed their benchmark over five years and more than 95% over ten years, a pattern that reinforces the difficulty of generating alpha through active stock selection in an environment dominated by index-level concentration risk.
This article is for informational purposes only and should not be considered financial advice. Investors should conduct their own research and consult with financial professionals before making investment decisions.
The structural issue extends beyond any single stock call. Australian investors in ASX 200 index funds or diversified superannuation options with domestic equity bias are implicitly running a concentrated bet on four banks and their shared risk factors: consumer credit quality, the RBA rate path, net interest margins, and provision cycles. That is not diversification across the Australian economy. It is exposure to one sector’s earnings trajectory dressed in an index wrapper.
Morningstar’s overvaluation warning is therefore not directed solely at active stock-pickers. It applies to any investor whose domestic equity allocation is weighted toward the ASX 200. The Westpac provisions signal is the most recent concrete evidence that the credit cycle is turning, and it arrived while bank multiples remain at cycle highs.
The question for Australian equities in mid-2026 is not simply whether to buy or sell a bank stock. It is whether the risk profile of a domestic equity allocation is what investors assume it to be, or whether the index’s dependence on four names has quietly transformed a diversified holding into a sector bet.
Past performance does not guarantee future results. Financial projections are subject to market conditions and various risk factors.
The S&P/ASX 200 is up roughly 1.1% year-to-date as of April 2026, which masks a fragile rally driven almost entirely by the four major banks. Strip out those banks and the index's performance deteriorates significantly, making the outperformance relative to the S&P 500 and Nasdaq less reassuring than headline numbers suggest.
Morningstar's Associate Portfolio Manager Matt Wilkinson says current bank multiples, CBA trading at roughly 16.5 times earnings and 2.1 times book value, reflect little margin for earnings disappointment, meaning any shortfall in credit quality or net interest margins could trigger a sharp price correction.
Higher rates initially boost bank profitability by widening the net interest margin between lending income and deposit costs, but they also increase consumer and mortgage stress over time, which is already showing up in Westpac's April 2026 disclosure of higher loan loss provisions.
Morningstar identifies ANZ as having the most relative value among the four major banks, suggesting investors may consider reducing rather than exiting bank exposure entirely, while also reviewing whether their broader domestic equity allocation is a deliberate choice or a passive default driven by ASX index concentration.
A stronger AUD, which recovered to approximately $0.7113 against the USD by late April 2026, reduces the AUD-denominated value of unhedged international equity holdings, meaning investors in global ETFs or superannuation balanced options may see currency headwinds offset some of their offshore gains.