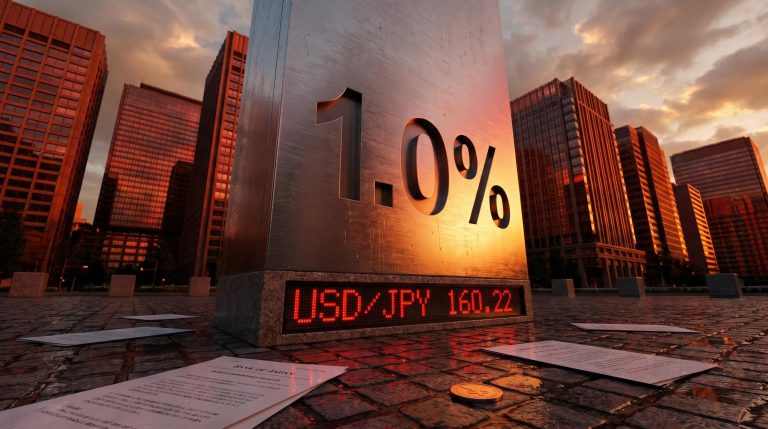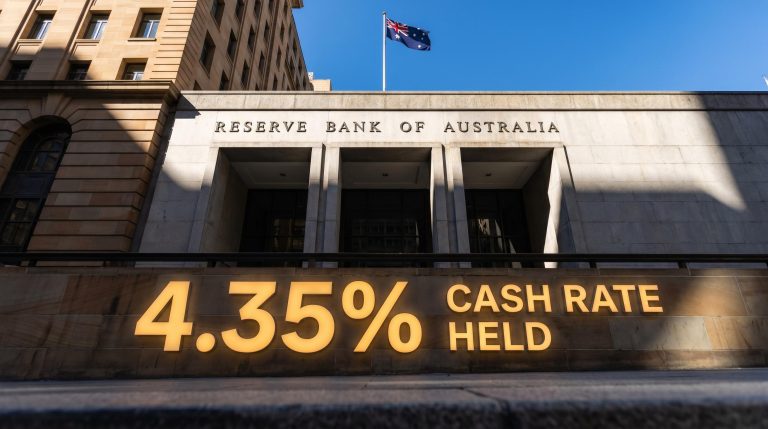
RBA Holds Cash Rate at 4.35% After Three Straight Hikes
4 hrs ago

Australian headline CPI hit 4.6% in the March 2026 quarter, the highest reading in nearly three years. The RBA cash rate sits at 4.10% following two consecutive hikes earlier this year. For retail investors holding Australian equities, bonds, or cash, this combination poses a question that demands more than a headline reaction: how should a portfolio actually respond when inflation is persistent, the central bank is tightening, and the causes of rising prices are pulling in multiple directions at once?
Inflation is not a single phenomenon. It has distinct causes, distinct central bank responses, and distinct winners and losers across asset classes. The current episode, shaped by sticky domestic price pressures compounding with an Iran-related oil shock, makes this distinction particularly urgent. Understanding the mechanics, not just the monthly CPI number, is what separates investors who position well from those who react too late or too broadly.
This guide explains how inflation works from first principles, how the RBA uses interest rates to respond, what history reveals about the range of possible outcomes, and which specific strategies and ASX-listed instruments are worth considering in 2026.
Grocery bills are higher. Fuel costs more. Insurance premiums have climbed. The lived experience of inflation is immediate and personal, but that experience can mislead. A single price rising in a single category is not inflation. Inflation is the erosion of purchasing power across an entire economy, where the same dollar buys less of nearly everything over time.
The mistake most investors make is treating inflation as one thing. It is not. The causes differ, and the investment implications differ with them.
Three primary types drive inflation:
Most advanced economies target approximately 2% annual inflation as a baseline, a rate considered low enough to preserve purchasing power while allowing enough price flexibility for the economy to function.
IMF research indicates that each additional percentage point of inflation beyond 3% in a developed economy is associated with a 0.1-0.2% reduction in real GDP growth, a drag that compounds over time and erodes returns across asset classes.
The 1970s oil crisis remains the defining cost-push episode, when OPEC supply restrictions drove prices across the global economy higher regardless of domestic demand conditions. The 2022 Ukraine conflict produced a more recent parallel. The current Australian episode combines elements of both demand-pull and cost-push inflation, and that distinction matters for what comes next.
There is a point where inflation stops being a response to external conditions and starts generating itself. Workers, observing rising prices, seek higher wages to maintain their purchasing power. Employers, facing higher labour costs, pass those costs through to consumers. Consumers, facing higher prices, demand still higher wages. The loop becomes self-reinforcing.
Once inflation expectations become unanchored, as occurred through much of the 1970s, a second wave of inflation becomes nearly unavoidable without severe policy intervention. This is precisely why the RBA is focused on acting before expectations de-anchor, not after. The cost of waiting is measured in years of pain, not months.
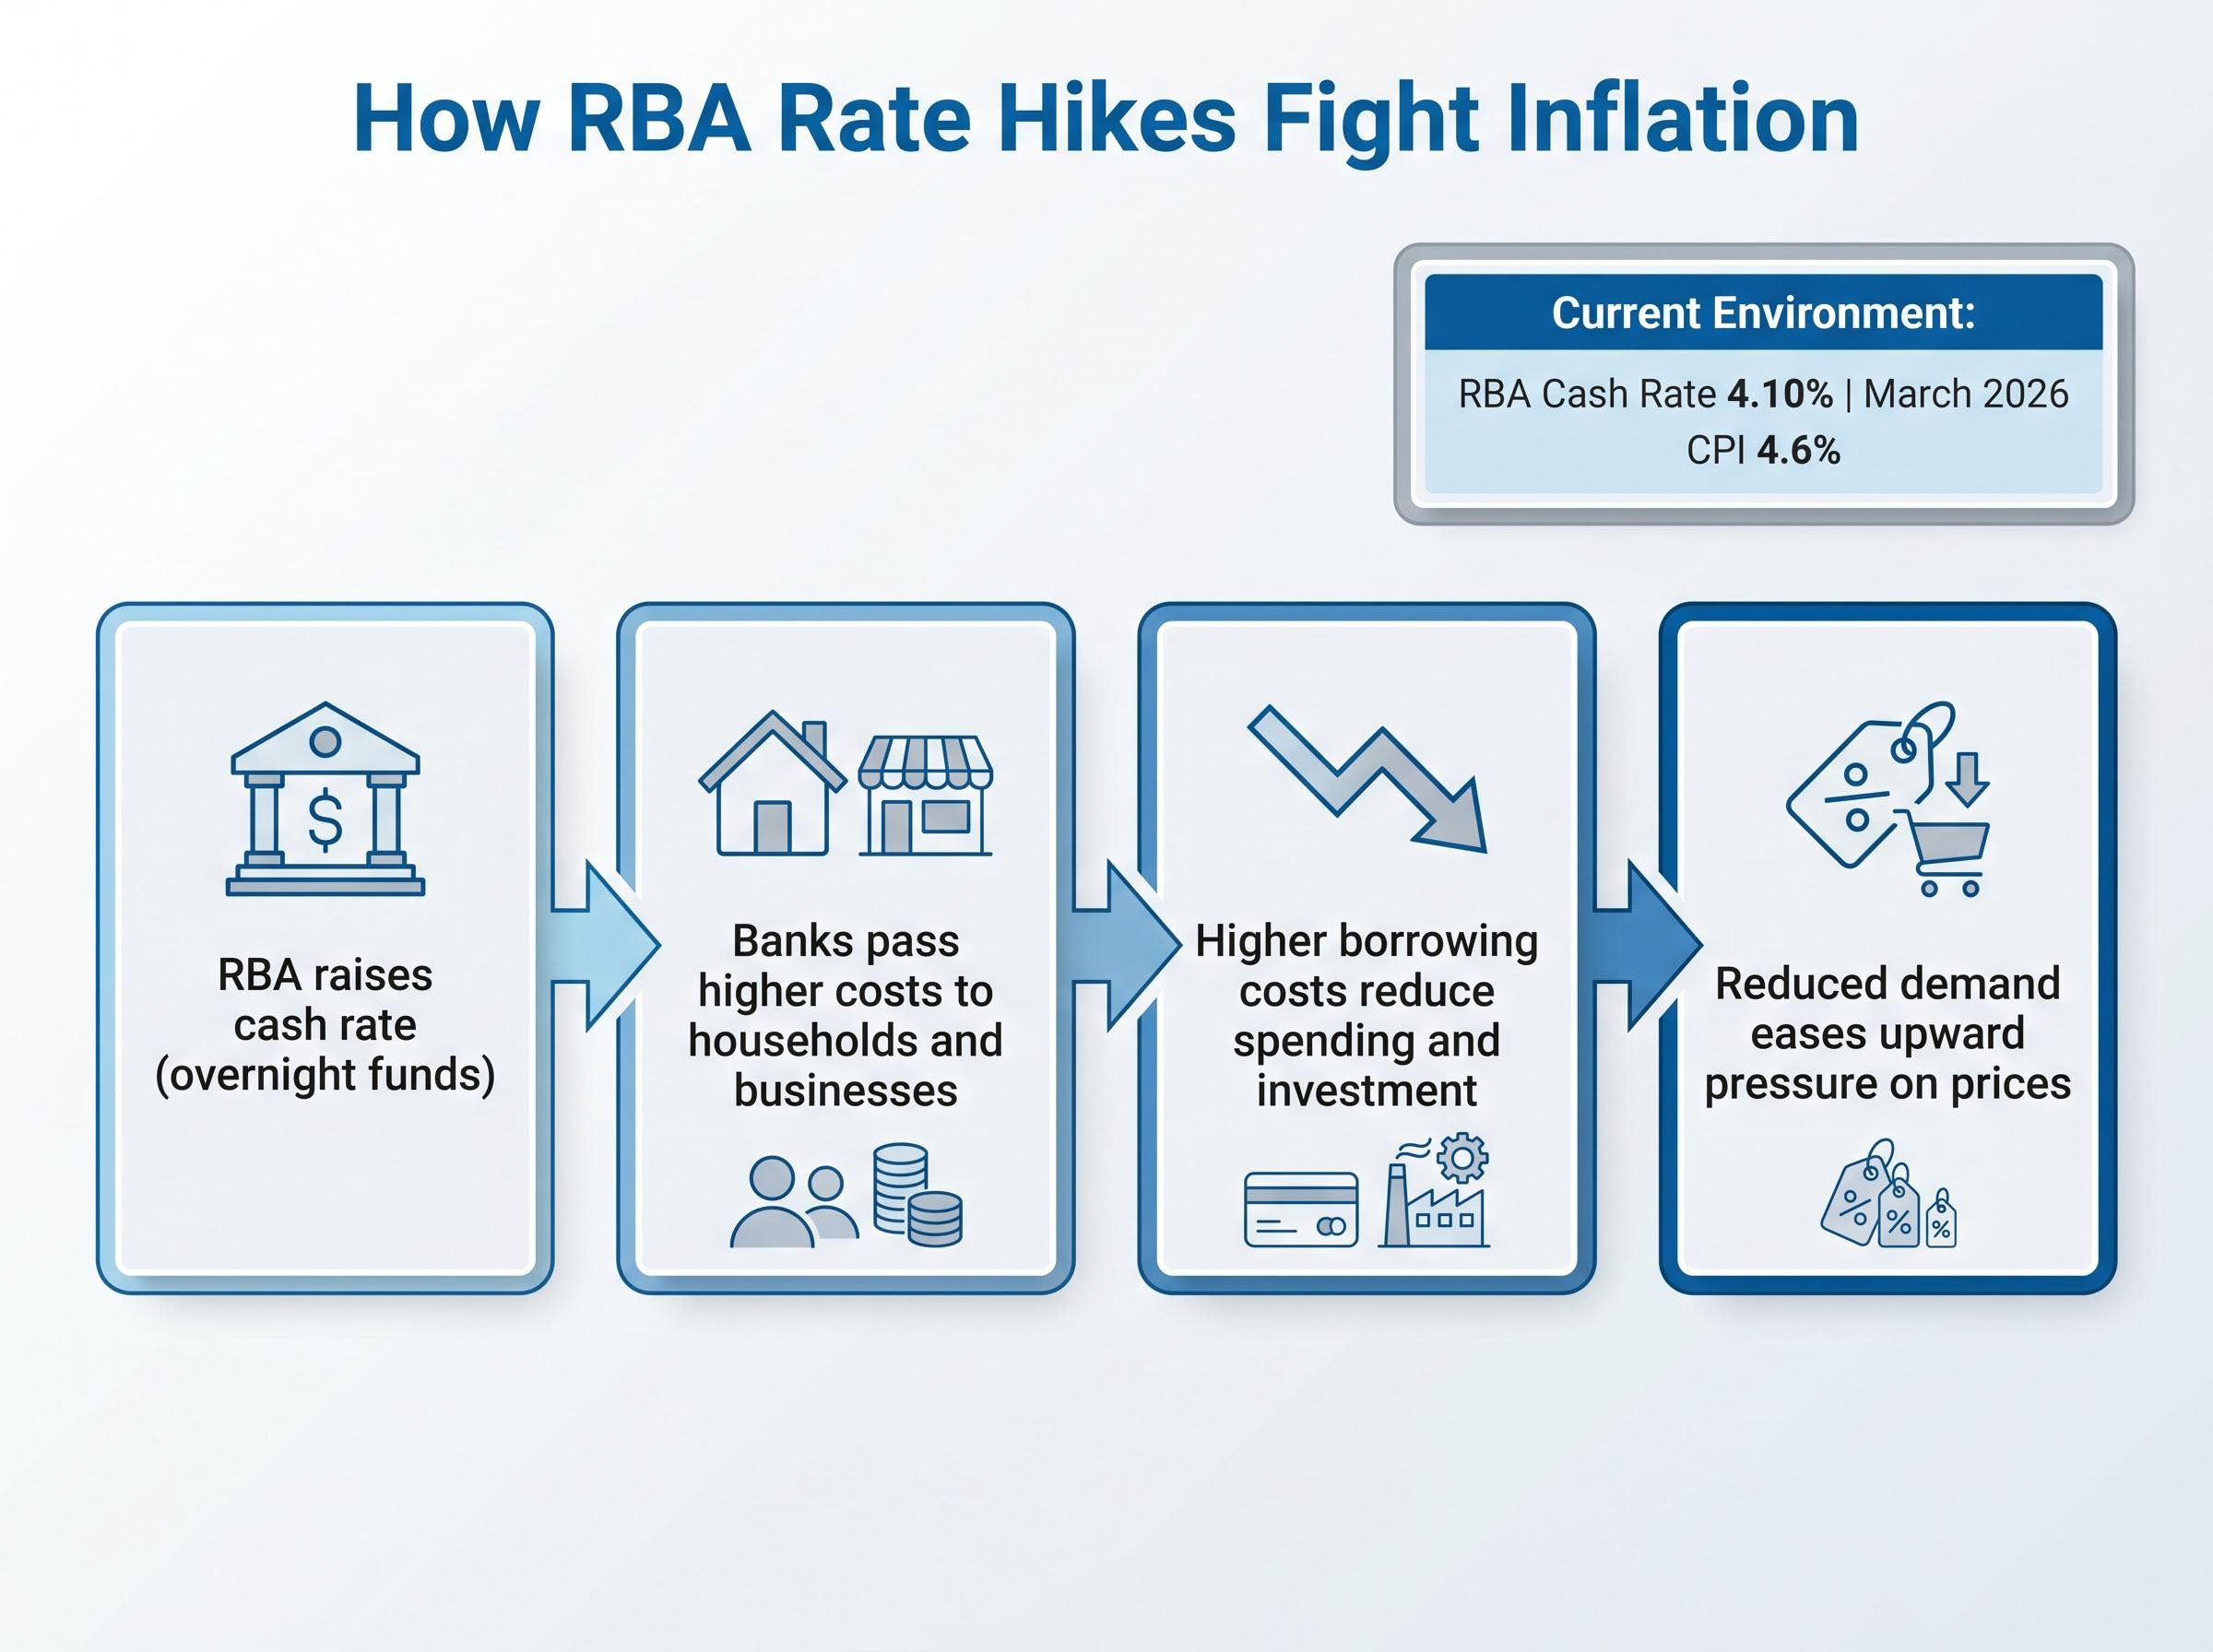
The RBA cash rate is the benchmark for the cost of money in the Australian financial system. When the RBA raises it, the effect does not stop at the central bank’s balance sheet. It transmits outward through a chain that ultimately reaches consumer prices.
The transmission works in four steps:
A practical heuristic, known as the Taylor Rule, suggests central banks must raise rates by approximately 1.5 percentage points for every 1 percentage point inflation exceeds target to genuinely tighten financial conditions. Below that threshold, rate increases may slow inflation’s acceleration without actually reversing it.
The RBA’s recent actions reflect this logic. The table below shows the current tightening sequence:
| Decision Date | Previous Rate | New Rate | Primary Stated Reason |
|---|---|---|---|
| Late 2025 (base) | N/A | 3.60% | Prevailing rate ahead of inflation resurgence |
| 3 February 2026 | 3.60% | 3.85% | Sticky underlying inflation exceeding the 2-3% target; insufficient financial conditions |
| 17 March 2026 | 3.85% | 4.10% | Continued inflation pressure; upward revision to CPI forecasts |
The RBA projects headline CPI to peak at 4.2% by mid-2026, with underlying trimmed mean inflation peaking at 3.7% before easing. Markets are pricing in at least two additional hikes in 2026. Governor Michele Bullock confirmed there is no predetermined rate path, with ongoing monitoring of both price stability and full employment.
The RBA February 2026 Statement on Monetary Policy provided official forecasts for underlying inflation peaking at 3.7% in mid-2026 and remaining above the 2-3% target band through early 2027, giving markets and investors a defined timeline against which to calibrate portfolio positioning.
For Australian mortgage holders and equity investors, these decisions are not abstract. Every 25 basis point increase transmits directly to variable mortgage repayments, business borrowing costs, and ultimately corporate earnings. Understanding the chain helps investors anticipate how rate changes shape asset prices in real time.
Every tightening cycle ends one of two ways. Either the central bank succeeds in cooling inflation without triggering a deep recession (a soft landing), or the medicine proves more damaging than the disease (a hard landing). The distinction is not academic. It determines whether equity valuations compress temporarily or collapse, whether credit conditions tighten moderately or seize, and whether the elevated rate environment lasts quarters or years.
The definitive hard landing case study is the US Federal Reserve’s tightening cycle of 1980-1982. Inflation had reached approximately 14%, and Fed Chair Paul Volcker raised rates aggressively enough to bring it down to approximately 3%. The cost was severe: unemployment exceeded 10%, the economy entered a deep recession, and equity markets suffered prolonged drawdowns. Inflation was defeated, but the collateral damage was measured in millions of jobs and years of economic output.
The 1990s produced the rarer outcome. Supply gradually caught up with demand, inflation eased without a deep contraction, and the economy continued expanding. The conditions that enabled that outcome, namely productivity growth, moderate energy prices, and anchored inflation expectations, are not guaranteed to recur.
| Period | Peak Inflation | Peak Unemployment | Rate Reversal Timeline |
|---|---|---|---|
| 1980-1982 (Hard Landing) | ~14% | >10% | Rates held high for approximately 2 years |
| 1990s (Soft Landing) | ~5-6% | ~5-6% | Gradual easing over 12-18 months |
Historical patterns show that rate reversals following supply-driven oil shocks have typically occurred within a six to twelve month window once the supply disruption eases.
The RBA rate hike cycle peak is also the moment when bond duration goes from being a liability to an asset; investors who have been accumulating short-duration instruments in anticipation of that pivot will face a decision about whether to extend duration before the market fully prices in the eventual easing, a timing question with significant total-return implications for fixed income allocations.
Oil futures markets are currently in backwardation, meaning near-term contracts are priced above longer-dated ones. This structure signals that markets view the current disruption as temporary rather than permanent, a reading that, if correct, could shorten the timeline to eventual rate relief.
For Australian investors, the question is not which archetype will replay exactly. It is whether the current conditions are closer to one than the other, and the honest answer, as the next section explores, is that the 2026 Australian episode does not map cleanly onto either.
The difficulty facing Australian investors in 2026 is not that inflation is high. It is that two distinct inflation forces are operating simultaneously, and they call for different responses.
On the domestic side, underlying inflation has remained stubbornly above the RBA’s 2-3% target band. Tight labour markets and persistent services price growth are driving trimmed mean inflation that the RBA forecasts will reach 4.2% by Q1 2027. This is demand-side pressure that monetary tightening is designed to address directly.
Layered on top is the Iran-related oil shock, a cost-push force that operates through supply disruption rather than excess demand. In a purely transitory supply shock, a central bank can justify looking through headline inflation, holding rates steady while the temporary pressure dissipates. The problem is that when sticky domestic inflation is already running above target, the RBA cannot afford that patience. March 2026 headline CPI of 4.6% reflects both forces at once, and disentangling them is precisely the analytical challenge the RBA board faces at every meeting.
The ABS March 2026 CPI release confirmed headline inflation at 4.6% annually, with trimmed mean inflation running at 3.3%, providing the primary data underpinning the RBA’s decision to continue tightening through the first half of the year.
RBA projections indicate above-target inflation through at least early 2027. The low inflation environment of the 2010s appears unlikely to return; 2% may function as a floor rather than a ceiling for the foreseeable future.
The inflationary picture is not entirely one-directional. Several counterforces are operating globally that could ease pressure over the medium term:
These are genuine counterweights, not reasons to dismiss the inflation risk. The question for investors is whether these forces materialise quickly enough to shorten the RBA’s tightening cycle, or whether domestic persistence keeps rates elevated regardless.
Structural deflationary forces operating at a global level, including AI-driven productivity gains across services sectors, the redirection of Chinese manufactured goods into non-US markets, and a gradual unwinding of US rental inflation, are genuine counterweights to the domestic price pressures the RBA is fighting; the question is whether they materialise quickly enough to shorten the tightening cycle before growth damage becomes the more pressing concern.
The analytical groundwork leads to a practical question: what does a portfolio built for persistent inflation actually look like?
The core logic rests on three principles. First, favour cash and short-duration instruments that benefit directly from higher rates rather than suffering from them. Second, maintain global diversification through quality equity exposure where companies have pricing power to protect margins. Third, treat falling bond prices not as a reason to abandon fixed income entirely, but as a future income opportunity; bonds purchased at higher yields lock in better returns for the duration they are held.
Traditional defensive assets, including bonds and gold, have not performed their typical protective function in the current environment. Reflexive rotation into “safe havens” without examining current conditions can compound losses rather than reduce them.
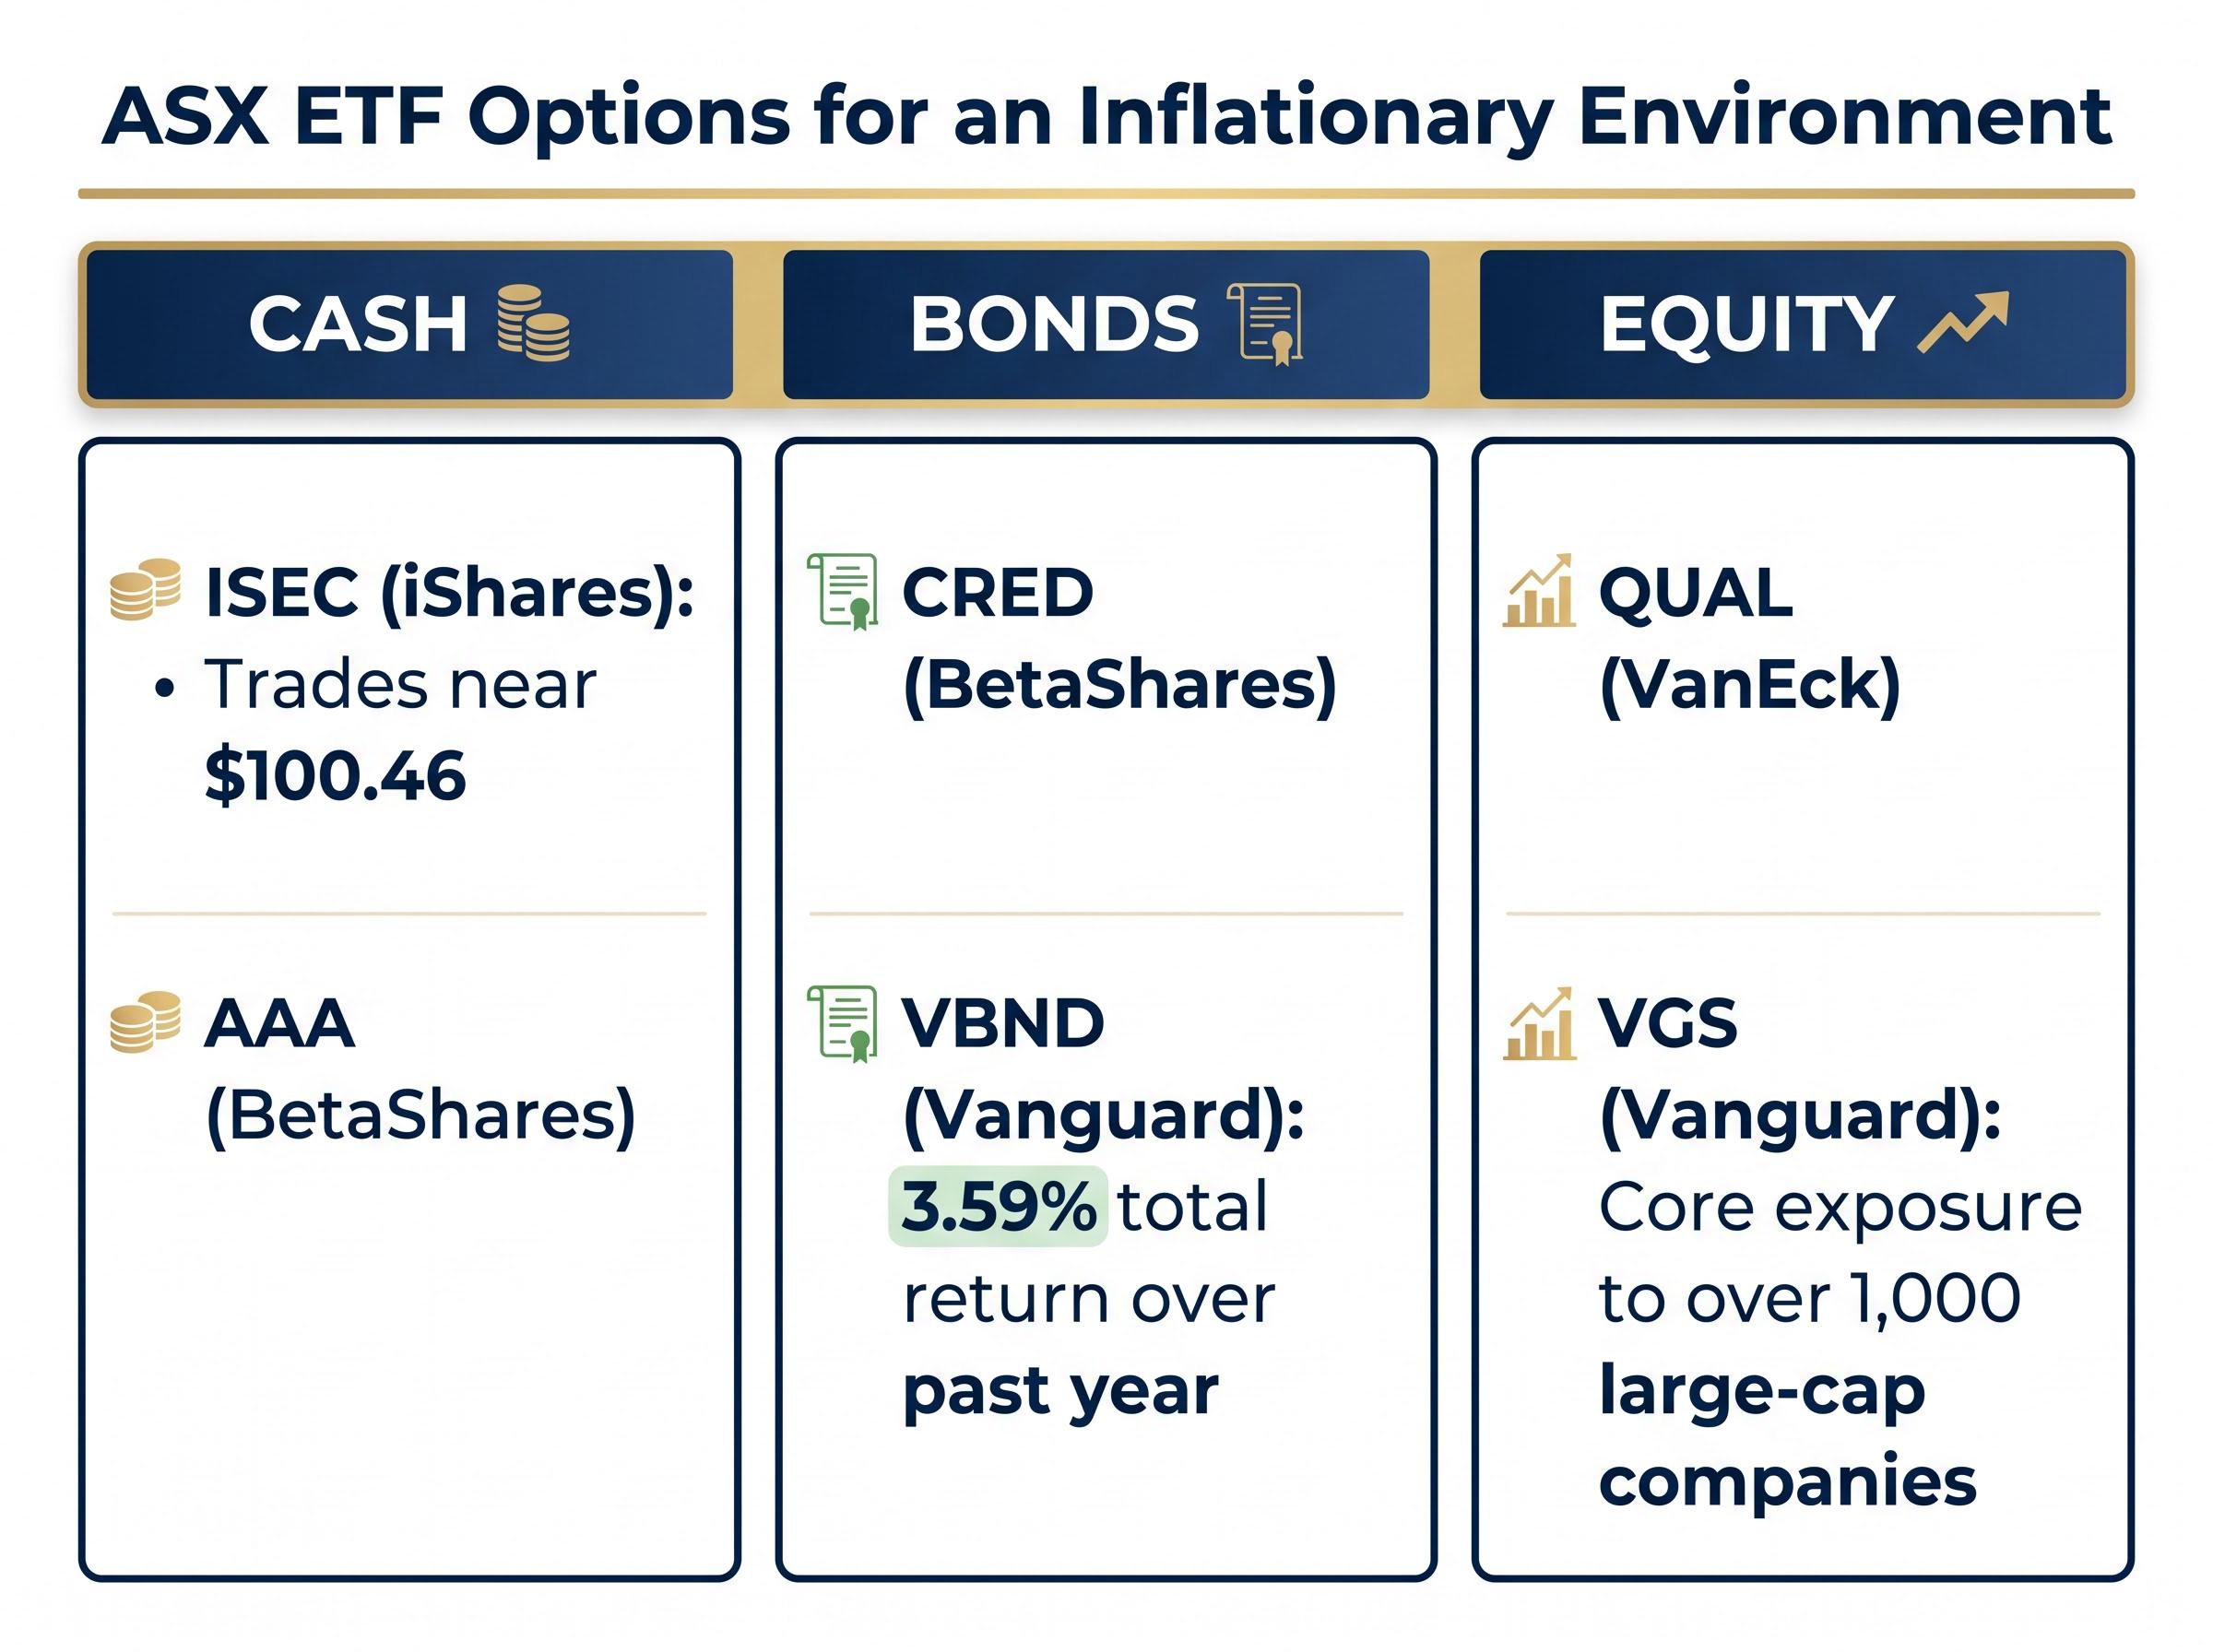
The table below outlines six ASX-listed ETFs spanning cash, bond, and equity categories, each with a specific rationale for the current inflation environment:
| Ticker | Issuer | Category | Inflation-Environment Rationale |
|---|---|---|---|
| ISEC | iShares | Cash | Trades near $100.46; tracks short-term rates, benefiting directly from higher cash rate |
| AAA | BetaShares | Cash | Holds funds in Australian dollar bank deposits; targets income and capital preservation |
| CRED | BetaShares | Bonds | Senior fixed-rate bonds from high-quality Australian issuers; potentially better positioned as rates approach peak |
| VBND | Vanguard | Bonds | Global aggregate bond exposure (hedged); total return of 3.59% over the past year including dividends |
| QUAL | VanEck | Equity | Focuses on companies with pricing power, high profitability, and low leverage; supports inflation resilience |
| VGS | Vanguard | Equity | Core exposure to over 1,000 large-cap developed market companies; broad global diversification |
Dollar cost averaging complements these holdings by removing the temptation to time the rate peak. The approach works in four steps:
Translating macroeconomic analysis into specific, ASX-listed instruments gives retail investors a concrete starting point. These are not recommendations; they are categories to evaluate against individual circumstances, risk tolerance, and time horizon.
Pricing power screening, which evaluates companies on return on equity, debt-to-equity ratios, and demonstrated ability to pass input cost increases through to end customers, offers a more granular lens for identifying which equity holdings are likely to hold margins through the current cycle rather than simply tracking broad market exposure.
This article is for informational purposes only and should not be considered financial advice. Investors should conduct their own research and consult with financial professionals before making investment decisions.
The difference between investors who finish a tightening cycle ahead and those who finish behind is rarely about picking the right asset at the right moment. It is about structure.
Reactive behaviour during inflationary periods follows a predictable pattern. Investors sell equities after a sharp drawdown, abandon fixed income when bond prices fall, or hold cash indefinitely while waiting for a rate peak that is only visible in hindsight. Each of these actions locks in losses or sacrifices the recovery that follows.
Structured responses look different:
Preserving a cash allocation serves a specific purpose: it enables selective capital deployment when high-conviction opportunities arise, without forcing asset sales at depressed prices. This is not passive acceptance. It is a deliberate structural choice.
The Selfwealth Auto-Invest feature allows investors to schedule automated purchases at weekly, fortnightly, or monthly intervals. The tool executes market orders automatically, with users retaining full ability to review, pause, or modify their schedule via the Portfolio or Orders tab.
Automation removes emotional decision-making from execution. The decision about what to invest in and how much to invest remains the investor’s. The decision about whether to follow through on that plan, on a day when headlines are alarming, is handled by the system.
Automated dollar-cost averaging removes the single most costly decision point in volatile markets, the moment where a headline triggers a manual override of a previously agreed plan, by shifting execution from a discretionary act requiring fresh resolve each period to a scheduled process that continues regardless of whether that week’s CPI print was alarming.
Past performance does not guarantee future results. Financial projections are subject to market conditions and various risk factors. Readers should seek guidance from a financial adviser or accountant for personalised recommendations.
The RBA’s tightening cycle will eventually turn. Every cycle in modern monetary history has. The question is not whether, but when, and whether an investor’s portfolio is structured to capture the recovery or still absorbing the damage of reactive decisions made during the difficult period.
Three moves anchor a portfolio built for persistence. Position for the current rate environment by favouring cash instruments like ISEC and AAA, and quality equity exposure through QUAL, where pricing power offers a degree of inflation protection. Maintain diversification through broad global instruments like VGS and hedged bond exposure through VBND and CRED, which become more attractive as rates approach their eventual peak. Automate discipline using tools like the Selfwealth Auto-Invest feature to ensure contributions continue through volatile months without requiring a fresh decision each time.
Understanding inflation mechanics and central bank responses is not an academic exercise for Australian retail investors. It is the foundation of every allocation decision made in 2026 and beyond. The investors who have maintained a structured, diversified position through the difficult period will be best placed to act when conditions shift.
Explore the Selfwealth platform and the Auto-Invest feature as a starting point for implementing a disciplined investment schedule suited to the current environment.
Investing during inflation means adjusting your portfolio to favour assets that benefit from or are resilient to rising prices, such as short-duration cash instruments, quality equities with pricing power, and diversified global equity ETFs, rather than holding assets whose real value erodes as prices climb.
ASX-listed ETFs such as ISEC and AAA offer direct exposure to higher cash rates, while QUAL targets companies with pricing power, and VGS provides broad global equity diversification; CRED and VBND offer bond exposure that becomes more attractive as rates approach their peak.
The RBA raises the cash rate, which increases borrowing costs for banks, households, and businesses, reducing spending and investment, and gradually easing upward pressure on prices; a practical rule suggests rates must rise by roughly 1.5 percentage points for every 1 percentage point inflation exceeds target.
Demand-pull inflation occurs when spending outpaces the supply of goods and services, while cost-push inflation is driven by rising input costs such as energy due to supply disruptions or geopolitical shocks; the current Australian episode involves both forces simultaneously, complicating the RBA's policy response.
Dollar cost averaging involves investing a fixed amount at regular intervals regardless of market conditions, which removes the temptation to time a rate peak, reduces the impact of short-term volatility, and can be automated through tools like the Selfwealth Auto-Invest feature to ensure consistency.