
Glanbia Surges 9% After Q1 Volumes Triple Analyst Forecasts
5 hrs ago
Glanbia PLC shares surged approximately 15% on 29 April 2026, marking the largest single-day move in recent months on volume more than three times the daily average. The reaction was not to a marginal beat. Glanbia’s Q1 2026 results roughly doubled analyst consensus on two headline metrics, volume growth and like-for-like revenue, delivering the kind of surprise that forces a reassessment of forward expectations rather than a minor model adjustment. Released alongside a formal webcast and investor presentation, the numbers reframe the conversation around what Glanbia’s growth engine is capable of. This piece breaks down the specific figures, the segment-level outperformance driving them, the guidance revision that followed, and the one late-year variable that could test whether the momentum holds.
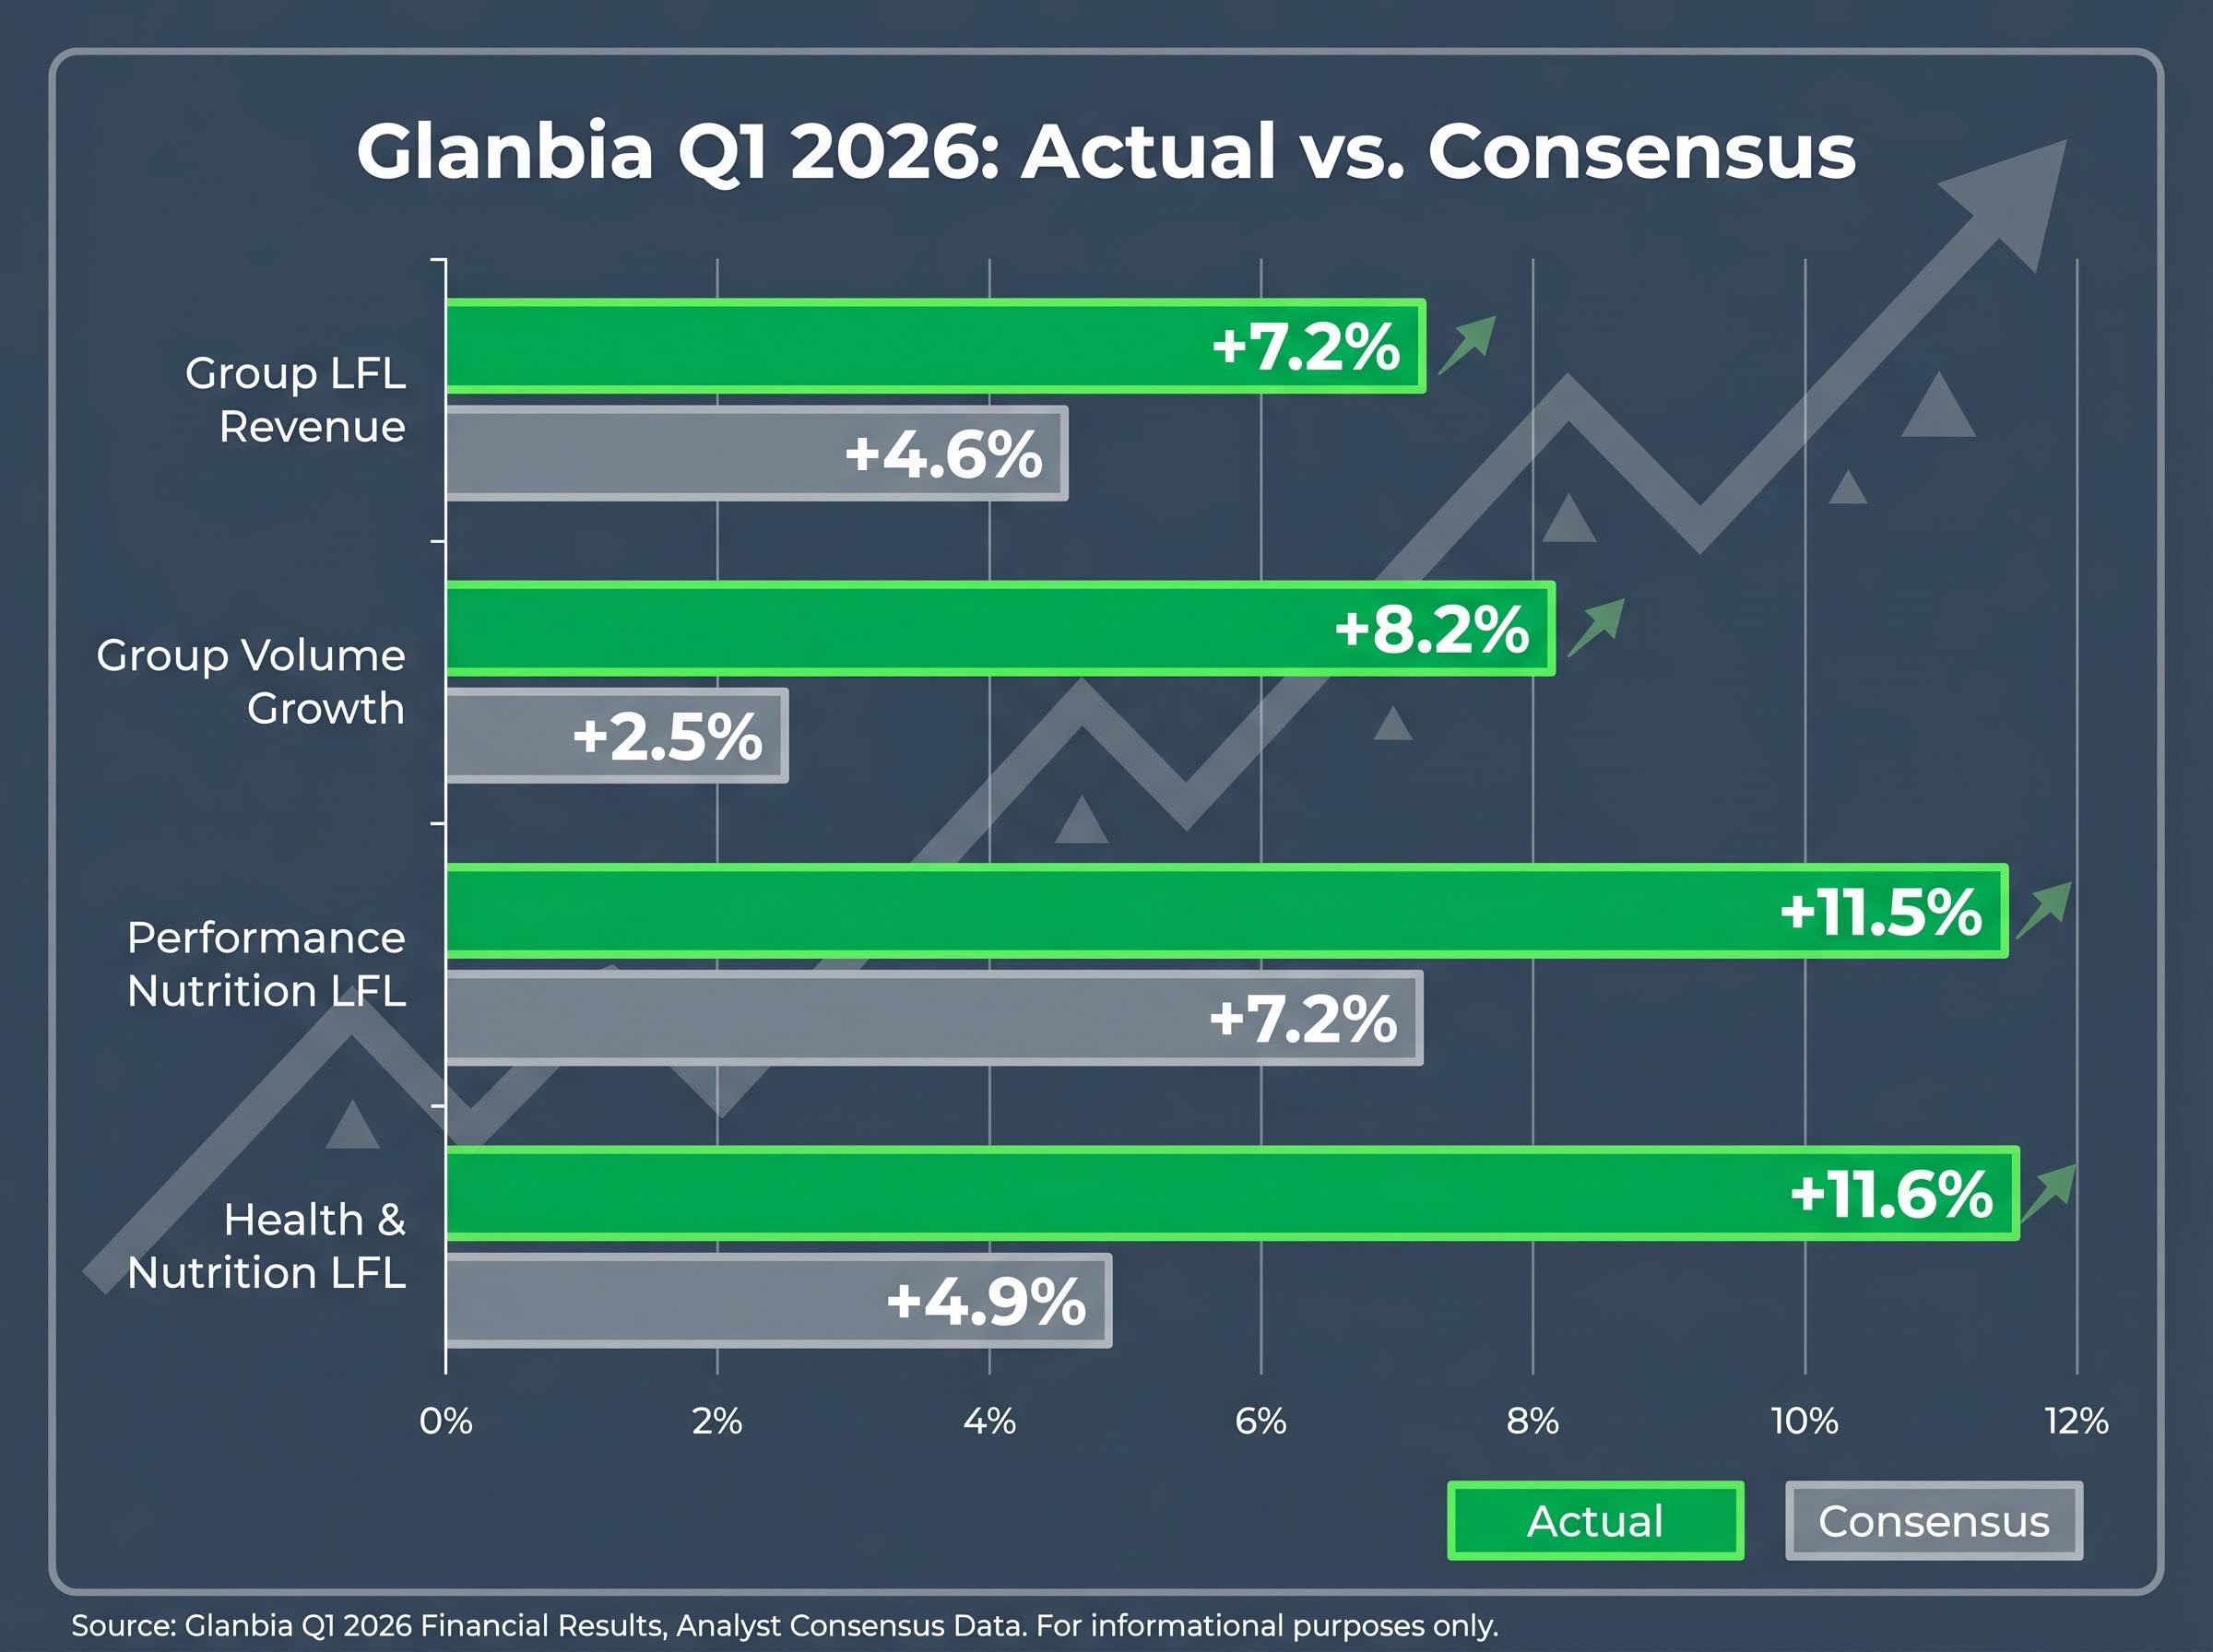
The gap between what analysts expected and what Glanbia delivered is the story. Group like-for-like revenue growth came in at +7.2%, against a consensus estimate of 4.6%. That alone would have been a strong quarter. The volume number made it exceptional.
Volume growth of +8.2% more than tripled the 2.5% consensus estimate. Price, meanwhile, was marginally negative at -1.0%, meaning the entire outperformance came from genuine demand expansion rather than inflation-driven revenue. When a consumer staples company beats on volume at this scale while price is flat to negative, the market reads it as structural demand, not a pricing artefact.
Shares closed up approximately 15% on 29 April 2026, with 813,456 shares changing hands, approximately 3.2x the daily average of 257,735.
CEO Hugh McGuire stated: “Glanbia delivered a strong performance in the first quarter, with Group like-for-like revenue growth of 7.2% across our portfolio… with volume growth in all three segments, benefitting from accelerating category growth and good end-use market demand.”
The group-level numbers are striking. The segment breakdown reveals where the demand is concentrated, and how wide the consensus misses were.
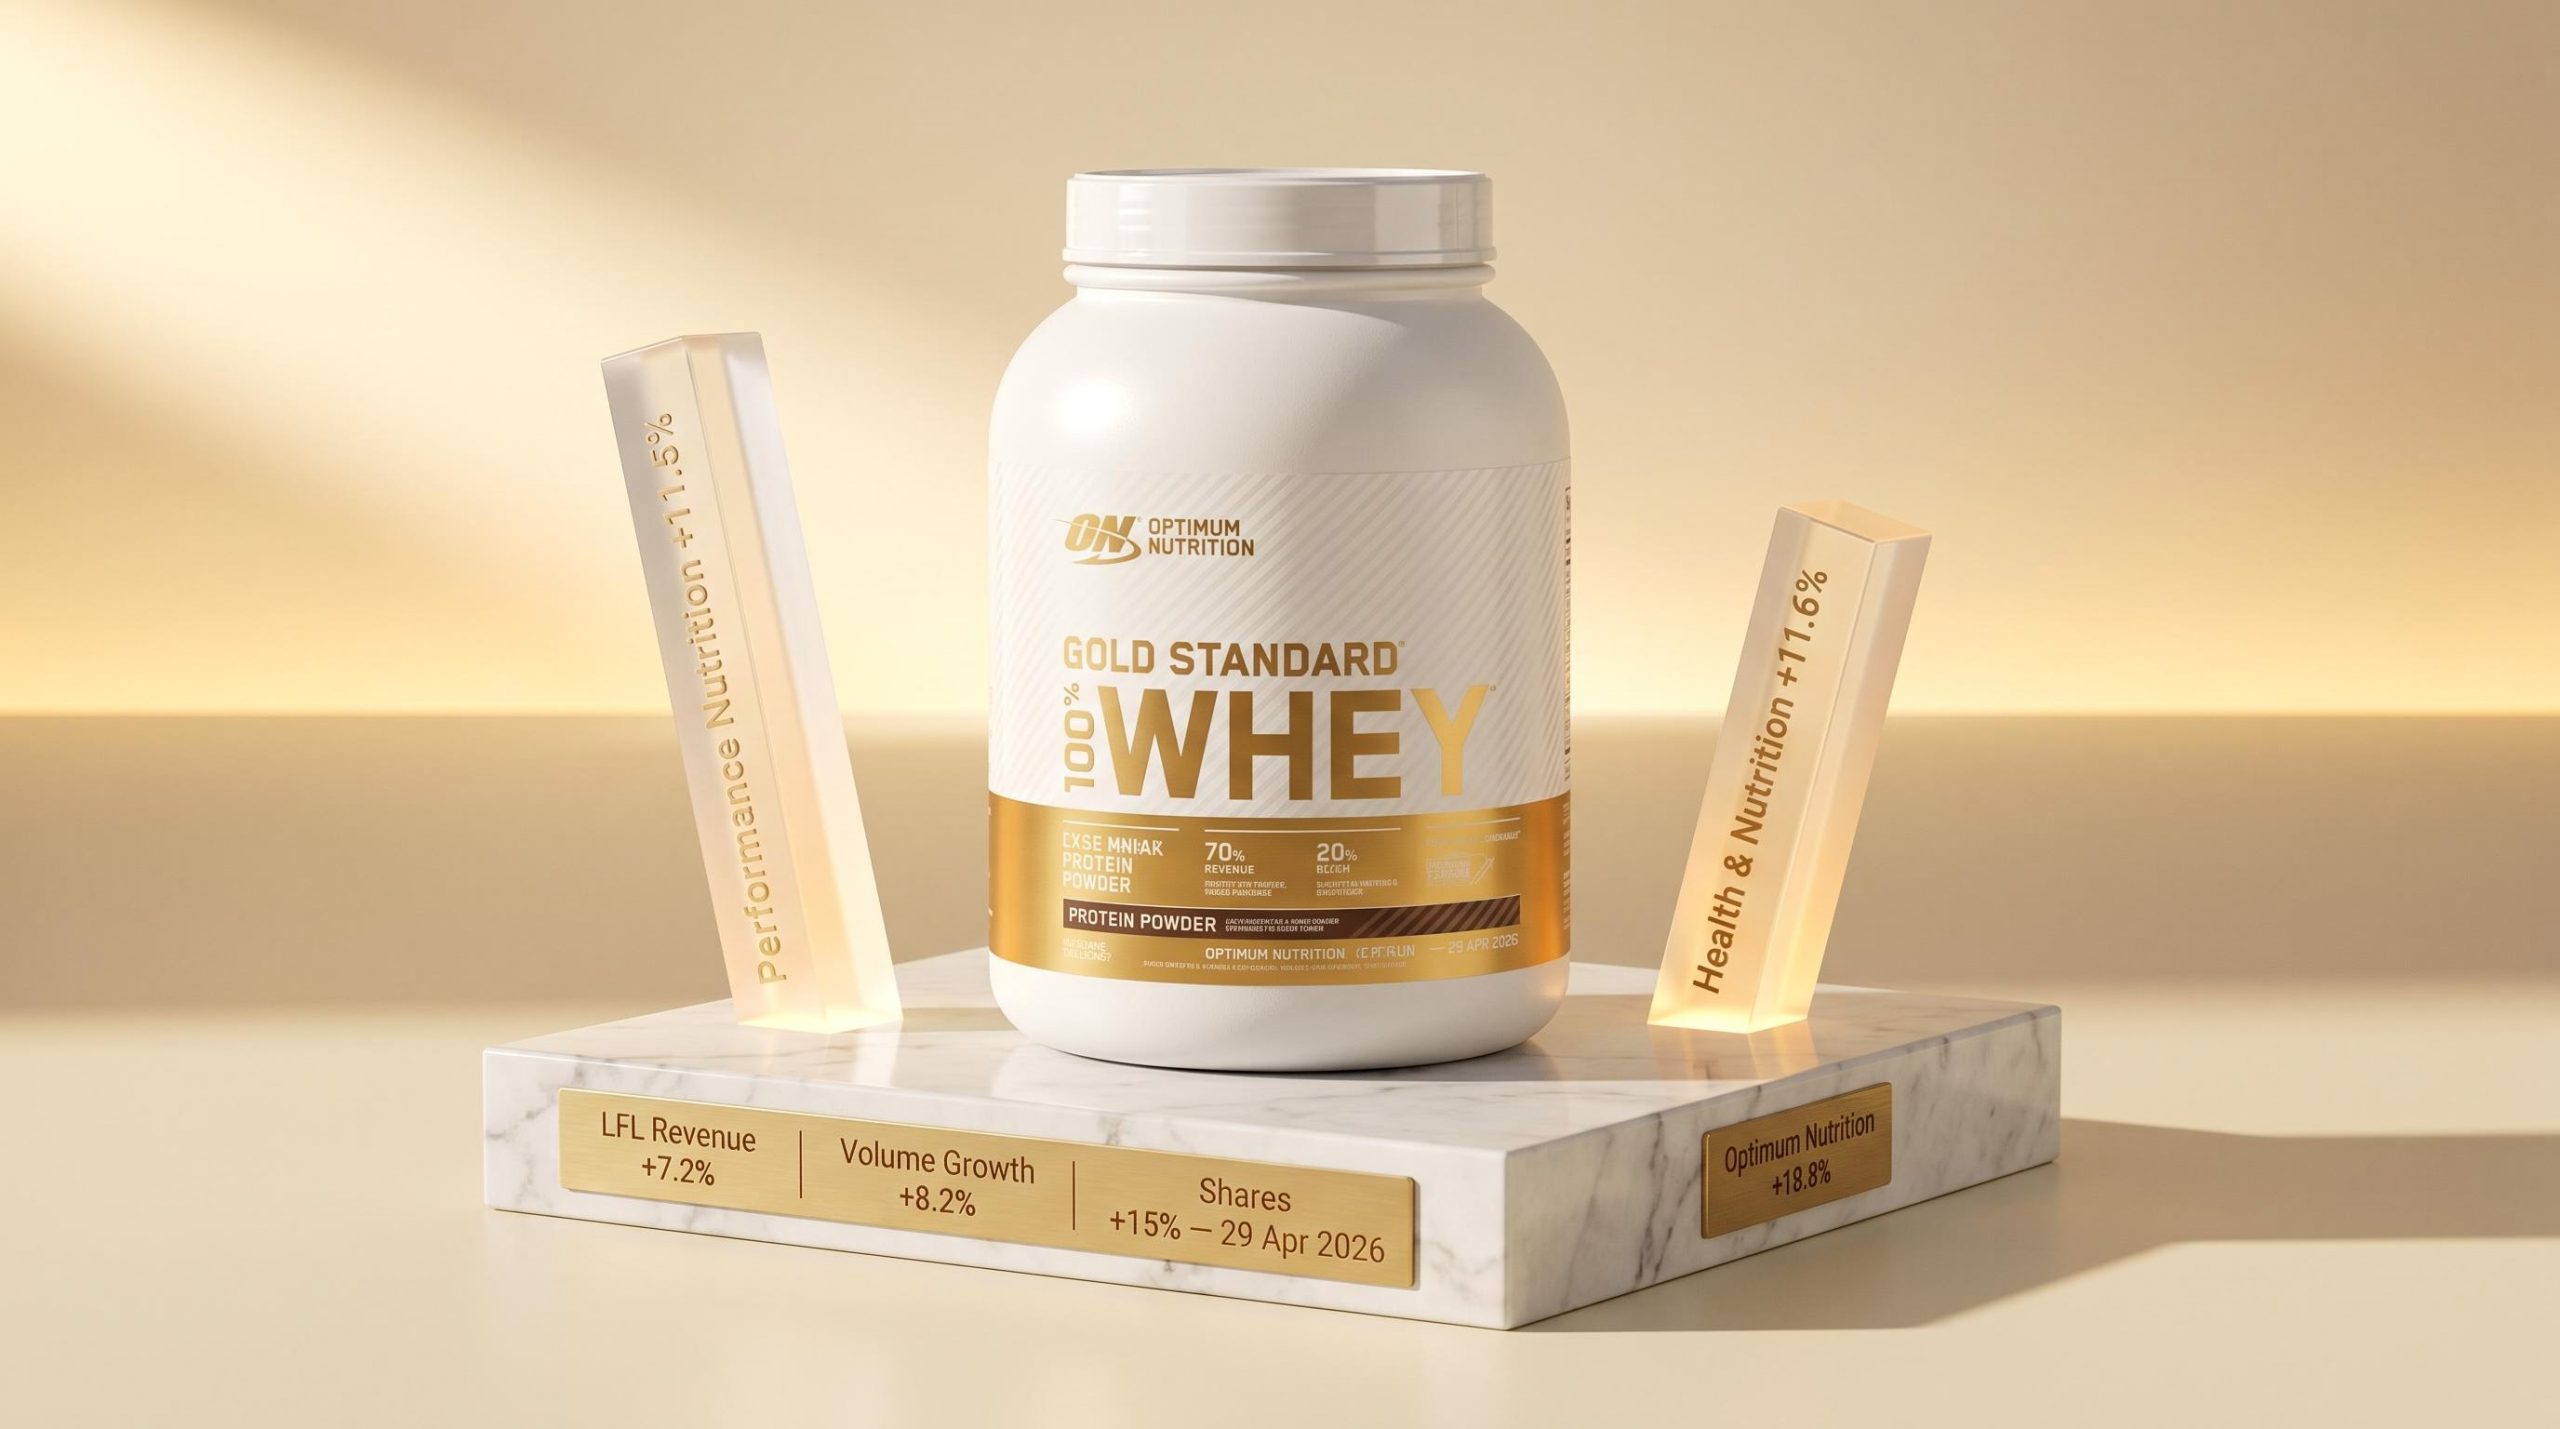
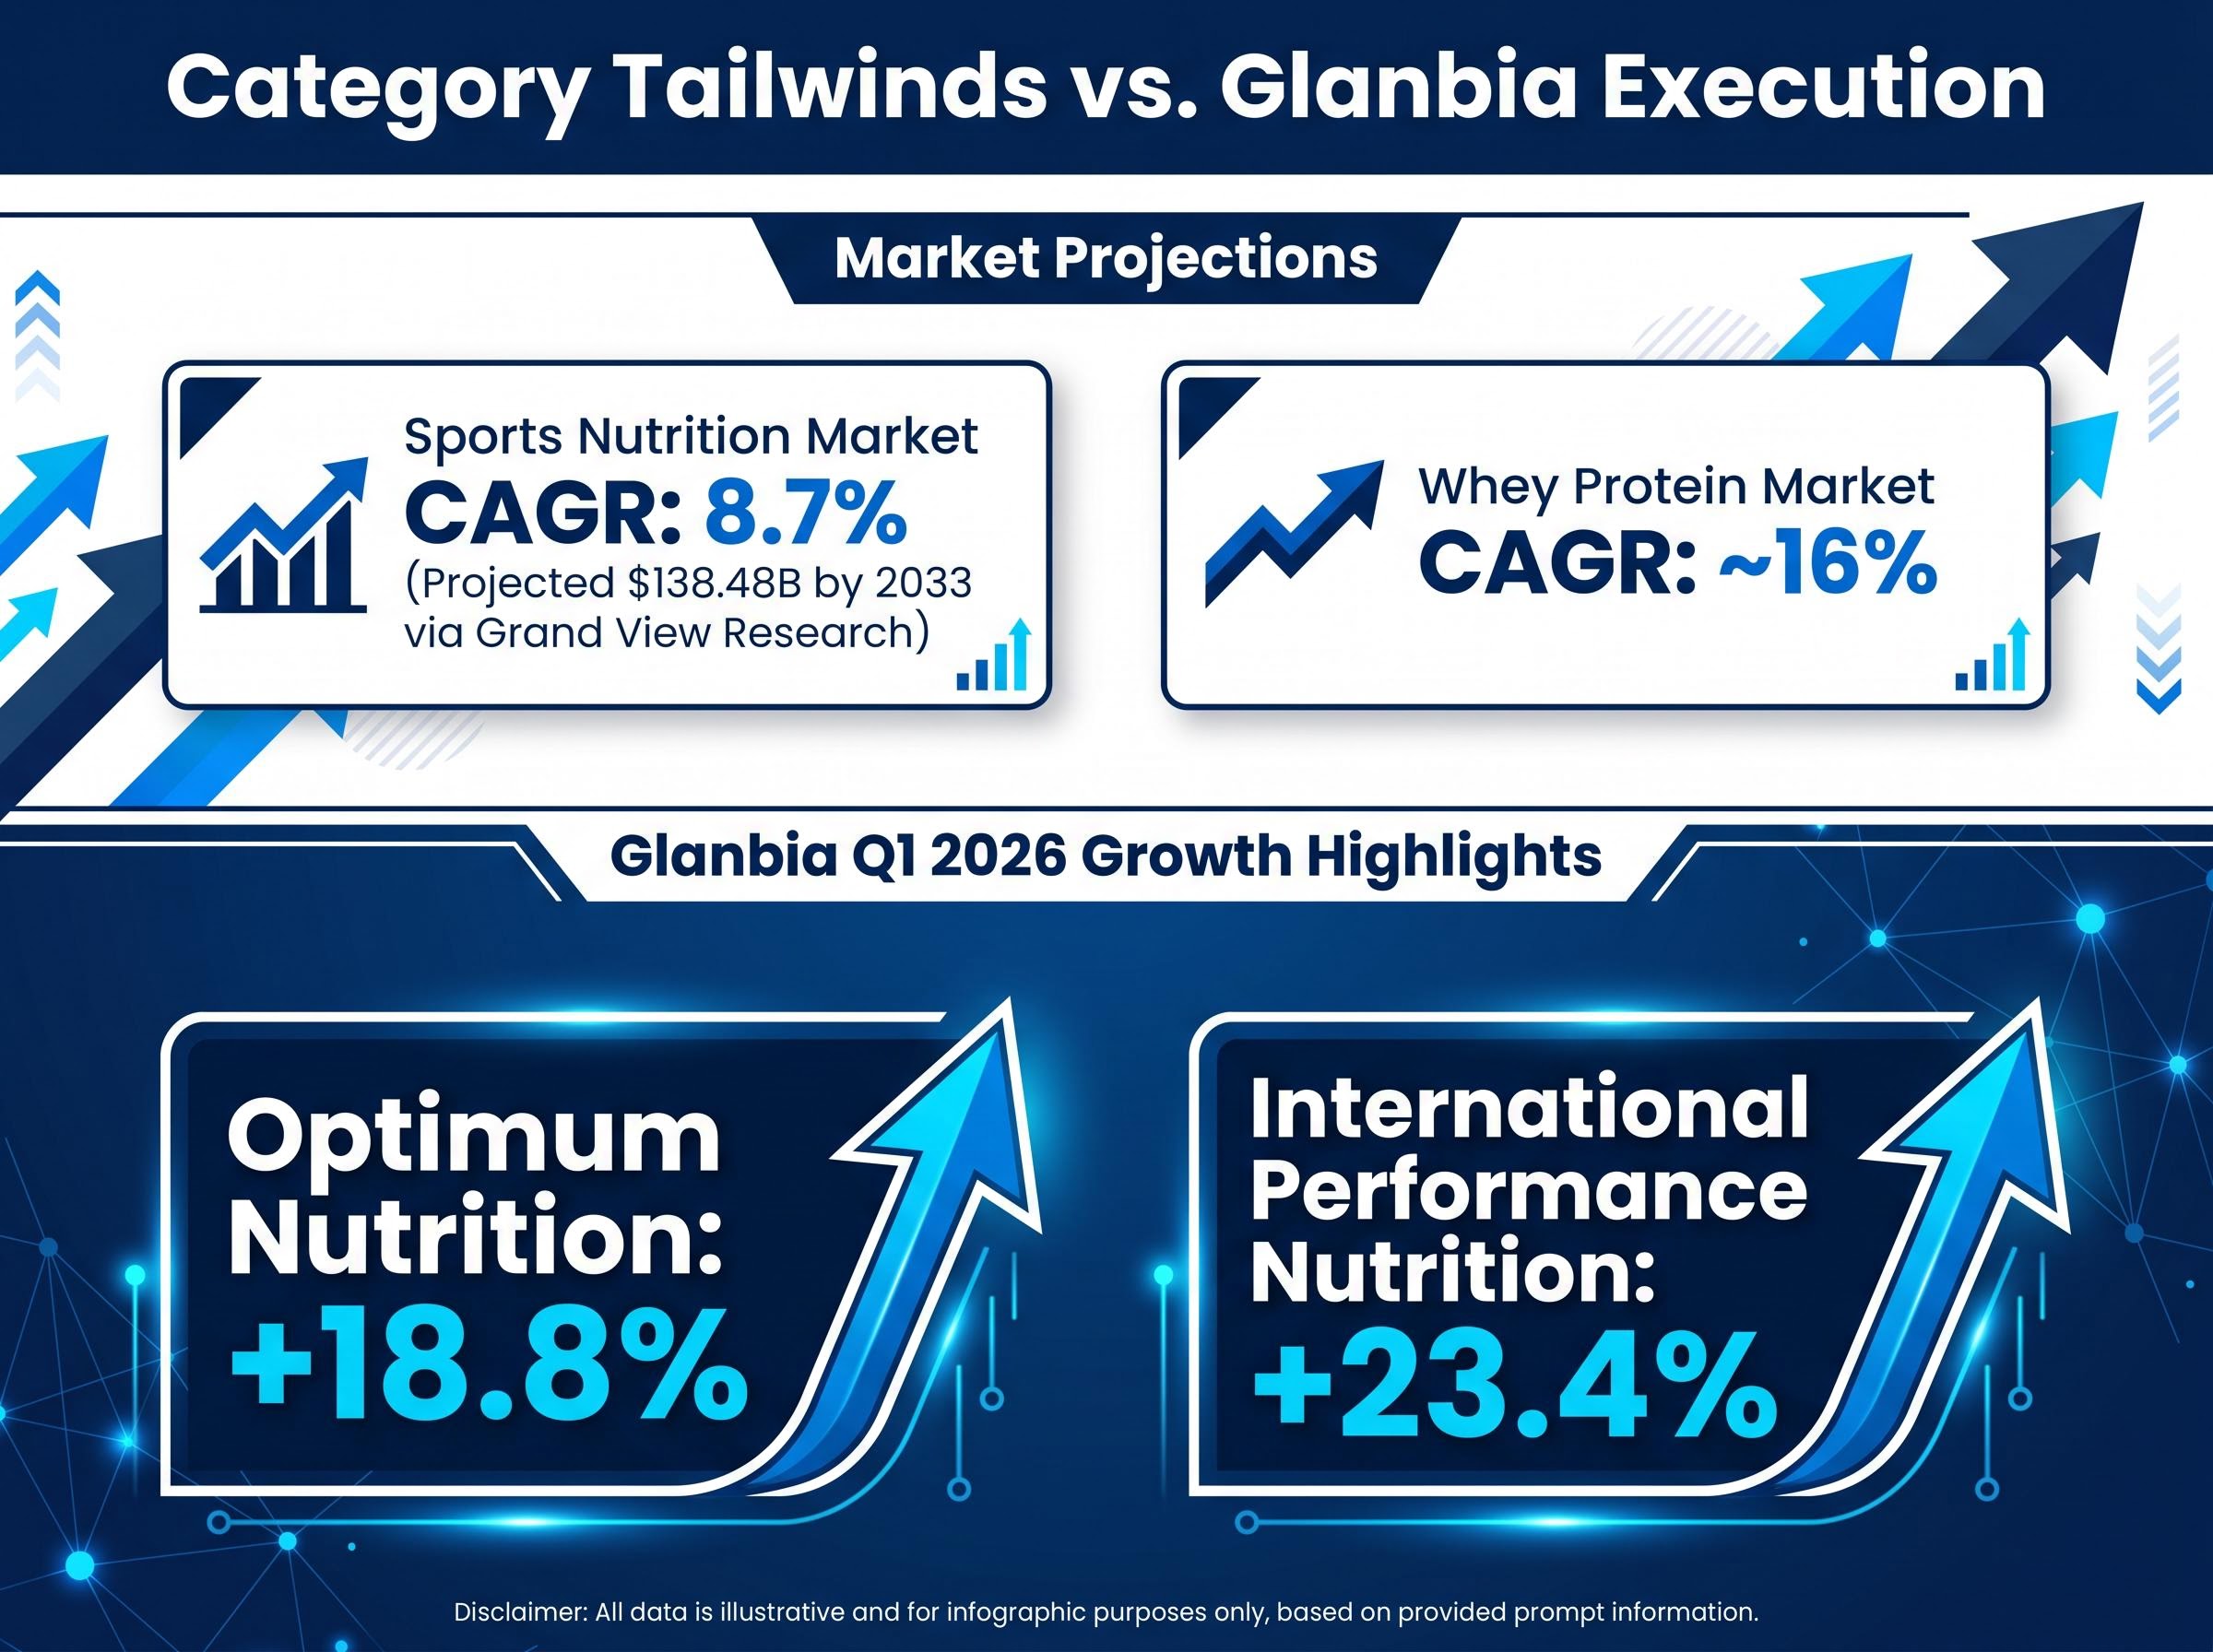
Performance Nutrition delivered +11.5% LFL growth against a consensus of 7.2%. Within that, Optimum Nutrition posted +18.8%, powered by sustained momentum in Gold Standard Whey and Creatine product lines. International Performance Nutrition growth of +23.4% confirmed the demand expansion is geographically broad, not tethered to a single market.
Health & Nutrition produced the widest proportional beat: +11.6% LFL growth against a 4.9% consensus, more than doubling expectations. Dairy Nutrition, the group’s most commodity-exposed segment, grew +2.0%, a modest result that nonetheless contributed positively to the volume story.
By the time the Optimum Nutrition figure lands, the pattern is clear. Two of Glanbia’s three divisions beat consensus by roughly double the expected rate, a breadth of outperformance that raises questions about whether medium-term growth targets are conservative.
| Segment | Q1 2026 LFL Growth | Analyst Consensus | Beat Margin |
|---|---|---|---|
| Performance Nutrition | +11.5% | +7.2% | +4.3 ppts |
| Optimum Nutrition | +18.8% | N/A | N/A |
| Health & Nutrition | +11.6% | +4.9% | +6.7 ppts |
| Dairy Nutrition | +2.0% | N/A | N/A |
Glanbia’s Q1 beat did not happen in isolation. The quarterly figures sit on top of a structural acceleration in the sports nutrition and whey protein categories that is independently documented and broadening.
The global sports nutrition market is projected to grow at an 8.7% compound annual growth rate (CAGR), reaching approximately $138.48 billion by 2033, according to Grand View Research. The whey protein market specifically is expanding at approximately 16% CAGR, driven by rising consumer demand for high-quality, performance-grade protein supplements.
The Grand View Research sports nutrition forecast projects the global market reaching approximately $138.48 billion by 2033 at an 8.7% CAGR, a trajectory that positions category-leading brands like Optimum Nutrition to benefit from structural demand growth rather than cyclical consumer trends.
Optimum Nutrition’s portfolio is concentrated in the premium end of performance-grade whey, the fastest-growing segment of a fast-growing category. Its +18.8% Q1 growth outpaced the broader Performance Nutrition segment by more than seven percentage points, suggesting the brand is capturing disproportionate share of the category tailwind rather than simply riding it.
CME Dry Whey spot prices stood at approximately $0.6888/lb as of late April 2026, reflecting the strong demand environment across whey-based ingredients. For investors tracking Glanbia as a mid-cap nutrition holding, the Q1 result reflects both company-specific execution and a category lift, a combination that strengthens the forward case.
Management responded to the Q1 beat by raising guidance, a decision that carries its own signal about internal confidence in demand durability.
Adjusted EPS growth guidance raised to the upper end of the 7-11% range for FY 2026.
The revised midpoint of approximately 9% exceeds the prior Bloomberg consensus of approximately 8%, meaning the guidance raise moved the target above where the market had positioned expectations.
The guidance upgrade, however, arrives alongside a cost reality that introduces a testable condition for the second half. Glanbia enacted double-digit percentage price increases in April 2026 to offset rising whey input costs. Management acknowledged that some volume elasticity is anticipated in later quarters as those increases flow through to end consumers.
The price increases are a rational response to input cost inflation, but they create a direct tension with the volume-led growth story. If consumers absorb the higher prices without meaningful demand reduction, the Q1 trajectory holds. If elasticity bites harder than anticipated, the volume narrative faces its first real test.
The volume elasticity test Glanbia faces in H2 is not occurring in a vacuum: a 50% year-to-date surge in Brent crude is compressing consumer disposable income across the group’s key markets through higher fuel and energy costs, adding a macro headwind to the company-specific pricing decisions enacted in April 2026.
Past performance does not guarantee future results. Financial projections are subject to market conditions and various risk factors.
Taken together, the Q1 results and guidance revision suggest that Glanbia’s medium-term growth targets, previously viewed as aspirational by parts of the market, are now tracking as achievable or potentially conservative.
The 3.2x average-volume share reaction on 29 April points to institutional investors reassessing the stock’s position within nutrition and consumer staples allocations. A single-day move of this magnitude on this volume is not retail-driven noise; it reflects positioning shifts by larger holders.
Capital reallocation across sectors driven by geopolitical uncertainty has historically benefited defensively positioned consumer staples names with pricing power, a dynamic that partially explains why institutional volume in Glanbia on 29 April suggested deliberate positioning rather than reactive momentum trading.
Two variables will determine whether the momentum extends into Q2 and beyond:
These two data points, available with Q2 results, will confirm or qualify the story the Q1 numbers are telling.
For investors wanting to situate the Q1 beat within a fuller valuation framework, our deep-dive into analyst price targets for Glanbia covers the consensus range from 19.2 EUR to 22.18 EUR, the assumptions behind differing H2 execution risk estimates, and how the pre-rally price of 17.52 EUR shaped institutional positioning ahead of the results.
Volume-led, broad-based outperformance across two of three segments at roughly double consensus rates is the kind of result that revises investor expectations structurally, not just for one quarter. Management’s decision to raise guidance to the top of the range reinforces the signal: internal confidence in the demand environment continuing is high enough to move the target above where the market had set it.
The Q1 story is compelling. Whether it becomes a full-year story depends on two conditions: the degree to which April’s price increases trigger consumer pushback, and whether international Performance Nutrition growth can sustain its pace. Both will be measurable by Q2 reporting.
This article is for informational purposes only and should not be considered financial advice. Investors should conduct their own research and consult with financial professionals before making investment decisions.
Glanbia reported Q1 2026 group like-for-like revenue growth of +7.2% against a consensus estimate of 4.6%, with volume growth of +8.2% more than tripling the 2.5% consensus estimate, driving shares up approximately 15% on 29 April 2026.
Glanbia shares surged approximately 15% on 29 April 2026 because the company's Q1 results roughly doubled analyst consensus on two key metrics, volume growth and like-for-like revenue, a scale of outperformance that forced institutional investors to reassess forward expectations and reallocate positions.
Following the Q1 beat, Glanbia raised its adjusted EPS growth guidance to the upper end of the 7-11% range for FY 2026, implying a revised midpoint of approximately 9%, which exceeds the prior Bloomberg consensus of approximately 8%.
Optimum Nutrition posted +18.8% like-for-like growth in Q1 2026, outpacing the broader Performance Nutrition segment result of +11.5% by more than seven percentage points, driven by sustained momentum in Gold Standard Whey and Creatine product lines.
The two main risks are consumer volume elasticity from double-digit price increases enacted in April 2026 to offset rising whey input costs, and whether international Performance Nutrition growth of +23.4% in Q1 can be sustained or will mean-revert in subsequent quarters.


