Lululemon Fundamental Analysis: the Price of Brand Dilution
3 hrs ago

Oxford Square Capital maintains a massive 23.2% dividend yield, presenting a striking contrast against a catastrophic 21.9% contraction in its underlying asset value during a single quarter. For investors evaluating Oxford Square Capital stock, this juxtaposition highlights the stark difference between surface-level income and underlying capital preservation within the Business Development Company sector. The firm released its first-quarter earnings on 29 April 2026, confirming widespread performance misses and structural portfolio deterioration across its debt investments.
Consequently, shares have plunged toward 52-week lows as markets digest the widening gap between what the fund distributes and what the asset base actually earns. A rigorous dissection of these Q1 financials is necessary to determine if the massive payout compensates for the underlying capital destruction. Analysing the fundamental mechanics driving the yield reveals the hidden costs of sustaining such distributions.
The first quarter of 2026 revealed severe structural deficits across the company’s financial profile. Rather than a cyclical dip, the numbers indicate a fundamental cracking in the core earning mechanism of the managed portfolio. The period ending 31 March 2026 delivered comprehensive misses across both bottom-line profitability and top-line revenue estimates, shocking institutional observers.
Earnings per share of $0.05 missed the $0.07 estimate by 28.57%, representing a clear regression from the previous quarter. Total revenue of $8.9 million fell 10.91% short of the $9.99 million forecast provided by consensus models. This top-line failure directly compressed the fund’s operational profitability, leaving little margin for error in capital deployment.
Net investment income dropped 24.1% sequentially. This severe contraction highlights a structural earning deficit that leaves the company with less internal cash flow to support its aggressive distribution policy. The fundamental baseline for the current yield is now mathematically strained, shifting the focus to capital preservation.
| Financial Metric | Q4 2025 Actuals | Q1 2026 Estimates | Q1 2026 Actuals |
|---|---|---|---|
| Earnings Per Share (EPS) | $0.07 | $0.07 | $0.05 |
| Total Revenue | Not Specified | $9.99M | $8.90M |
| Net Asset Value (NAV) | $1.69 | Not Specified | $1.32 |
The sheer scale of the investment losses directly drove the collapse in the company’s net asset value. Combined realised and unrealised losses spiked 62.3% quarter-over-quarter to $29.7 million, equating to $0.34 per share. These figures demonstrate the rapid deterioration of the underlying collateral backing the fund’s debt positions.
Management attributed these massive write-downs to deteriorating asset valuations in the secondary market. As the underlying debt instruments lost value, the corresponding equity base of the fund absorbed the damage directly. This write-down mechanism explains why the net asset value plunged so violently in a single three-month window.
For investors wanting to explore the specific mechanics of these losses, our detailed coverage of Oxford Square Capital earnings analyses the underlying digital acquisitions and the broader implications for the fund’s defensive cash positioning.
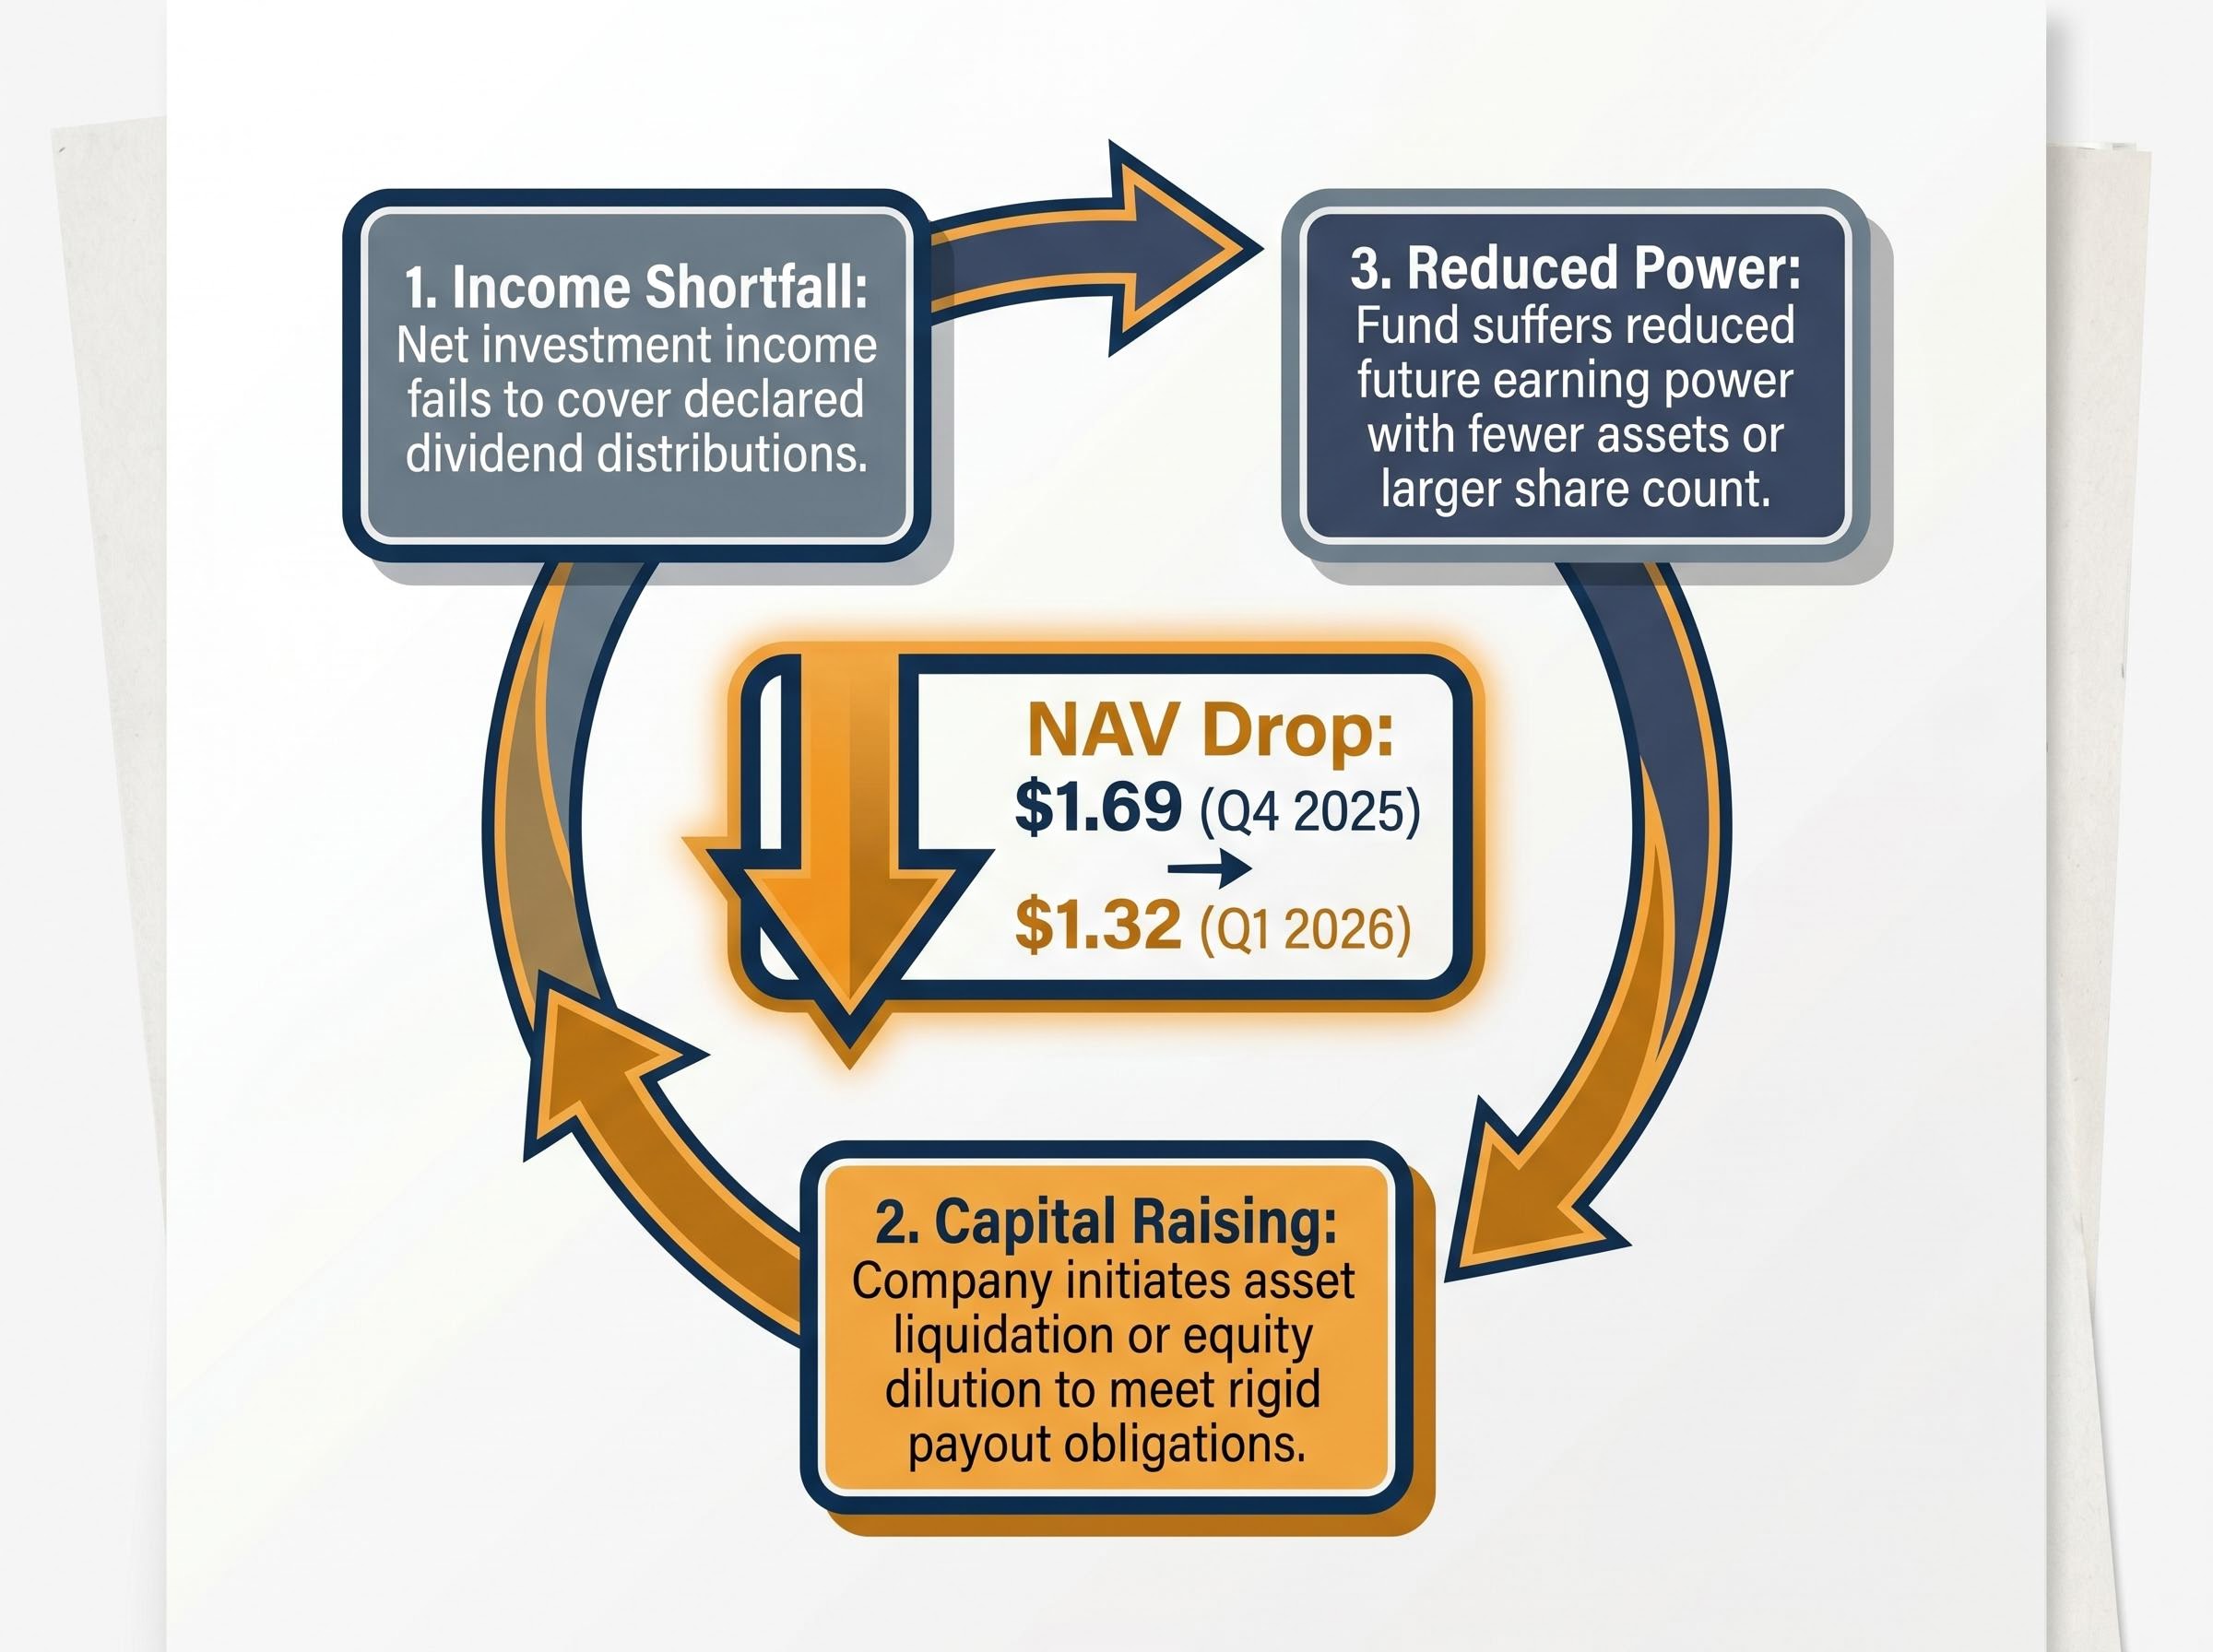
For a Business Development Company, Net Asset Value represents the total value of all portfolio investments minus any liabilities, divided by the number of outstanding shares. It acts as the fundamental baseline of a fund’s intrinsic worth and its capacity to generate future returns. When a fund distributes more cash than its net investment income generates, it must fund the difference through alternative, often destructive, means.
This mechanical cycle of value destruction begins when a yield policy ignores the actual cash generated by the underlying assets. Investors often focus solely on the dividend payout, missing the conceptual tools needed to spot unsustainable distributions before capital is wiped out entirely. The historic drop from the Q4 2025 NAV of $1.69 to the Q1 2026 NAV of $1.32 serves as a primary case study in this mathematical reality.
The cycle of NAV erosion typically follows three distinct operational steps:
Continuous erosion leaves the fund with progressively less capital to generate future income, creating an accelerating downward spiral. A shrinking asset base makes an unchanged dividend fundamentally dangerous over an extended timeline, regardless of historical payout consistency.
Despite the massive earnings miss and the shrinking asset base, management elected to maintain the aggressive payout schedule for the near term. The company declared monthly dividends of $0.035 per share through September 2026, totalling $0.105 for the upcoming quarter. This rigid decision keeps the annualised dividend yield exceeding 23%, projecting an image of stable income to the retail market.
However, the mechanics behind funding this yield reveal a highly dilutive reality that undermines shareholder value. During the quarter, the company executed an at-the-market equity offering to raise the necessary capital shortfall. Management issued approximately 7.2 million new shares, securing $12.3 million in net capital proceeds to support operations and maintain the distribution.
The firm’s first-quarter regulatory filings detail the precise mechanics of this dilution, demonstrating a heavy reliance on continuous market interventions to fulfill rigid distribution obligations.
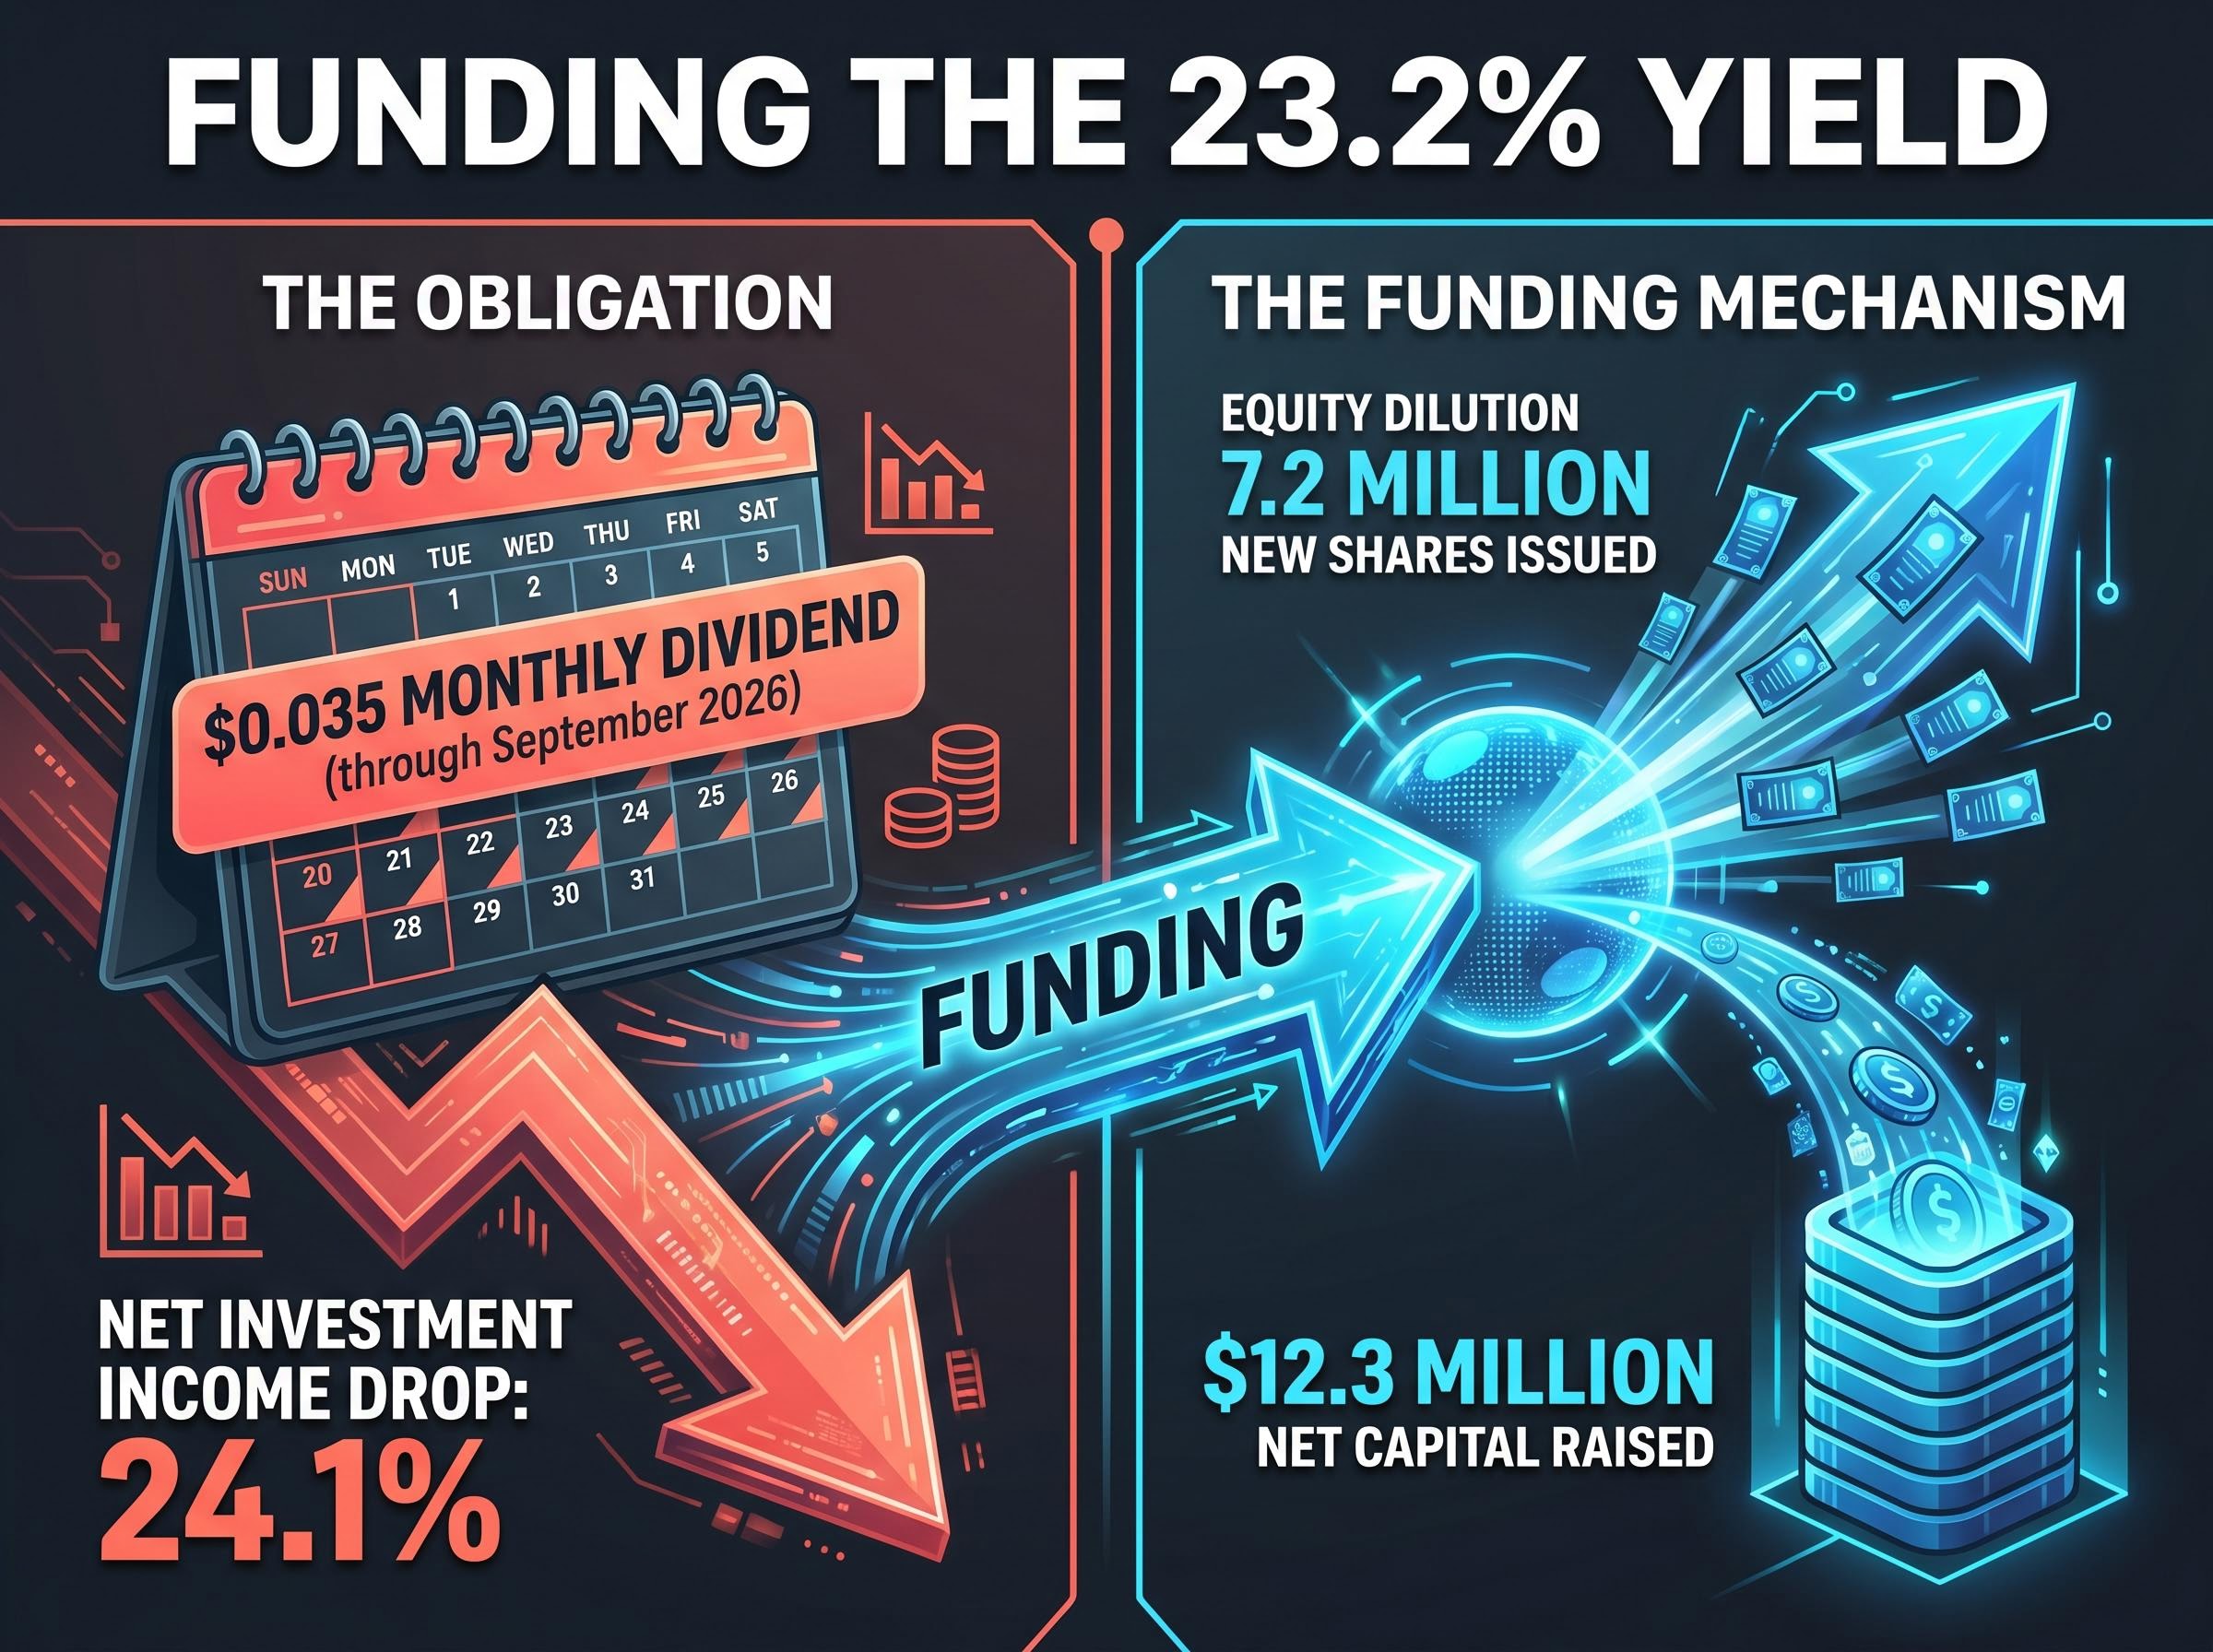
The connection between the failing net investment income and the reliance on issuing new shares is mathematically clear. The high yield is currently being funded by diluting the existing ownership stake through fresh equity issuance at lower valuations. Investors are effectively receiving their own capital back in the form of taxable distributions, diminishing their total return.
Analyst Sentiment on Dividend Viability “Distributions are currently exceeding net investment income by a significant margin following the first-quarter results. Given the historic pattern of NAV erosion, the mathematical impossibility of sustaining the current payout without a severe operational turnaround is becoming apparent to institutional holders.”
This equity strategy acts as a temporary liquidity bridge rather than a structural fix for the underlying asset performance. Relying on continuous share issuance to fund a dividend places permanent downward pressure on the per-share value of the remaining portfolio assets.
The systemic deterioration in the domestic leveraged finance ecosystem continues to suppress the performance of traditional credit portfolios across the sector. Lower-rated debt instruments are suffering valuation contractions amid refinancing hazards, elevated interest burdens, and restricted capital access. By linking macroeconomic data to company performance, it becomes clear that the internal struggles are heavily influenced by systemic credit market stagnation.
Industry data highlights the specific macro pressures weighing on middle-market lending vehicles. The systemic distress is compressing secondary market valuations and forcing lenders to absorb significant mark-to-market losses on their balance sheets. These external headwinds directly compromise the fund’s ability to maintain its historical performance metrics.
An examination of broader leveraged loan market conditions reveals a stark divide, as institutional capital actively retreats from vulnerable debt tranches and restricts new loan origination across the sector.
According to Morningstar and PitchBook data, the broader market deterioration includes several concerning statistical data points:
The Morningstar LSTA index retreated as buyer demand weakened. The systemic distress ratio for loans climbed. Trailing annual default metrics advanced, indicating rising borrower insolvency. Total primary loan origination fell year-over-year, restricting new investment opportunities.
Amid this credit market stagnation, management has initiated a sudden pivot toward artificial intelligence ventures to find new growth avenues. Over the trailing six months, the company executed specific new AI deployments into Invisible Technologies Inc. and Constellation Inc. These highly specialised allocations represent a significant departure from the firm’s traditional middle-market debt structures.
This strategic shift raises serious analytical questions regarding portfolio alignment and risk management. High-growth technology investments carry distinct, volatile risk profiles that may not align appropriately with a vehicle originally designed for stable, predictable yield generation. Investors must carefully judge whether management has a viable escape route or is simply rotating into trending sectors to mask ongoing portfolio decay.
These statements regarding future technology asset performance are speculative and subject to change based on market developments and company performance. The success of these deployments will depend entirely on the operational execution of the target companies in a highly competitive sector.
A fundamental disconnect remains between the failing asset base and the rigid, high-yield dividend policy maintained by the board. The market reaction reflected this mathematical reality immediately following the morning earnings release. In premarket trading, the stock dropped an additional 2.21% to $1.77, steadily approaching the 52-week nadir.
Buying the stock purely for its yield presents significant commercial risk given the high probability of further capital destruction in the upcoming quarters. The underlying net investment income cannot currently support the distributions, and the reliance on dilutive equity issuance merely masks the structural deficit. Until the earning power of the portfolio stabilises, the dividend acts as a mechanism for returning investor capital rather than distributing actual generated profit.
Investors should monitor upcoming quarters closely to see if the new artificial intelligence investments can meaningfully stabilise the declining net investment income. Further observation of the net asset value trajectory is strictly required before committing new capital to the stock.
This article is for informational purposes only and should not be considered financial advice. Investors should conduct their own research and consult with financial professionals before making investment decisions.
For a Business Development Company, Net Asset Value represents the total value of all portfolio investments minus any liabilities, divided by the number of outstanding shares. It acts as the fundamental baseline of a fund's intrinsic worth.
Oxford Square Capital is funding its dividend by issuing new shares through an at-the-market equity offering, which raised $12.3 million in Q1 2026. This method dilutes existing shareholders to maintain distributions despite insufficient net investment income.
In Q1 2026, Oxford Square Capital missed EPS estimates by 28.57%, total revenue estimates by 10.91%, and saw net investment income drop 24.1% sequentially. Its net asset value also plunged from $1.69 to $1.32 per share.
The net asset value dropped significantly due to a 62.3% quarter-over-quarter spike in combined realised and unrealised losses, totaling $29.7 million. Management attributed these write-downs to deteriorating asset valuations in the secondary market.
Amid credit market stagnation, Oxford Square Capital is pivoting towards artificial intelligence ventures, making new deployments into companies like Invisible Technologies Inc. and Constellation Inc. This shift aims to find new growth avenues but introduces different risk profiles.