A 3-Layer Portfolio Strategy for Volatile ASX Markets
1 min ago

The financial trajectory of Dutch Bros stock reveals a compelling dynamic between rapid physical expansion and stringent operational leverage. According to company data, a 76.4% surge in net earnings and a 27.9% top-line revenue jump defined the beverage retailer’s 2025 performance, capturing immediate institutional attention. This momentum demonstrates that the company is effectively translating local brand loyalty into national financial execution.
As of late April 2026, shares trade at $55.38, with the market positioning carefully for the upcoming Q1 2026 earnings release scheduled for May 6. A comprehensive evaluation of the structural mechanics, real estate strategies, and menu economics reveals exactly how management plans to achieve its aggressive objective of ultimately operating 7,000 United States locations. Understanding this scaling framework remains vital for prospective shareholders evaluating the equity’s forward multiples.
Unit cost reductions often signal mature companies optimising operations, but in this instance, they reveal the core mechanics of a hyper-growth pipeline. The company achieved a significant reduction in average capital expenditure per shop, dropping from $1.8 million in Q4 2024 to $1.3 million in Q4 2025. Management has established a long-term unit cost target of $1.25 million, indicating further structural cost savings are anticipated over the next operating cycle.
The detailed financial breakdown within the Dutch Bros Form 10-K validates this targeted drop in development costs, reflecting a broader corporate mandate to optimize capital allocation across newly acquired properties.
This trajectory suggests a highly disciplined approach to capital allocation, ensuring that rapid physical scaling does not severely deplete corporate cash reserves.
| Metric | Q4 2024 | Q4 2025 | Long-Term Target |
|---|---|---|---|
| Average Capital Expenditure | $1.8M | $1.3M | $1.25M |
A build-to-suit real estate strategy allows the company to partner directly with external developers who fund and construct the physical buildings to precise corporate specifications. This arrangement minimises the upfront corporate cash drain typically required to secure, permit, and develop new geographic footprints. By avoiding heavy initial capital outlays, the business can rapidly accelerate its unit growth without compromising its balance sheet health.
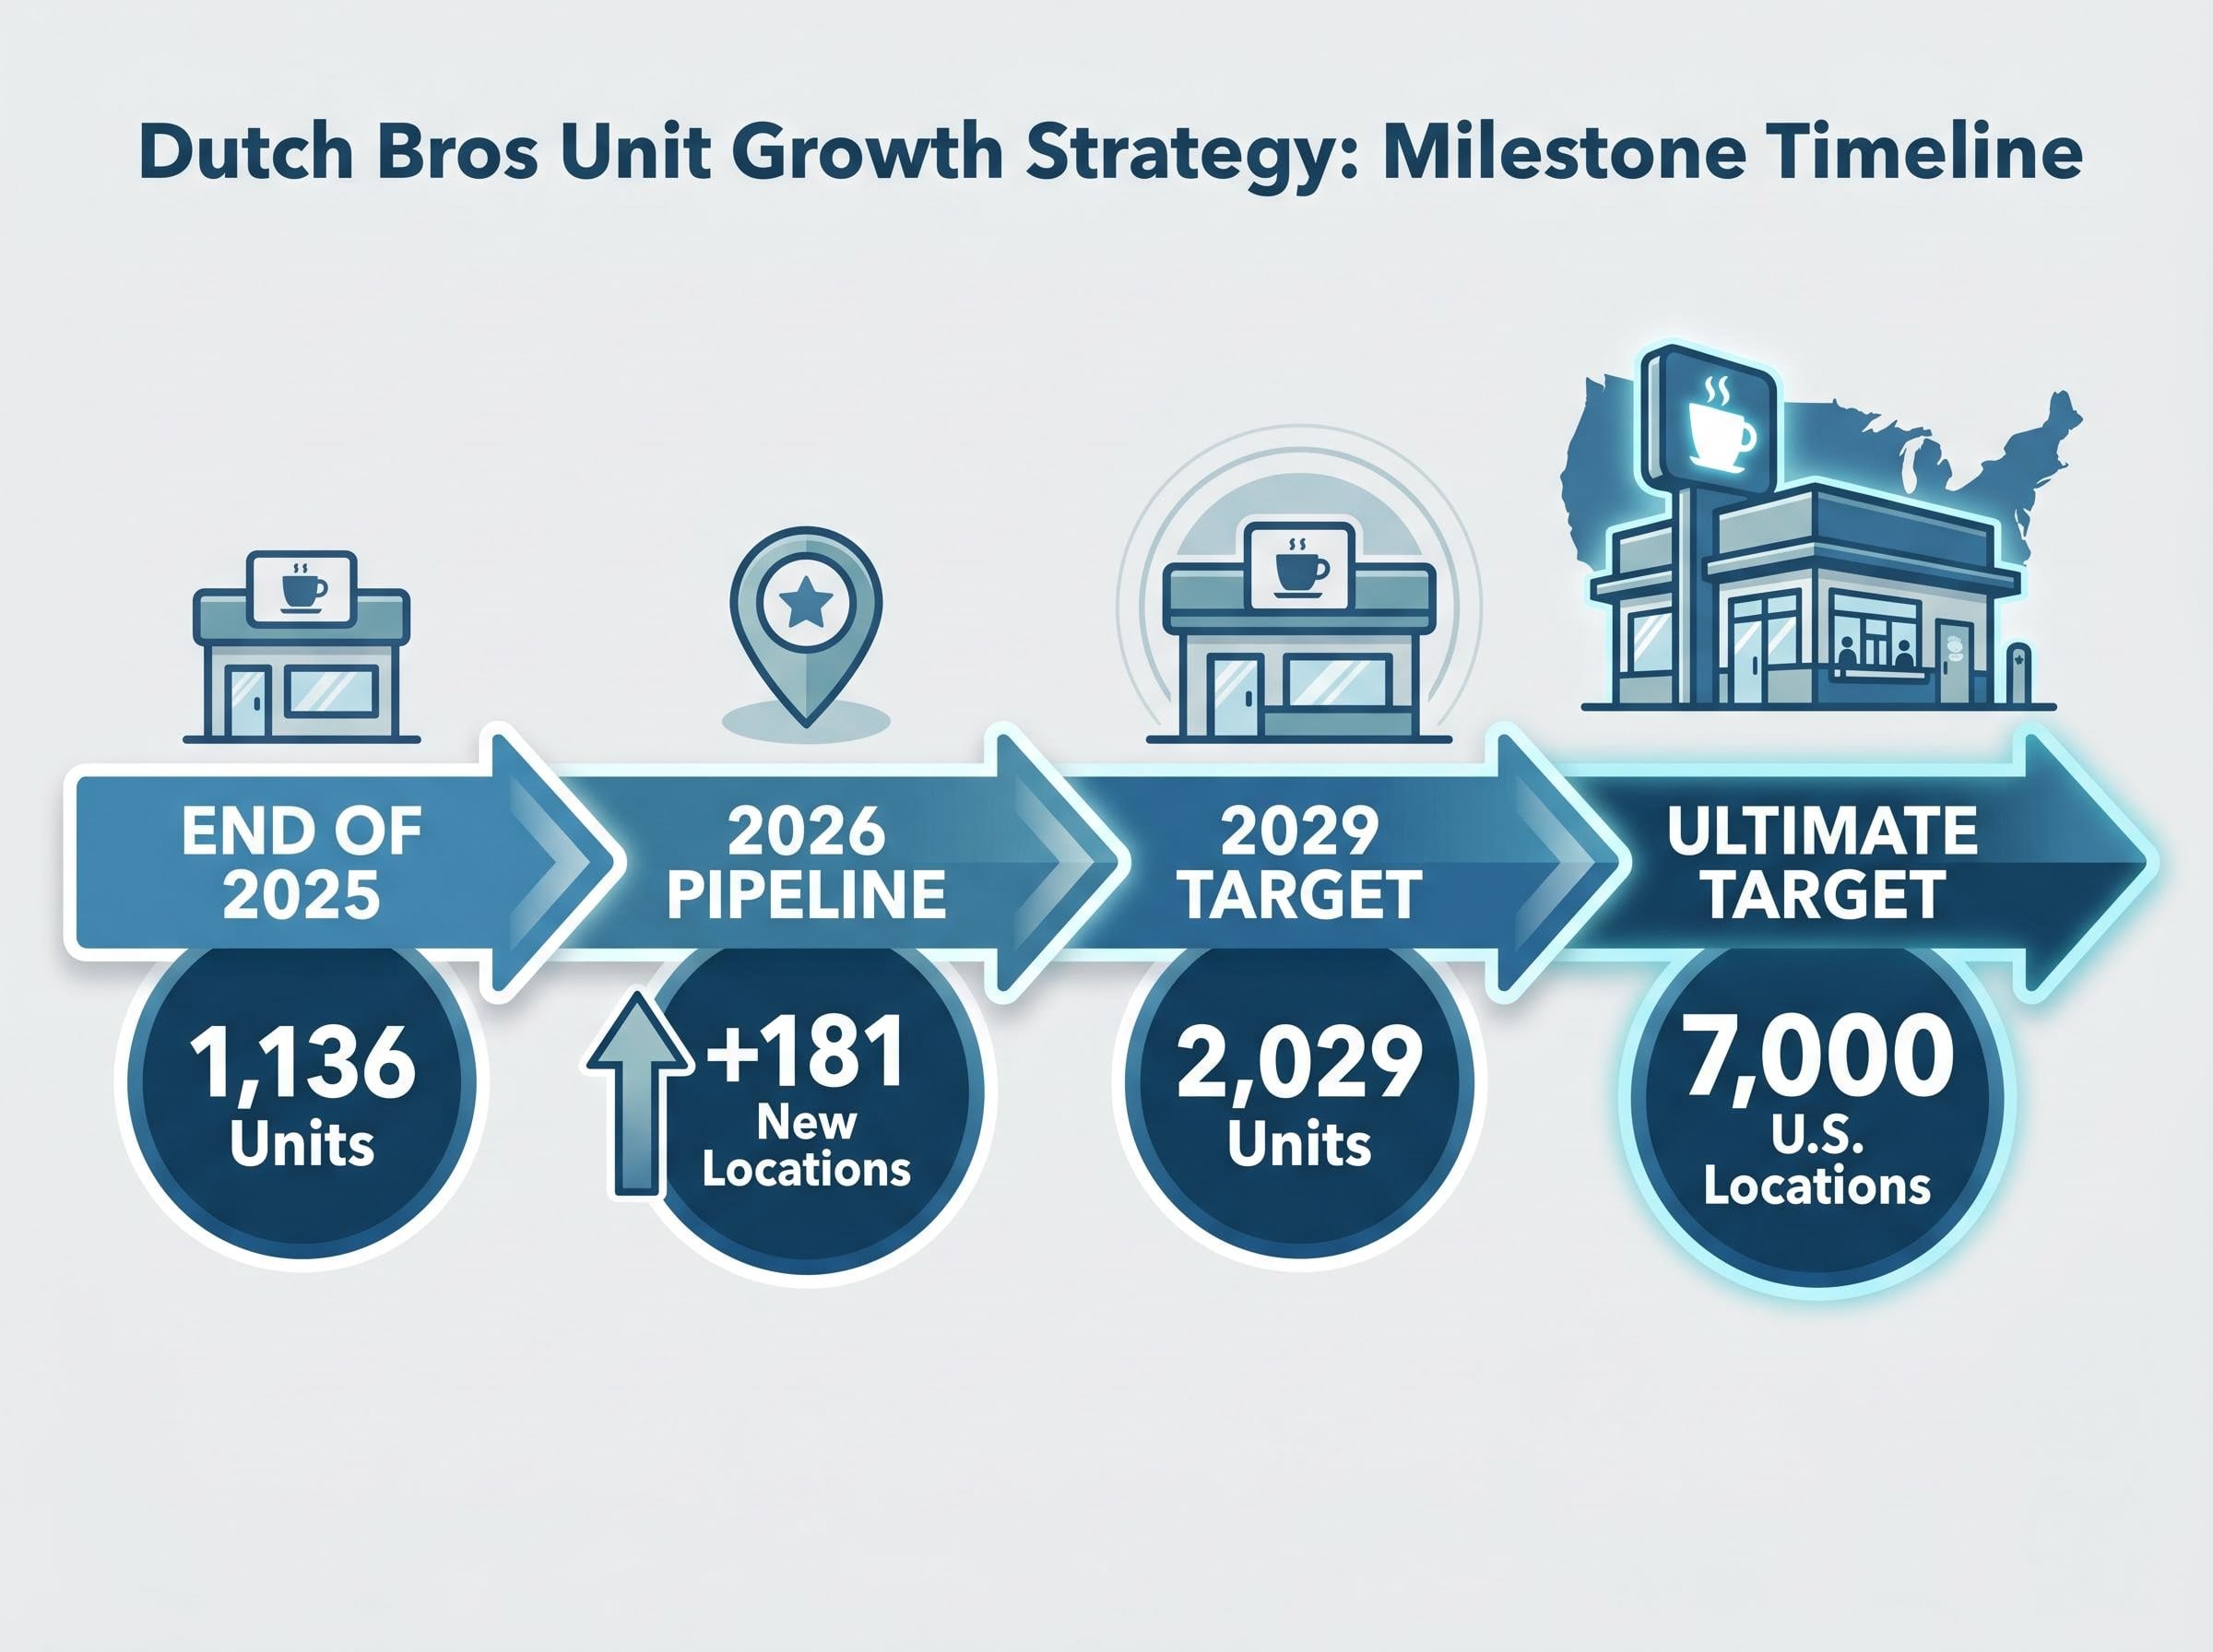
This specific real estate strategy directly enabled the expansion of the company-operated contribution margin, which reached 28.9% in 2025. This represents a margin expansion of over 400 basis points since 2022, a notable achievement in an era of elevated construction costs. The capital efficiency generated by this model forms the mathematical foundation for the overarching goal of operating 2,029 units by 2029.
Understanding these unit economics remains highly relevant for retail investors assessing operational viability. The approach proves that the company scales with financial discipline rather than burning capital indiscriminately to acquire market share. Financial projections regarding long-term unit growth and capital expenditures are subject to market conditions and various risk factors.
Top-line momentum in the retail restaurant sector relies on increasing either physical traffic or the average spend per transaction. The recent strategic shift from a pure beverage purveyor to a broader food and beverage destination heavily serves the latter metric. This food integration is not a structural brand pivot, but rather a deliberate lever designed to extract more financial value from existing drive-thru lanes.
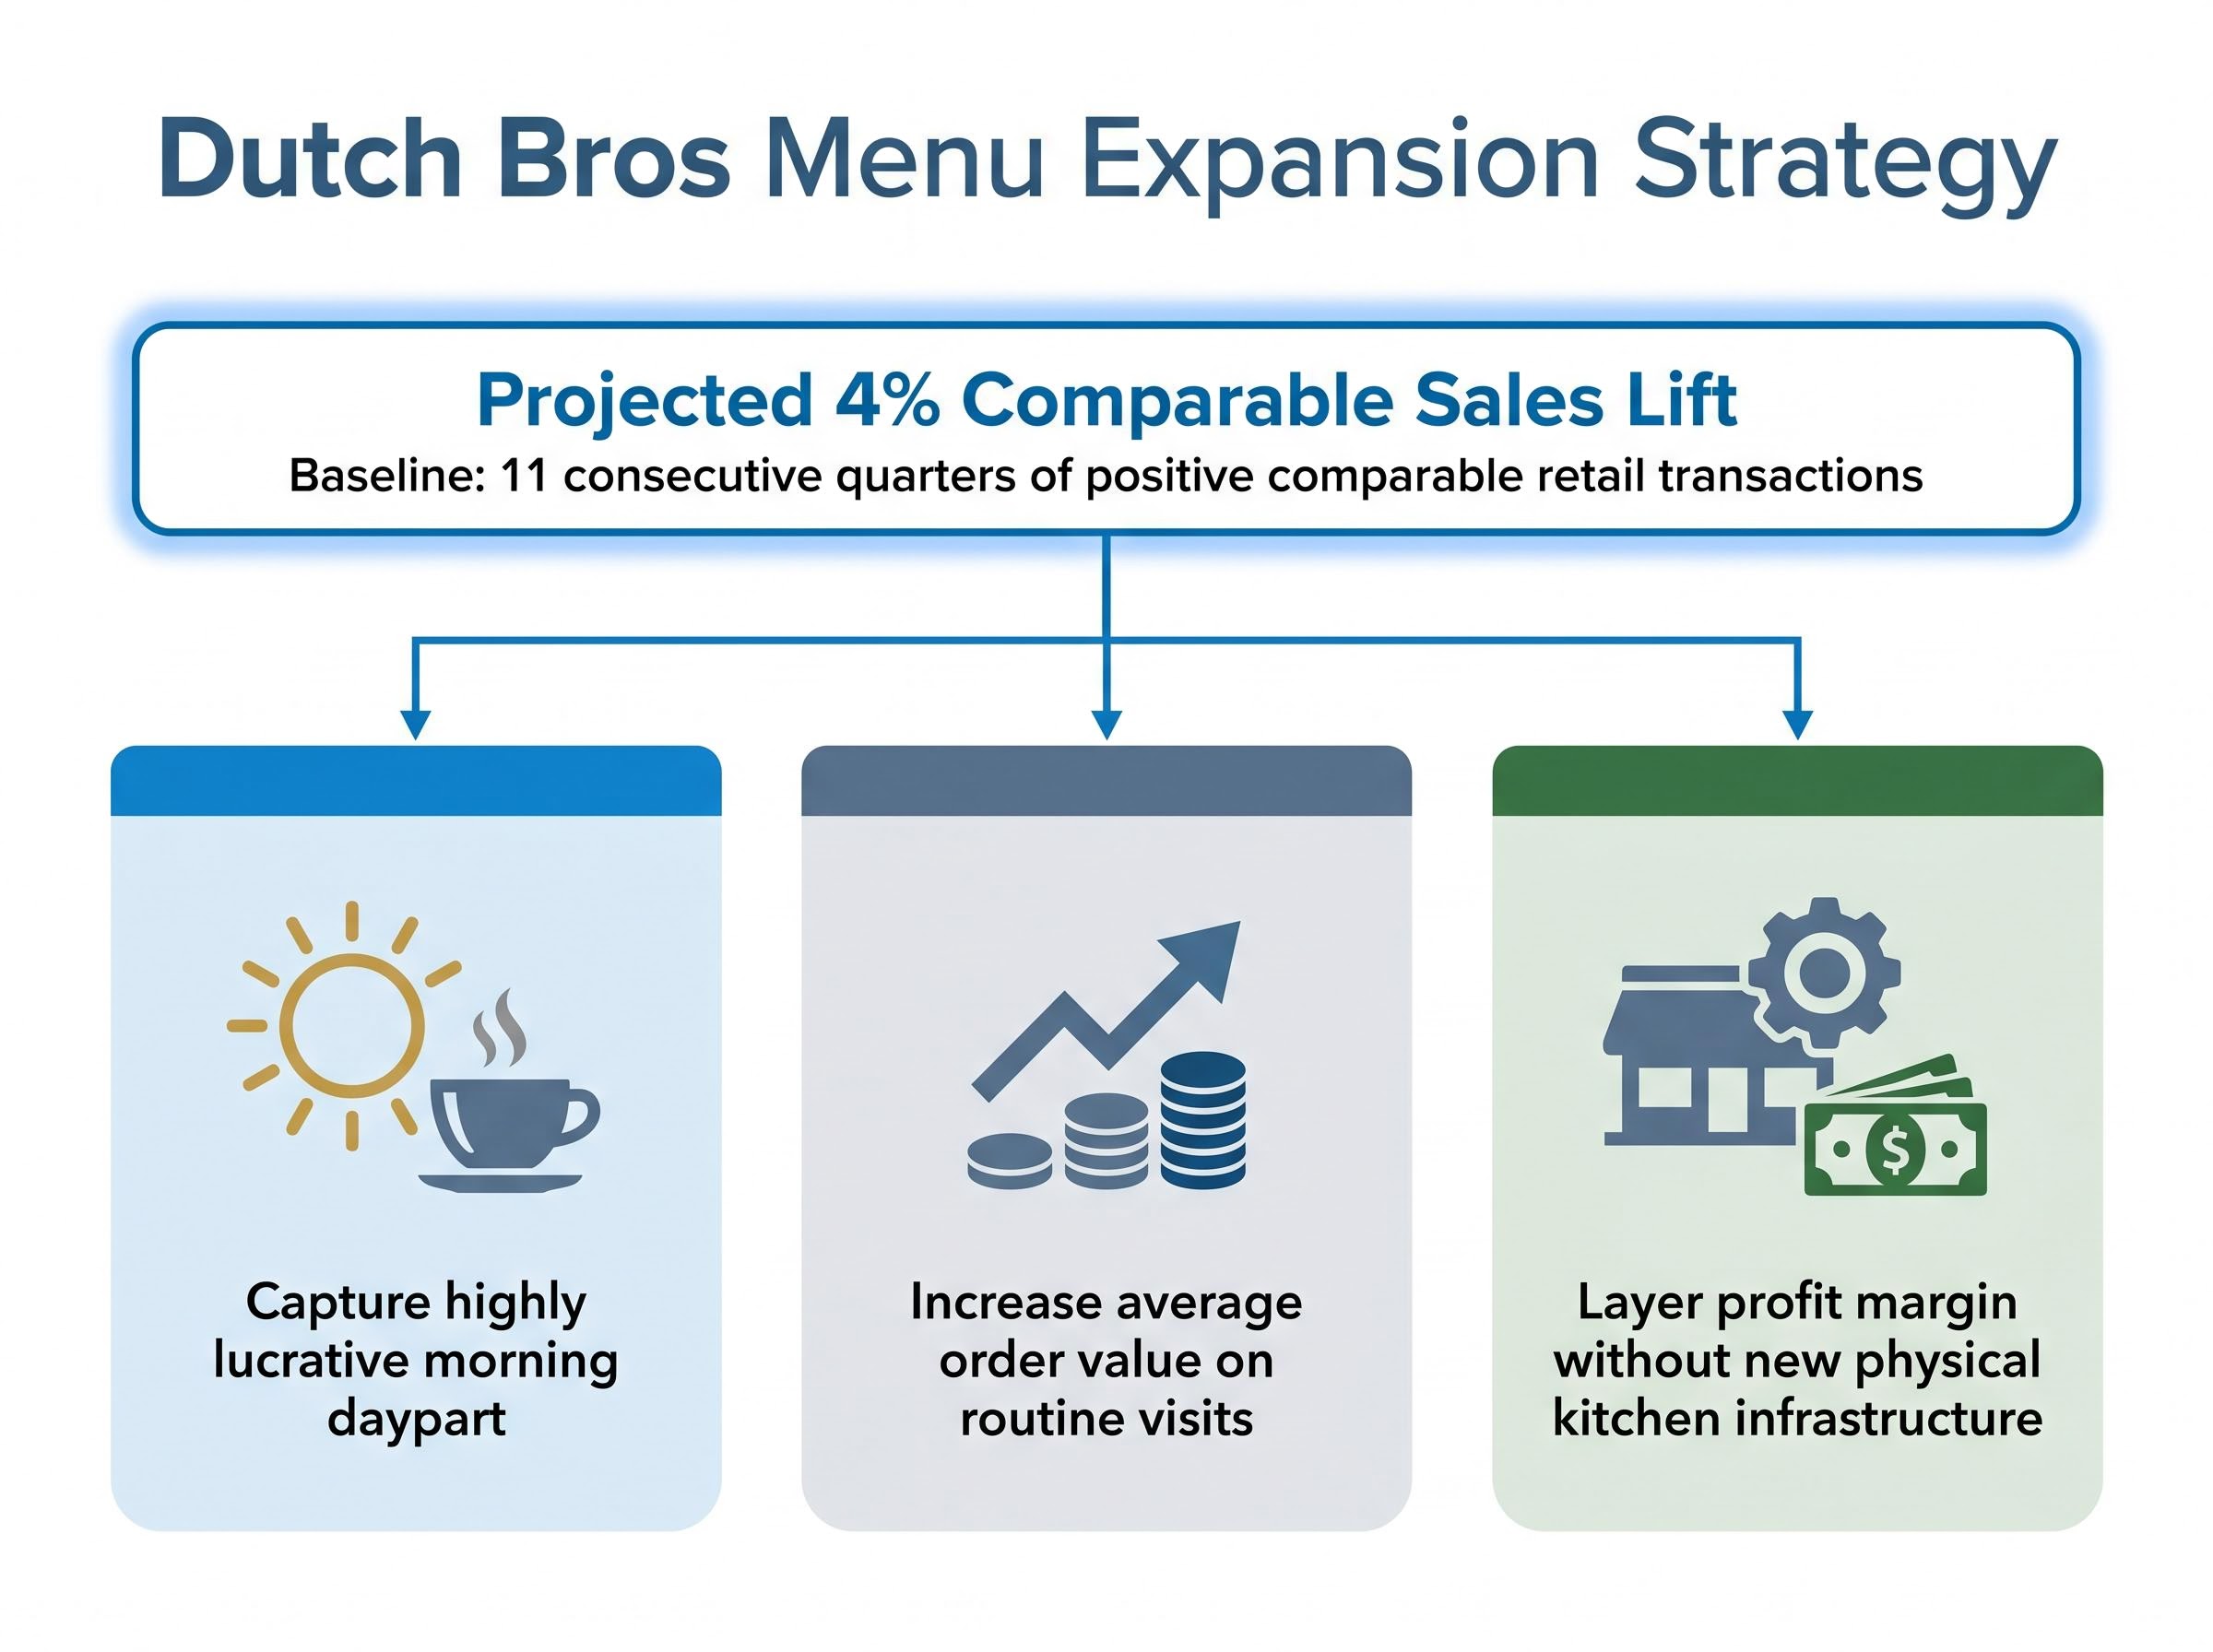
According to company data, the company currently carries a baseline momentum of 11 consecutive quarters of positive comparable retail transactions. Building upon this foundation, industry projections indicate that adding select food options could deliver an approximate 4% comparable sales lift via ticket growth. Extracting additional revenue out of every car already waiting in the drive-thru lane directly supports higher unit-level profitability. Management views these targeted menu additions as highly complementary to their primary beverage offerings.
However, maintaining rapid service times while introducing food complexity remains a primary operational hurdle. The business must carefully balance higher average order values against the risk of slowing down the drive-thru throughput, which could alienate core customers expecting immediate service.
The ability to balance this new menu complexity while simultaneously managing commodity costs and preserving operational efficiency remains a critical factor in determining whether the company can sustain its long-term profit margins.
The operational benefits of this specific menu strategy include the following structural advantages:
Capture of the highly lucrative morning daypart consumer segment Increased average order value across existing routine customer visits * Additional profit margin layering without requiring new physical kitchen infrastructure
If executed properly, this menu evolution transforms single-beverage purchases into multi-item tickets, materially shifting the underlying unit revenue mathematics. Analysts view this ticket growth as a primary catalyst for sustaining revenue momentum through the remainder of 2026.
Growth equity investors naturally fear market cannibalisation when a retail operator plans to add at least 181 new locations in a single year, as projected for 2026. Expanding a footprint rapidly often results in new units stealing sales from established neighbouring locations, compressing individual store margins. At the end of 2025, the total operating footprint reached 1,136 units, prompting institutional questions regarding regional oversaturation limits.
Third-party consumer data effectively rebuts this primary bear thesis. The drive-thru-centric model inherently supports higher geographic density compared to traditional sit-down cafes, allowing stores to operate closer together without eroding individual unit economics. Consumers prioritise convenience, meaning geographic proximity heavily dictates visit frequency.
Institutional reliance on Placer.ai location analytics data confirms that this proximity-driven convenience model successfully protects individual shop revenues from new nearby store openings.
A recent consumer traffic analysis validates the structural health of the 2025 expansion cohort, providing empirical evidence against the oversaturation argument. Geographic penetration data continues to show strong brand adoption in newly entered markets.
Placer.ai Consumer Analysis According to the “Dutch Bros’ Grounds for Success in 2026” report, the company maintained stable average visits per location and successfully avoided significant cannibalisation through strategic new market entry tactics.
This specific data provides mathematical reassurance that the runway remains clear for further aggressive domestic expansion. Management’s long-term projection of a 7,000 retail unit United States addressable market appears grounded in these current foot traffic patterns. The demonstrated ability to increase regional unit density without sacrificing individual store volume serves as a powerful economic moat, differentiating the business from easily saturated competitors.
Pristine operational execution frequently commands a premium valuation, forcing investors to weigh historical performance against forward pricing structures. At the current share cost of $55.38, the equity carries a market capitalisation of $9.126 billion and trades at a forward P/E ratio of 69.93. This steep multiple suggests the broader market has already priced in significant portions of the 2029 management scaling targets.
Consensus analyst expectations show the equity trading at a steeper future profit multiple than peer energy drink manufacturers. However, the business offers a structurally safer asset profile compared to highly volatile beverage peers operating in intensely competitive, non-retail segments. The upcoming May 6 earnings release serves as an immediate test for whether the underlying financial velocity can sustain this valuation premium. Valuation models reflect high confidence, but they also expose shareholders to downside risk if growth decelerates.
To justify this multiple, prospective buyers must monitor specific execution metrics closely. The following primary risk factors will dictate forward price action:
These statements involving financial projections are speculative and subject to change based on market developments and actual company performance. Managing these risks effectively will be required to defend the current institutional pricing. If management stumbles on unit rollout efficiency, the multiple leaves very little room for error.
For readers wanting to understand the macroeconomic vulnerabilities that could compress retail multiples, our detailed coverage of S&P 500 stock market warning signals explores how rising energy prices and geopolitical friction might impact consumer discretionary spending and broader equity pricing.
The investment case fundamentally rests on the dual forces of declining unit buildout costs and rising average ticket sizes. Achieving internal capital efficiency while simultaneously expanding the top line via menu integration provides a mathematical pathway to the stated goal of 7,000 eventual domestic locations. The underlying business mechanics appear exceptionally strong, driven by a resilient real estate strategy and demonstrably stable consumer foot traffic.
While the elevated forward profit multiple demands near-absolute perfection in management execution, the structural safety of the model warrants sustained institutional attention. Investors reviewing the upcoming Q1 2026 disclosures should heavily prioritise the exact capital expenditure figures for newly opened units and any early data regarding food attachment rates. These metrics will dictate whether the company remains on track to dominate the modern drive-thru sector.
Despite the demanding valuation, many institutional analysts maintain a buy rating with an average price target of $75.65, suggesting substantial upside remains if the company successfully executes its systemwide food deployment and unit growth targets.
This article is for informational purposes only and should not be considered financial advice. Investors should conduct their own research and consult with financial professionals before making investment decisions.
Dutch Bros aims to operate 7,000 locations across the United States, underpinned by a disciplined capital allocation strategy and strong regional consumer adoption.
The company has reduced its average capital expenditure per shop from $1.8 million in Q4 2024 to $1.3 million in Q4 2025, using a build-to-suit real estate strategy to minimize upfront cash outlays.
Yes, Dutch Bros is strategically expanding its menu to include select food options, aiming to increase average order values and achieve approximately a 4% comparable sales lift from existing drive-thru traffic.
Third-party consumer data from Placer.ai indicates that Dutch Bros' drive-thru centric model supports high geographic density without significant cannibalization, effectively rebutting oversaturation concerns.
Investors should closely monitor the exact capital expenditure figures for newly opened units and any early data regarding food attachment rates to assess the company's progress toward its long-term objectives.