
Hormuz Drone Strikes Send Oil Higher Before Doha Talks
11 hrs ago
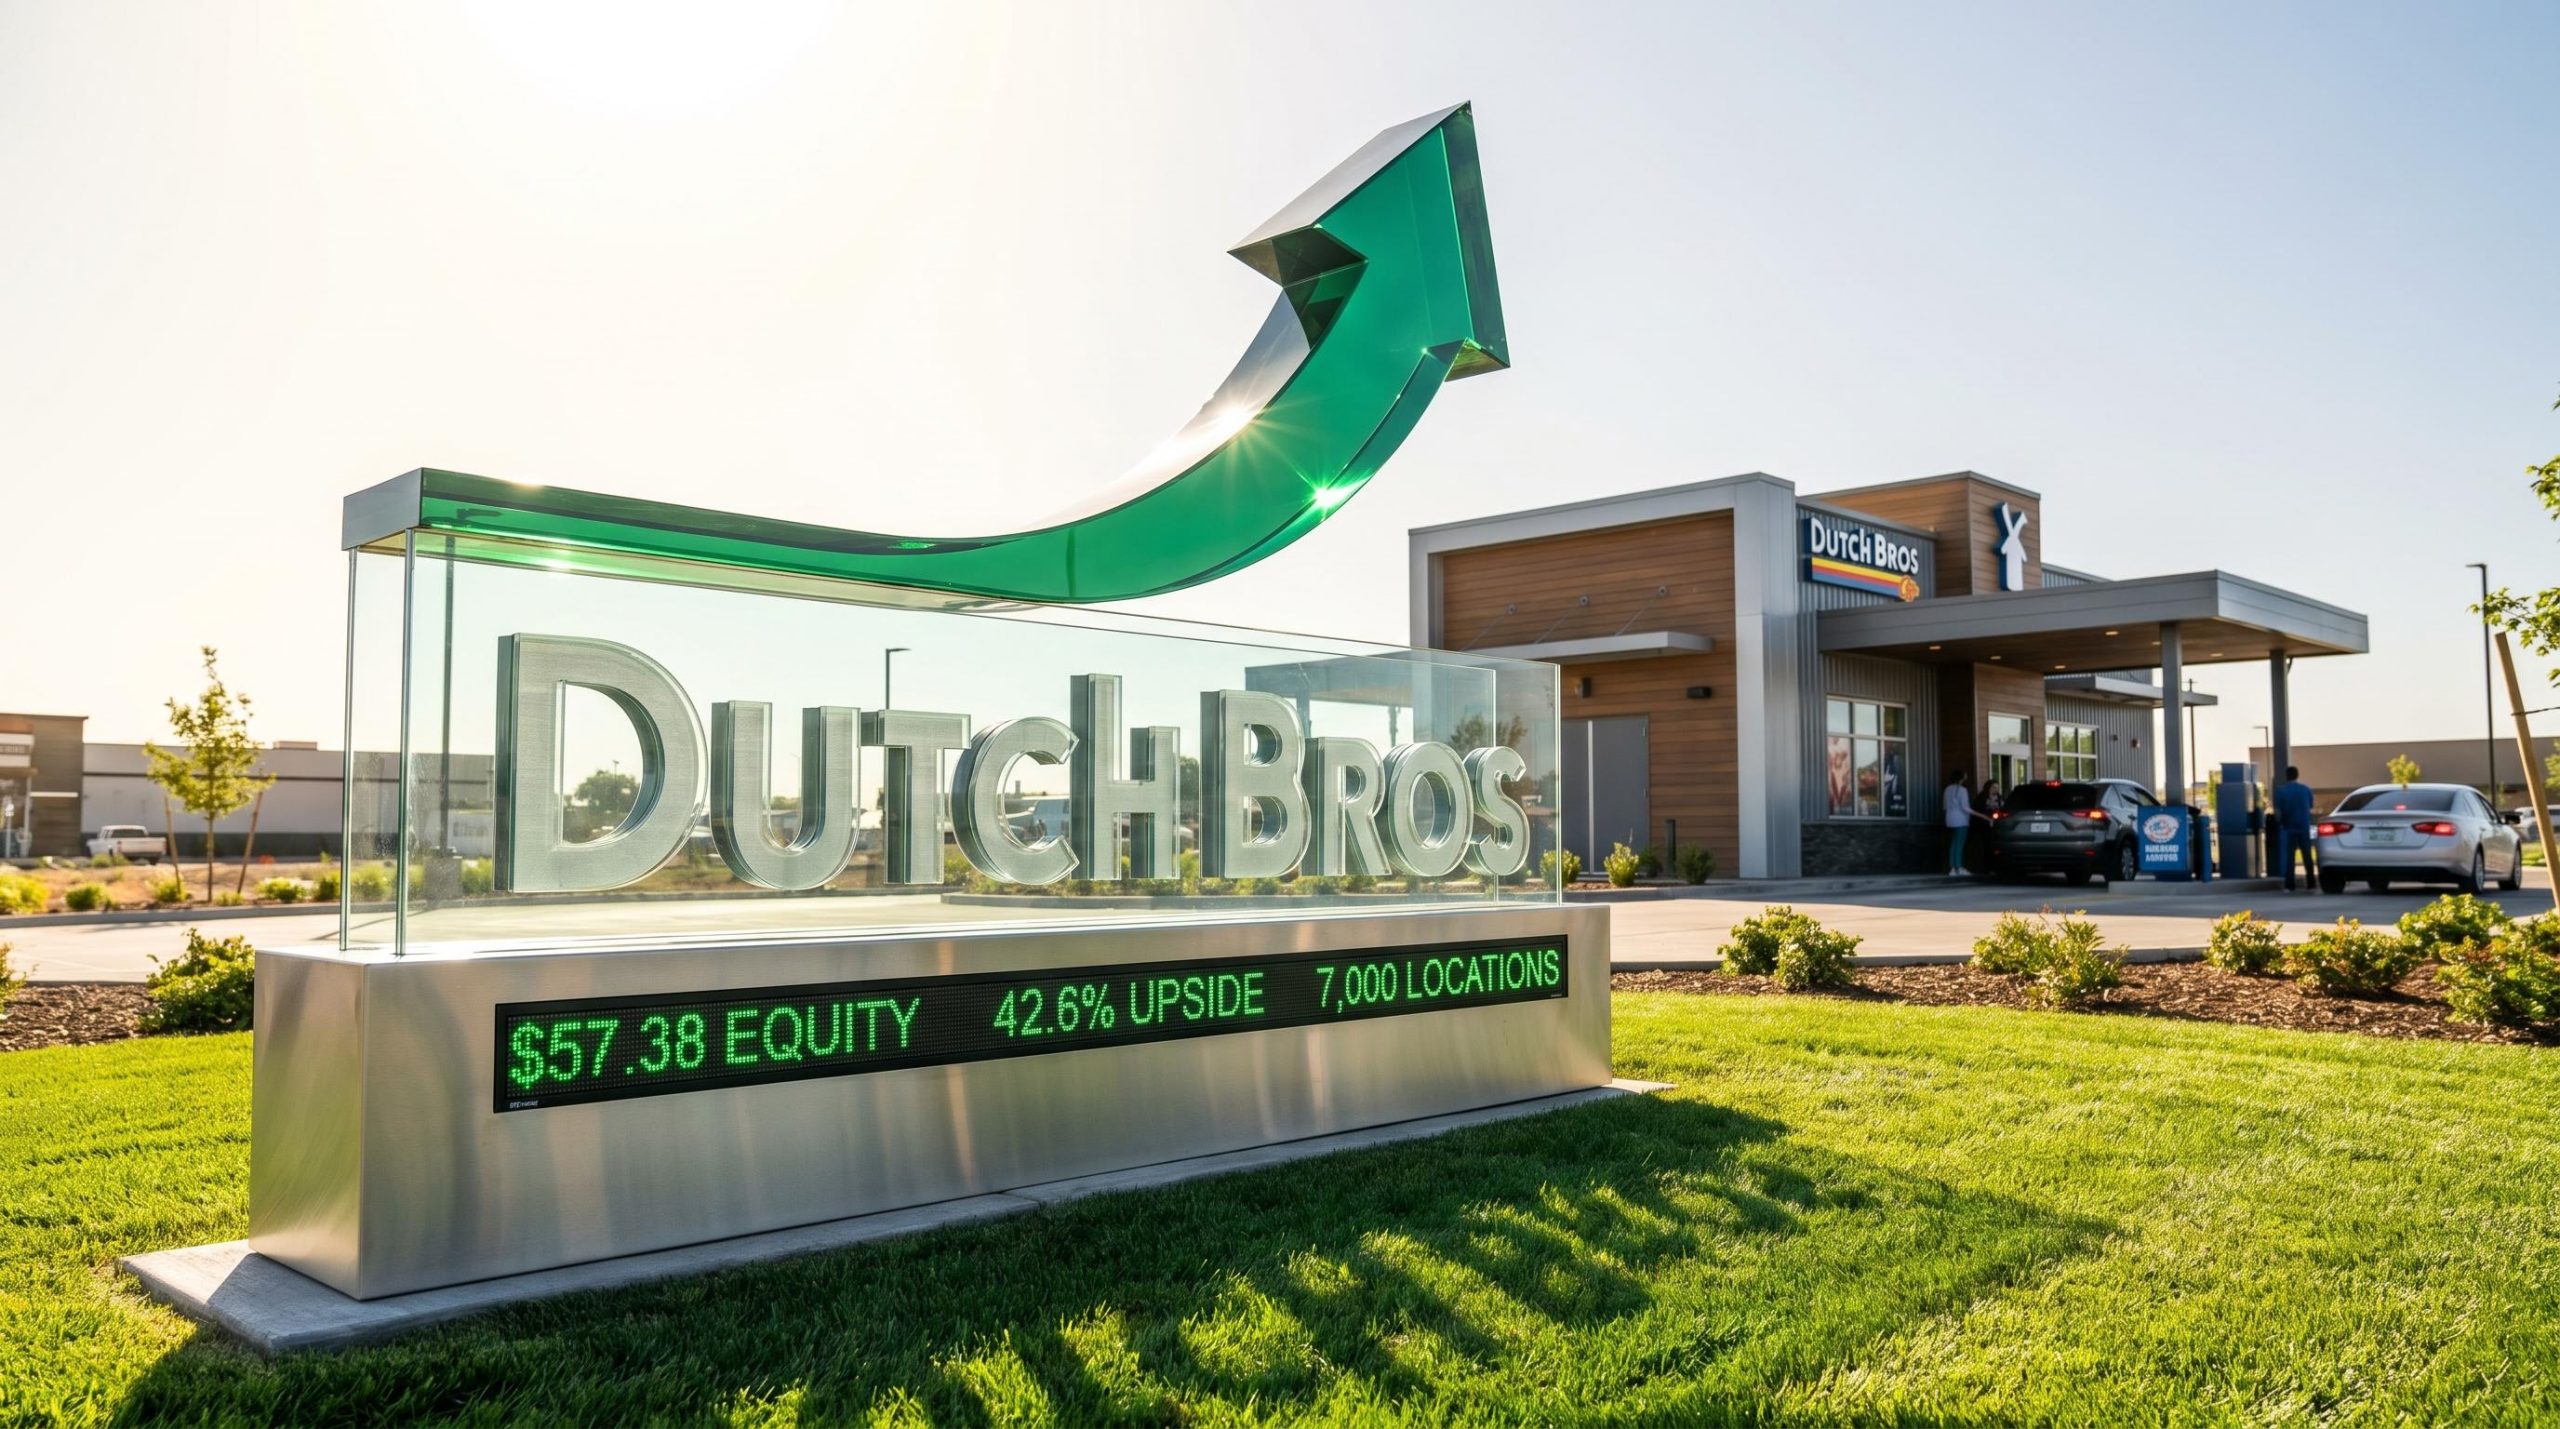
Evaluating the commercial appeal of Dutch Bros stock requires looking beyond standard retail metrics to understand a drive-thru operator executing an unusually aggressive expansion strategy. The company delivered a striking bottom-line profit jump in 2025, capturing immediate institutional attention regarding its operational efficiency. Investors are now watching closely as the equity trades near $57.38 in late April 2026, settling after recent market volatility.
The upcoming first-quarter 2026 earnings report is scheduled for May 6. This release serves as the next significant checkpoint for a management team aiming to build a 7,000-location empire across the United States. This analysis evaluates whether the current valuation premium is justified by structural market advantages and newly introduced menu catalysts. It examines the concrete real estate development metrics that separate sustainable quick-service growth from speculative ambition, providing a clear-eyed assessment of the underlying business model.
The foundation of any structural growth narrative requires quantitative proof of underlying business health. Dutch Bros reported a 29 percent year-over-year revenue increase in the fourth quarter of 2025. This top-line expansion was paired with a massive bottom-line profit surge for the full year, demonstrating that volume growth is translating directly to shareholder value.
These figures represent an acceleration rather than a momentary peak. The company has now recorded consecutive quarters of same-store sales expansion. This metric serves as clear evidence of intense, sustained consumer demand across both mature and newly established geographic markets.
Management expects this momentum to continue smoothly into the current financial year. Full-year 2026 revenue projections sit between $2.0 billion and $2.03 billion. This forward-looking stability provides a foundational safety net for investors evaluating the rapid scale of physical operations.
The baseline figures published in the official fourth quarter 2025 financial results confirm that the brand is achieving the internal sales velocity required to self-fund its aggressive expansion pipeline.
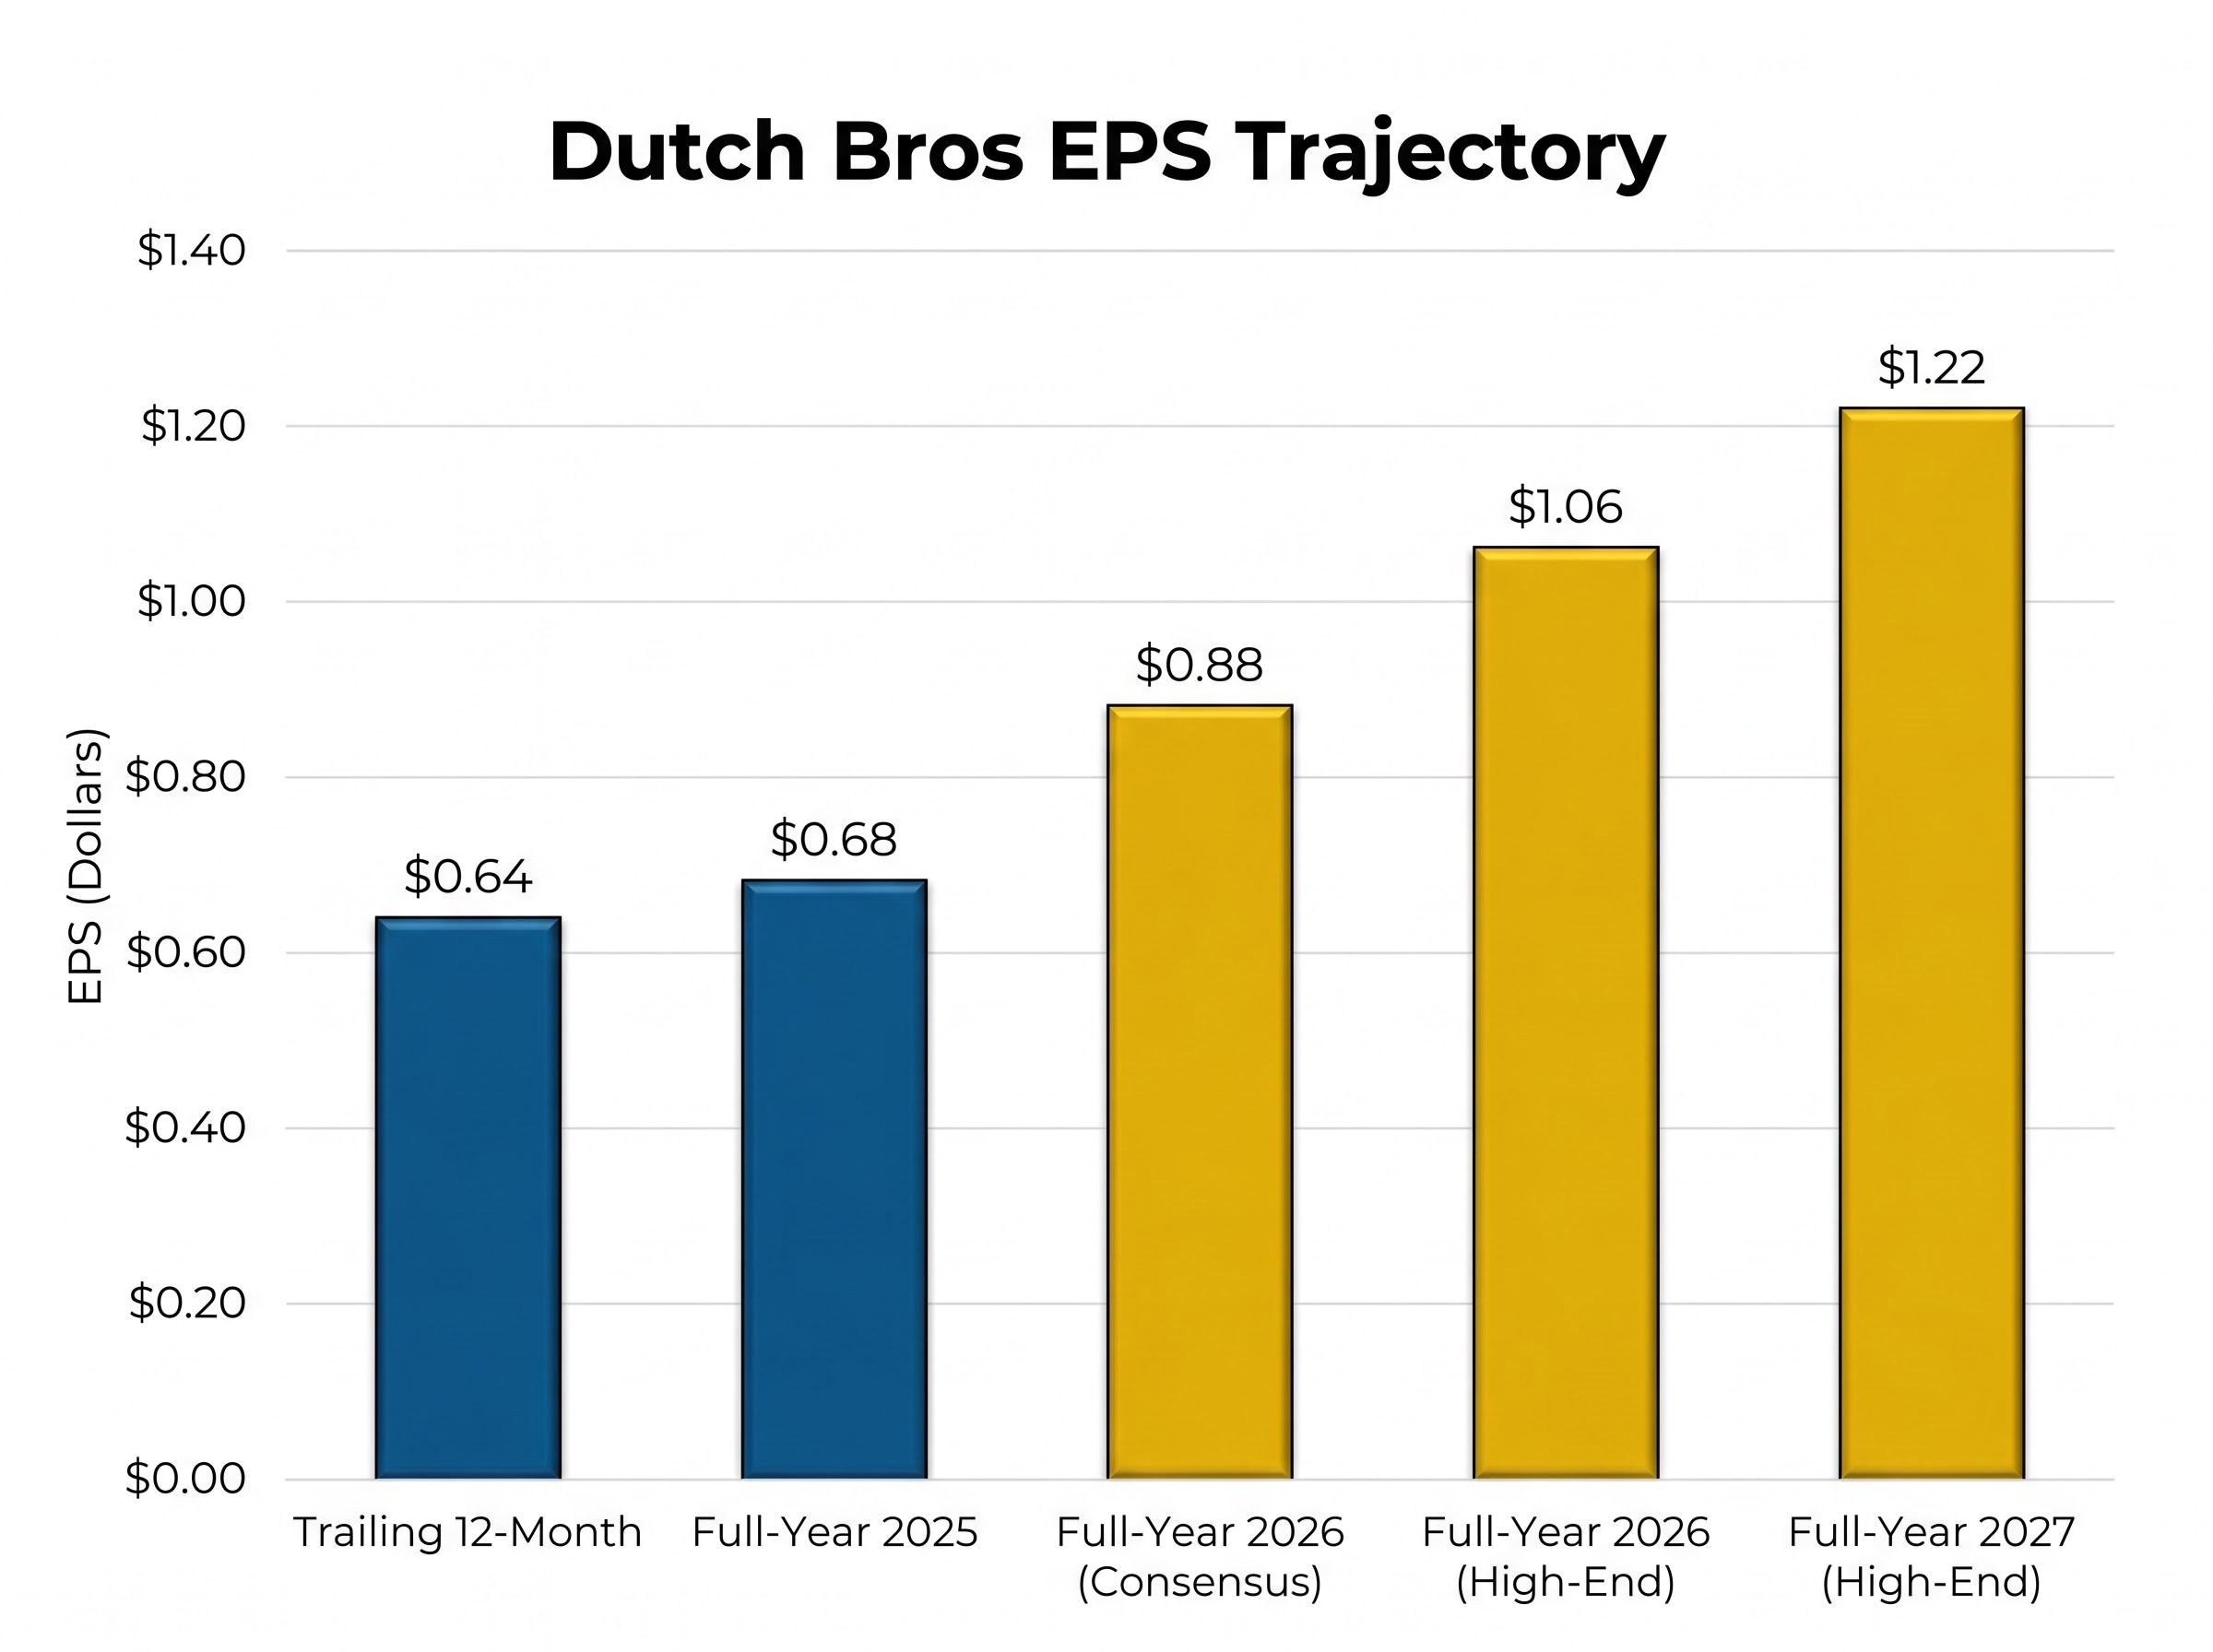
The progression of earnings demonstrates how operating leverage improves as the brand matures, reflecting a business that becomes more efficient as it scales:
Trailing 12-Month Performance: Earnings Per Share reached $0.64 Full-Year 2025: Final reported Earnings Per Share landed at $0.68 Full-Year 2026 Estimates: Consensus projections indicate a climb to $0.88, with some analyses modelling up to $1.06 Full-Year 2027 Forecasts: High-end institutional models suggest potential earnings of $1.22
Institutional investors rely on this quantitative proof that the core business is highly profitable before endorsing ambitious future expansion plans. The upward trajectory indicates that early capital investments are now yielding predictable, scalable cash flows.
Current profitability is merely the engine funding a massive geographic footprint expansion across the United States. The company concluded the fourth quarter of 2025 with 1,136 operational locations, representing a 16 percent increase from the same period in 2024. This established base serves as the launching pad for an aggressive unit growth strategy.
Translating abstract growth promises into concrete real estate development requires substantial capital deployment. Management has allocated between $270 million and $290 million in capital expenditures specifically for the 2026 development pipeline. This funding will support the construction of a minimum of 181 new shops this year alone.
The short-term buildout schedule connects directly to mid-term operational targets, making the ultimate domestic goal appear structurally plausible rather than speculative. By executing a disciplined regional infill strategy, the development team maintains supply chain efficiency while capturing new market share.
This clustering approach mirrors successful international franchise models, such as Collins Foods acquiring eight KFC restaurants in Bavaria to rapidly build localized supply chain density and capture immediate market share.
| Timeframe | Target Store Count | Key Development Metric |
|---|---|---|
| **End of 2025** | **1,136** locations | **16 percent** year-over-year operational growth |
| **Full Year 2026** | **1,317** projected minimum | At least **181** new shops backed by **$270M-$290M** capital expenditure |
| **Mid-Term 2029** | **2,029** locations | Sustained **15 percent** annual unit growth rate |
| **Long-Term Goal** | **7,000** locations | Total addressable market saturation target |
This concrete roadmap shows exactly how management is deploying capital to capture market share. These statements regarding future store counts are forward-looking and remain subject to commercial real estate availability and shifting economic conditions. However, the consistent historical execution provides a strong foundation for these targets.
Growth of this magnitude rarely trades at a discount. The equity currently carries a forward price-to-earnings ratio of roughly 53.9, a multiple that can initially appear steep to retail investors accustomed to traditional value metrics. Understanding why institutional capital willingly pays this premium requires looking at the mechanics of quick-service restaurant valuation.
This growth focused pricing stands in stark contrast to legacy peers, where analysts frequently update multi-year EPS estimates based heavily on cost reduction measures and margin recovery rather than pure footprint expansion.
In the hospitality sector, a high multiple is justified by economies of scale and consistent unit growth. Stagnant dividend stocks trade on current cash flow, but expansion-focused operators are priced on their future footprint. When a company repeatedly proves it can open new locations that achieve profitability within their first year, the market assigns a premium to that predictable scaling engine.
The overwhelming analyst consensus validates this underlying financial model. There are currently 25 covering analysts providing a consensus “Buy” rating, with an average price target of $75.65. This implies an estimated 42.6 percent upside from late-April levels, while high-end targets reach $85.
Recent institutional actions reinforce this stance. On April 10, 2026, UBS reiterated a “Buy” rating based on strong sales momentum, following a $66 target set by Telsey Advisory on April 8.
“The current valuation premium remains fundamentally supported by consistent 15 percent annual unit growth and highly predictable same-store sales expansion between 4 percent and 5.5 percent.”
This framework equips investors to recognise why a seemingly expensive asset might actually be fairly valued. The multiple reflects the mathematical reality of compounding physical store growth over a multi-year horizon.
While geographic expansion drives top-line revenue, the company possesses an internal growth catalyst that targets margin expansion at existing locations. The product mix has historically leaned heavily on beverages, with coffee representing 50 percent of sales and Rebel energy drinks accounting for 25 percent. The transition toward a diversified food offering acts as a hidden lever for future profitability.
Integrating complementary food items directly targets higher average ticket sizes. By convincing a morning coffee customer to add a baked good, the company extracts more value per transaction without needing to construct new stores or increase marketing spend. This operational efficiency is a vital metric for long-term commercial viability.
The rollout strategy prioritises careful testing and technological integration over rushed deployment:
This strategic integration ensures that kitchen operations do not slow down the necessary drive-thru throughput. By routing food purchases through the digital loyalty application, the company builds valuable consumer data profiles while simultaneously boosting daily profitability.
For investors exploring how digital loyalty programs impact legacy competitors, our detailed coverage of Starbucks’ strategic turnaround initiatives examines how enhanced rewards and operational efficiencies are being deployed to retain core customers.
Investors seeking exposure to the high-growth beverage sector must differentiate between direct-to-consumer physical operators and wholesale distribution brands. Companies like Celsius serve as popular comparative proxies for beverage growth, but they operate a fundamentally different consumer packaged goods model.
While both represent aggressive expansion plays, their risk profiles and structural advantages differ entirely. A wholesale brand relies on securing shelf space in grocery chains, leaving it vulnerable to distributor disputes and shifting retailer preferences. Conversely, an owned retail model controls the entire customer experience from supply to final transaction.
The drive-thru convenience model, paired with direct digital penetration via a proprietary application, creates a significant defensive moat.
| Metrics | Owned Retail Footprint | Consumer Packaged Goods |
|---|---|---|
| **Primary Sales Channel** | Proprietary drive-thrus and digital app | Third-party grocery and convenience stores |
| **Core Asset** | Secured real estate and loyal customer base | Brand intellectual property and distribution network |
| **Key Growth Driver** | New store construction and ticket size | Securing new retail shelf space agreements |
| **Primary Market Risk** | Real estate costs and quick-service competition | Supply chain disruptions and lost distributor contracts |
This comparison helps investors diversify their portfolios by distinguishing between physical real estate investments and distribution brands.
Scaling drive-thru real estate presents specific challenges that are difficult for new entrants to replicate. Securing high-traffic corner lots requires deep capital reserves and sophisticated municipal zoning expertise. Once established, intense brand loyalty protects the business from local independent competitors attempting to encroach on their territory.
This rising competitive pressure is being felt across the wider sector, with legacy operators taking note as Starbucks recently reported its strongest North American transaction growth in three years to defend its market share against emerging drive-thru rivals.
The case for absorbing the current valuation premium rests entirely on the company’s dual capacity for structural expansion and margin improvement. The estimated 42.6 percent upside potential projected by institutional analysts is rooted in the mathematical reality of a highly profitable footprint scaling rapidly across the country.
The upcoming May 6 earnings report will serve as the next primary catalyst to confirm that unit economics remain resilient. If management demonstrates continued progress toward the 181 planned store openings for 2026 while advancing the food integration programme, the path to a 7,000-location footprint becomes increasingly credible.
Ultimately, the commercial viability of buying into this vision relies on the defensive moat created by direct-to-consumer real estate.
Past performance does not guarantee future results, and financial projections are subject to market conditions and various risk factors. This article is for informational purposes only and should not be considered financial advice. Investors should conduct their own research and consult with financial professionals before making investment decisions.
Dutch Bros stock growth is driven by a massive 7,000-location expansion strategy across the United States, coupled with strong same-store sales and a significant profit surge in 2025.
Dutch Bros plans to open at least 181 new shops in 2026 with a capital expenditure of $270 million-$290 million, aiming for a total of 7,000 locations long-term.
The stock's high valuation premium is justified by its consistent 15 percent annual unit growth, predictable same-store sales expansion, and the proven ability to open new profitable locations.
The food integration strategy aims to expand margins by increasing average ticket sizes at existing locations, with systemwide deployment targeted by the end of 2026 after regional testing.
The next significant checkpoint for Dutch Bros is its first-quarter 2026 earnings report, scheduled for May 6.