Wall Street analysts reviewing the initial Fannie Mae earnings release on 29 April 2026 faced an immediate statistical contradiction. The government-sponsored enterprise reported an earnings per share figure of just $0.01, drastically missing the consensus estimate of $0.66. Despite this apparent top-line shortfall, overall net profit expanded during the three-month period.
Following the release of these first-quarter financial results, investors encountered a highly unusual set of headline numbers requiring deeper analysis. Institutional market participants are now looking past top-line misses to understand the actual operational health and accounting shifts driving modern mortgage enterprise stability. By analysing balance sheet fundamentals, readers can identify how structural efficiencies often mask superficial revenue weakness.
Dissecting the Revenue Drop and Bottom Line Growth
The initial reaction to a massive earnings per share miss typically triggers steep sell-offs across major equities. Yet the flat share price reaction during extended trading signalled that institutional investors immediately looked past the headline shortfall. The underlying financial documents revealed exactly why market participants held their positions rather than retreating.
The official Fannie Mae quarterly financial results detail the underlying metrics that kept institutional investors confident, demonstrating absolute net income resilience over raw gross revenue generation.
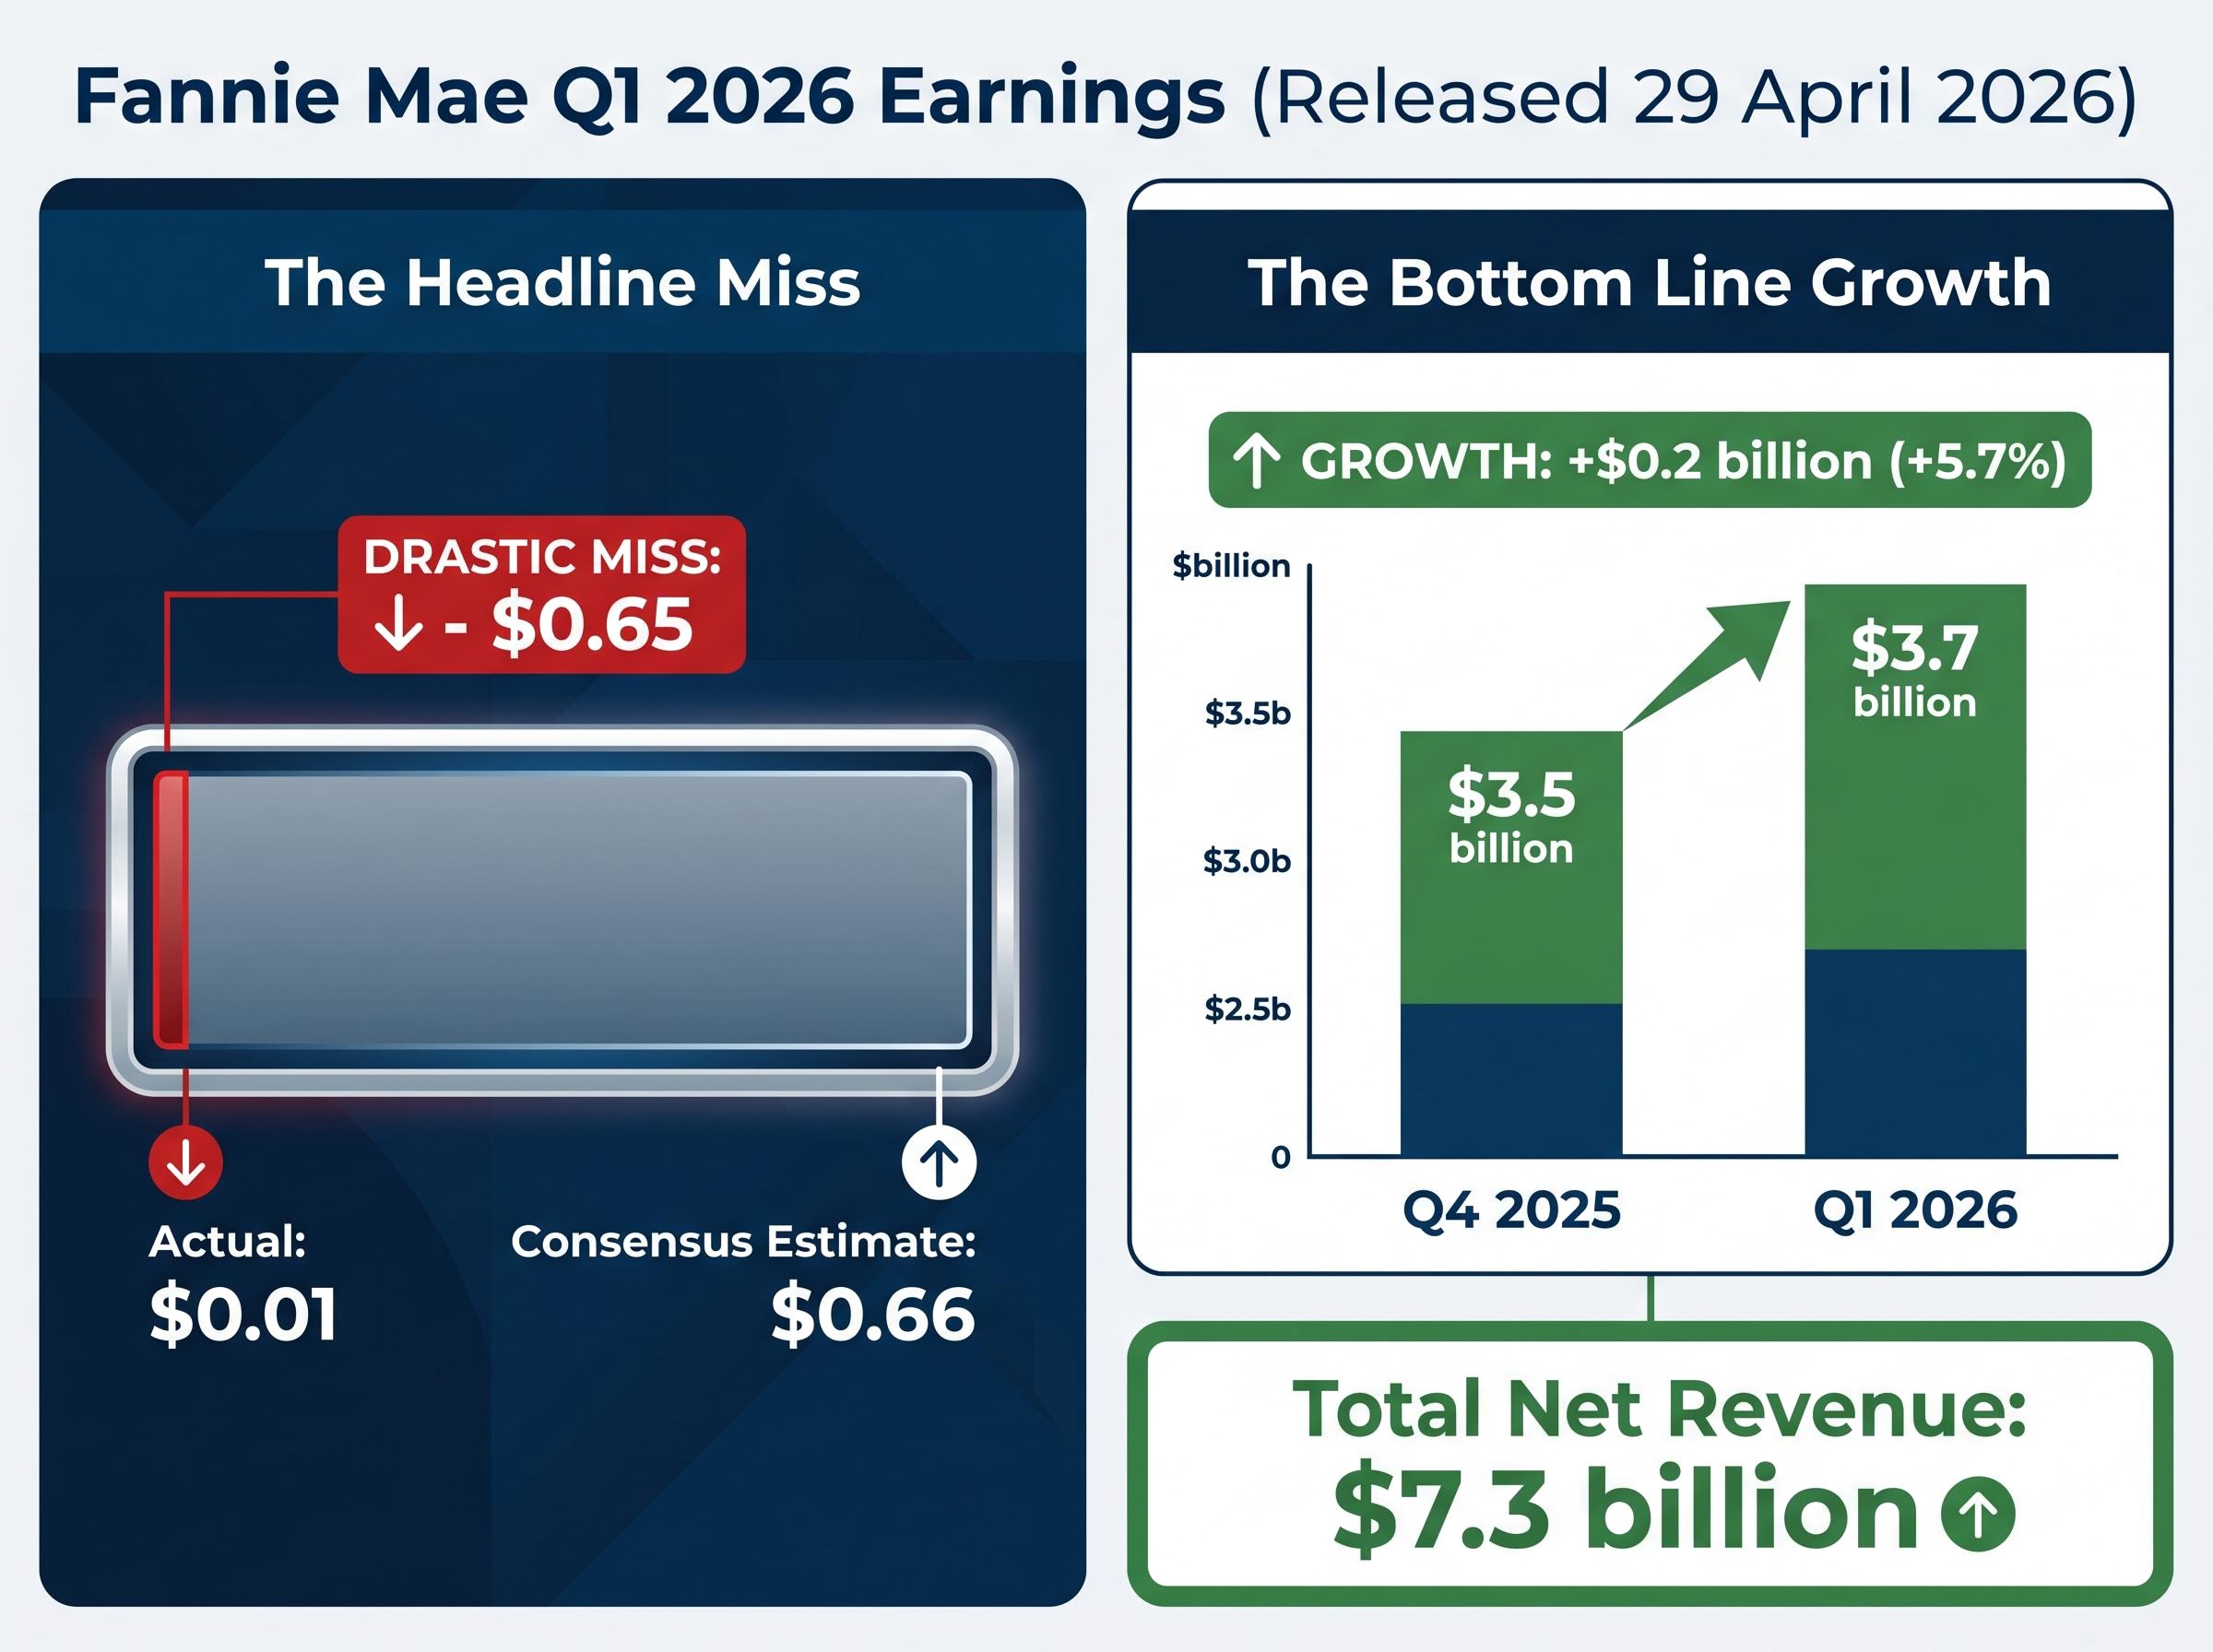
While adjusted earnings per share landed at $0.01 against the anticipated $0.66 consensus, overall profitability told a completely different story. Total net revenue reached $7.3 billion. However, overall net profitability actually climbed to $3.7 billion, an increase from the $3.5 billion secured in the final quarter of 2025.
This important counterweight of net profitability demonstrates that headline misses do not automatically equate to structural failure. According to industry analysis, highly regulated financial entities frequently rely on net income stability over gross revenue expansion to weather fluctuating market conditions. The metrics below illustrate this exact divergence between revenue compression and bottom-line growth.
| Financial Metric | Q4 2025 | Q1 2026 |
|---|---|---|
| Net Revenue | Not Reported | $7.3 billion |
| Net Income | $3.5 billion | $3.7 billion |
| Earnings Per Share | Not Reported | $0.01 |
| Net Worth | $109.0 billion | $112.7 billion |
When big ASX news breaks, our subscribers know first
The Mechanics of Manufactured Profitability
To understand how net income grows while revenue falls, investors must look at how large financial institutions manufacture bottom-line success through non-operational accounting shifts. Underlying drivers such as fair value shifts are not specified. When a financial entity adjusts the recorded value of its assets from deficits to positive valuations, this accounting movement creates an on-paper profit.
A fair value shift simply means the current market price of the company’s existing investments has increased. This adjustment flows directly to the bottom line without requiring any new property sales or mortgage originations. Alongside these accounting adjustments, leadership pulled a deliberate operational lever by aggressively reducing corporate overhead.
Corporate administrative expenses dropped by 19% sequentially, falling to $745 million. These two internal mechanisms successfully bridged the gap left by falling top-line revenue. By cutting costs and benefiting from favourable asset revaluations, the enterprise secured its profitability.
Two distinct drivers manufactured this quarterly profit stability: Positive fair value valuation shifts on existing balance sheet assets Aggressive reductions in core administrative and overhead expenses
Chairman William J. Pulte noted this transition, highlighting that the company is now operating under a significantly leaner model. This execution discipline ensures profitability remains intact even when transaction volumes compress.
“Fannie Mae’s first quarter net income of $3.7 billion reflects the health of our guaranty business, the discipline of our execution, and the strength of our balance sheet,” stated Acting CEO Peter Akwaboah.
Diverging Fortunes in Single and Multifamily Markets
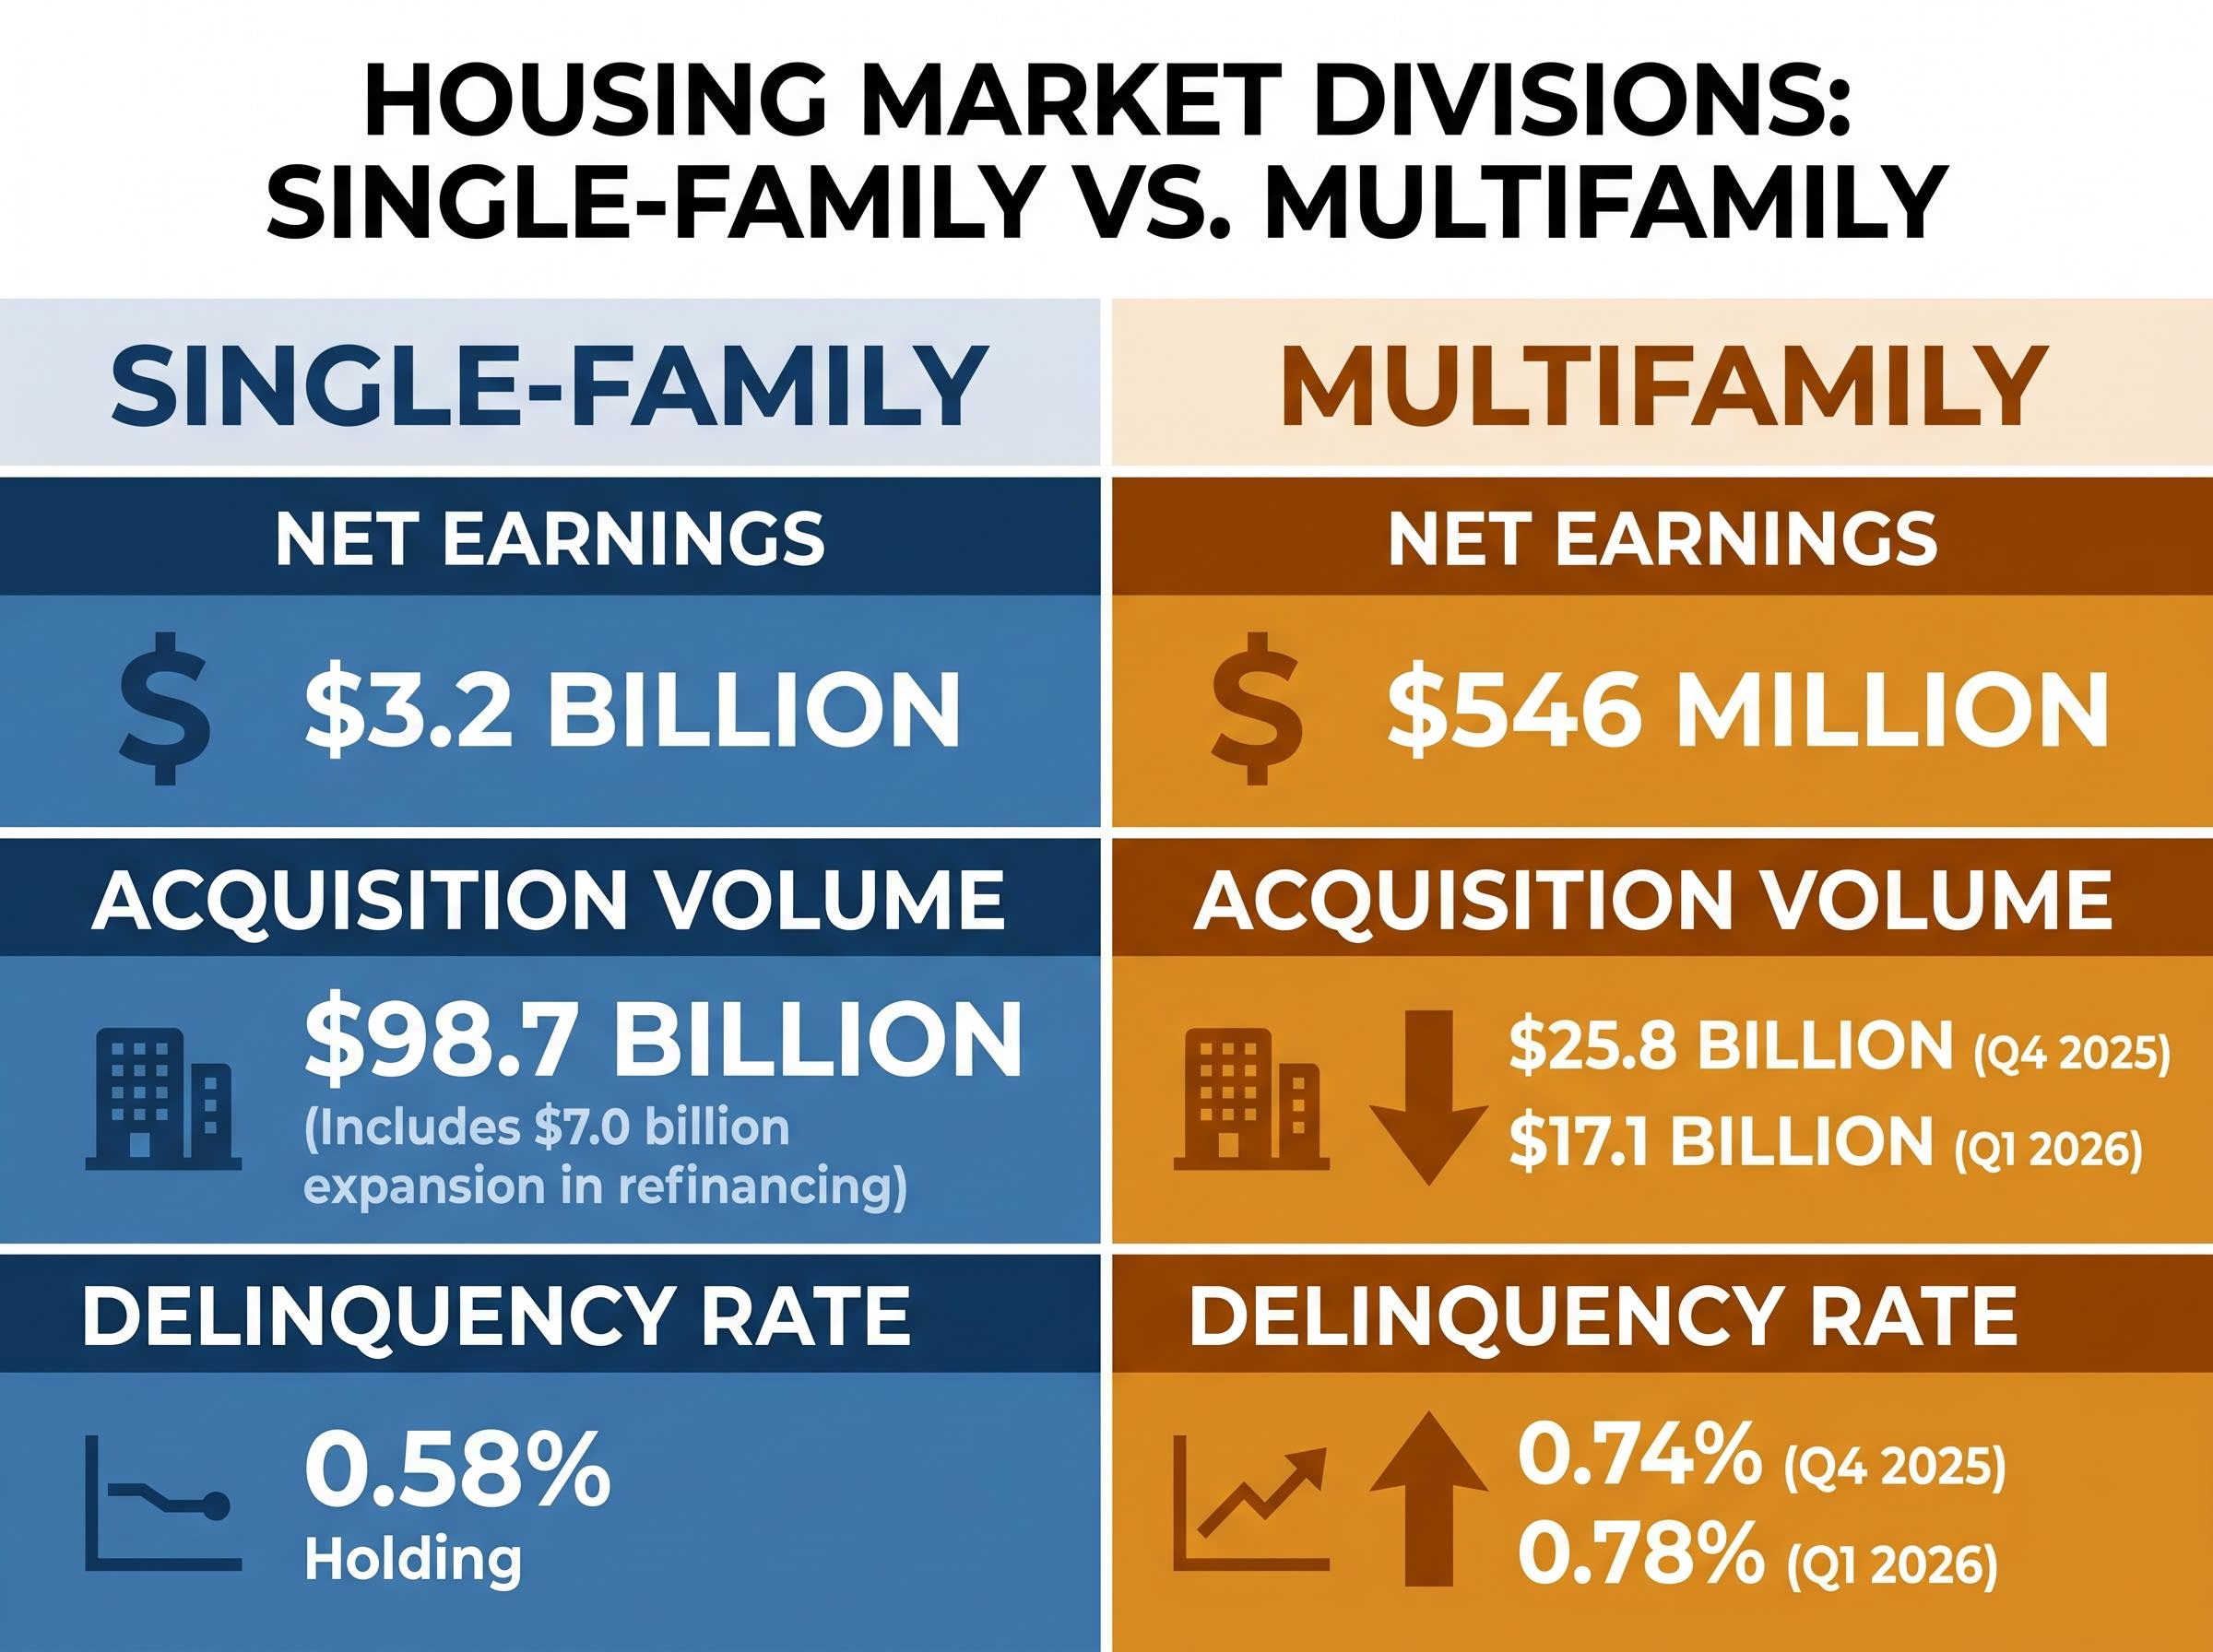
The overarching corporate profitability masked a clear bifurcation developing within the broader United States real estate market. The single-family division demonstrated remarkable resilience, anchored by steady mortgage renewal activities that supported overall acquisition volumes. According to estimates, single-family purchases grew to $98.7 billion, aided directly by a $7.0 billion expansion in refinancing transactions.
This sustained momentum pushed single-family net earnings to an impressive level for the quarter. Single-family severe delinquencies also held steady at a manageable level, indicating that residential homeowners are maintaining their payment obligations. The data indicates that everyday consumers continue to absorb current interest rates without defaulting on their home loans.
However, broader macroeconomic indicators suggest this US consumer strength may be increasingly reliant on rapidly depleting household savings rather than sustainable income growth.
Examining the Multifamily Slowdown
The narrative pivots sharply when examining the commercial and multifamily housing sectors. Multifamily acquisitions plummeted from $25.8 billion in the fourth quarter of 2025 to just $17.1 billion in the first quarter of 2026. This significant drop in purchasing volume highlights mounting stress in commercial housing assets across the country.
The multifamily delinquency rate also climbed to 0.78%, an increase from 0.74% in the prior quarter. This rising metric serves as an early warning sign of credit stress that market participants must watch in upcoming reporting periods. These payment delinquencies restrict segment profitability.
The divergence signals that while the residential United States housing market remains stable, the commercial sector faces tightening financial conditions.
| Division | Net Earnings | Acquisition Volume | Delinquency Rate |
|---|---|---|---|
| Single-Family | $3.2 billion | $98.7 billion | 0.58% |
| Multifamily | $546 million | $17.1 billion | 0.78% |
The Historic Accumulation of the Capital Buffer
Moving beyond short-term quarterly mechanics reveals the profound scale of the enterprise’s accumulated capital buffer. By late March 2026, cumulative net worth reached a new milestone of $112.7 billion, serving as the ultimate indicator of institutional stability. The enterprise has systematically accumulated net worth, transforming its financial foundation entirely.
Compliance with the FHFA enterprise regulatory capital framework necessitates this massive liquidity retention, safeguarding the broader housing market against systemic shocks.
Chief Financial Officer Chryssa C. Halley emphasised that this strategic capital positioning actively supports the core housing mission regardless of immediate macroeconomic pressures. A larger capital buffer ensures the entity can continue purchasing mortgages from lenders during economic downturns. During this three-month span alone, the organisation successfully funded transactions.
The timeline of this capital accumulation demonstrates structural resilience:
- Early 2020 marked the beginning of aggressive capital retention strategies
- The fourth quarter of 2025 concluded with a net worth of $109.0 billion
- The first quarter of 2026 pushed total net worth to $112.7 billion
This long-term context reassures investors that the United States mortgage market foundation remains historically well-capitalised. Short-term revenue fluctuations pose minimal systemic risk when backed by a capital reserve of this magnitude.
What a Leaner Balance Sheet Signals for Future Quarters
The first-quarter performance proves that operational efficiency and aggressive expense management can successfully mask top-line revenue weakness. By drastically lowering administrative costs, the enterprise has positioned itself to maintain strong net profitability throughout the remainder of 2026. A leaner corporate structure provides necessary flexibility to absorb potential market shocks without compromising the underlying balance sheet.
Market participants must look past basic revenue figures and monitor the specific pressure points forming within the commercial housing sector. The rising multifamily delinquency trends demand close attention, as they represent the most immediate risk to future quarterly earnings. Investors evaluating the broader real estate sector should prioritise these credit quality indicators over straightforward acquisition volumes.
For investors looking beyond real estate to assess how overarching economic pressures might impact their broader portfolios, our comprehensive walkthrough of equity market warning signals details the historical correlations between energy spikes, geopolitical stress, and subsequent S&P 500 declines.
This article is for informational purposes only and should not be considered financial advice. Investors should conduct their own research and consult with financial professionals before making investment decisions. Past performance does not guarantee future results. Financial projections are subject to market conditions and various risk factors.