
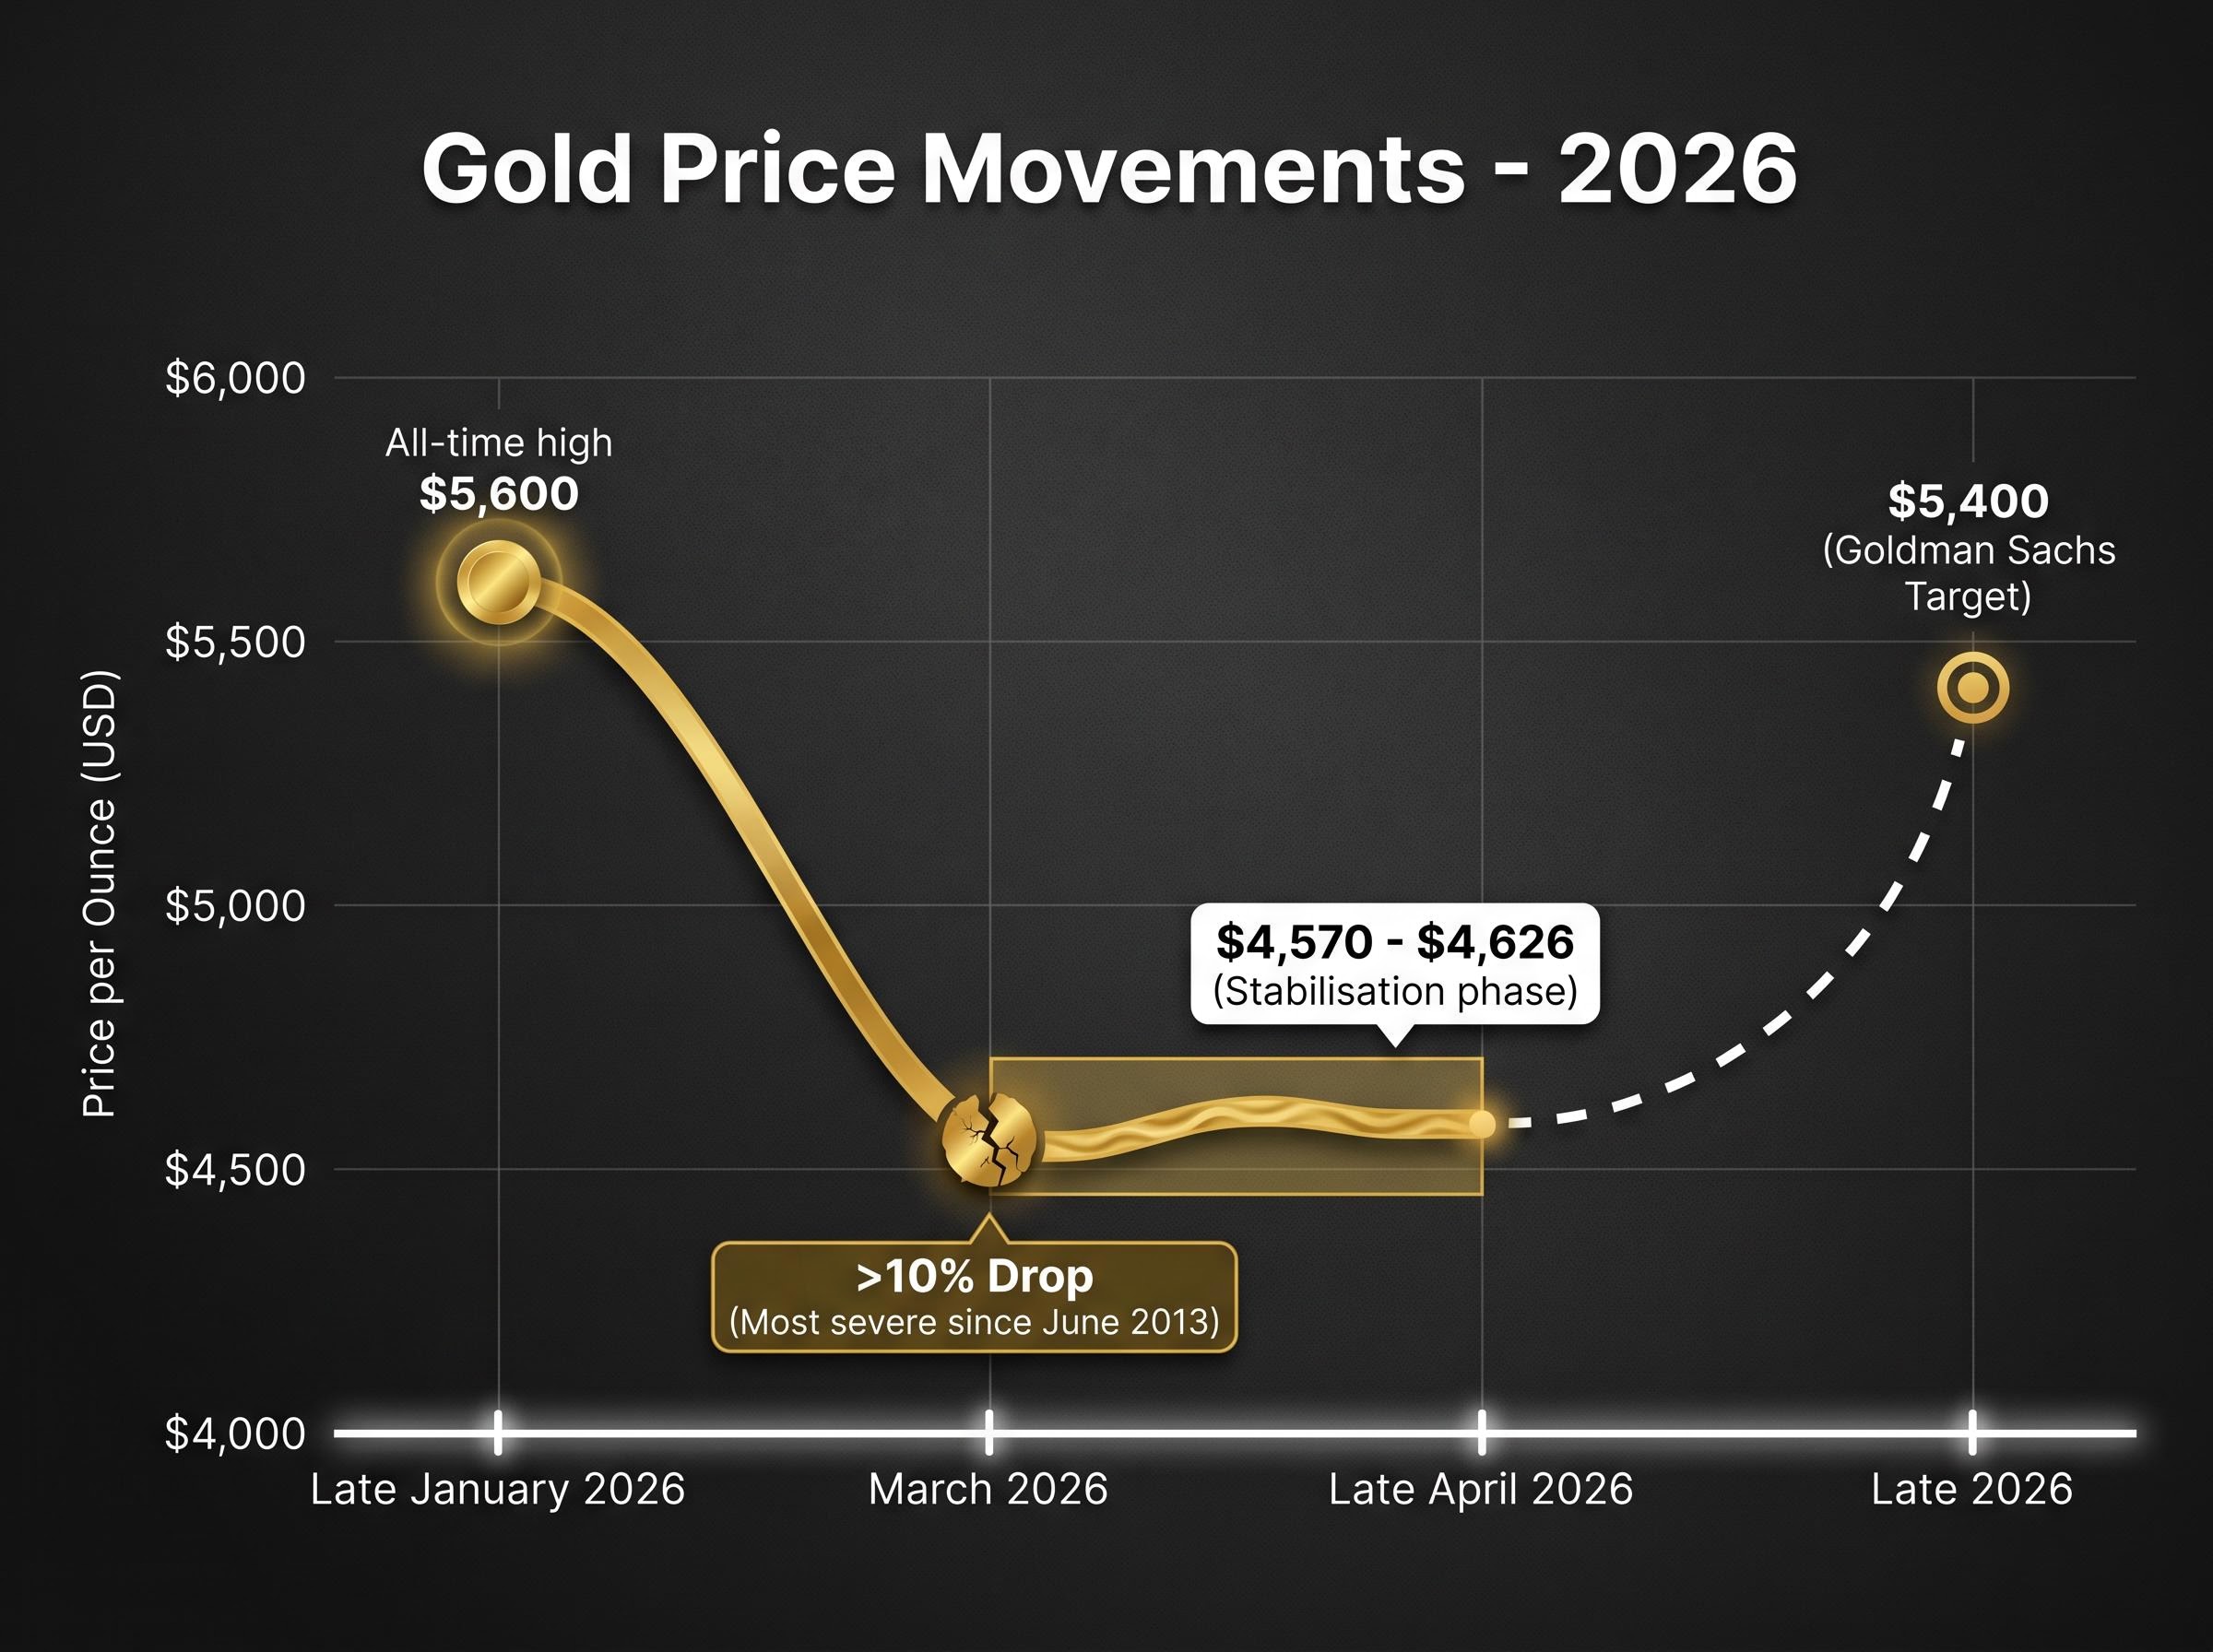
Global spot gold prices hovered between $4,570 and $4,626 per ounce on Wednesday, presenting a stark contrast to the $5,400 late-2026 target reaffirmed by Goldman Sachs. As markets close out April 2026, investors are still navigating the volatility left behind by a severe March sell-off and ongoing tensions in the Middle East.
Understanding the prevailing gold price prediction frameworks requires unpacking a complex mix of institutional forecasts, central bank activity, and macroeconomic triggers. This breakdown details the fundamental drivers and institutional models that will dictate precious metal valuations over the next 18 months.
The $5,400 Affirmation Amid a $4,600 Reality
Goldman Sachs strategists Lina Thomas and Daan Struyven have officially maintained their $5,400 per ounce valuation objective for late 2026. This bullish stance stands in sharp contrast to the recent turbulence that has defined retail trading over the past eight weeks. The market experienced an over 10% drop in March 2026, marking the most severe decline since June 2013.
Despite current stabilisation around the $4,570 to $4,626 range, the structural bullish case remains fully intact according to institutional analysis. The timeline of recent price action illustrates the gap between current market pricing and institutional expectations:
As broader equity indexes simultaneously trigger historic stock market warning signals due to deteriorating economic conditions, precious metals retain their intrinsic appeal for defensive portfolios.
Late January 2026: Prices reached an all-time high of approximately $5,600 per ounce. March 2026: A sharp retail sell-off triggered an over 10% decline in global spot prices. * Late April 2026: Markets entered a stabilisation phase, trading consistently between $4,570 and $4,626.
Investors can use this timeline to contextualise recent losses against a broader recovery narrative. While earlier assessments suggested an immediate rebound nearing $5,000, the current consolidation phase does not alter the fundamental drivers supporting the year-end target.
When big ASX news breaks, our subscribers know first
How Sovereign Accumulation Establishes a Market Floor
Retail trading volumes represent only one part of the global market equation. Central bank purchasing serves as the primary structural pillar for high gold valuations, establishing a hidden price floor beneath daily retail noise. National financial institutions continuously accumulate reserves, providing consistent demand that counteracts retail sell-offs.
This sovereign accumulation does not move in a straight upward line. Buying patterns exhibit monthly fluctuations based on extreme valuation swings and emerging market liquidity needs. Logistics also play a role, with national institutions typically showing a preference for utilising Bank of England facilities in London before vaulting assets domestically.
February data demonstrates this ongoing institutional activity, with central banks recording 27 tonnes of net purchases. Poland led this accumulation by acquiring 20 tonnes during the month. Analysts project total central bank purchases for 2026 will reach between 750 and 850 tonnes, averaging roughly 63 tonnes per month.
Industry analysis of World Gold Council compilation data validates this persistent sovereign appetite, confirming that nations like Poland are prioritising hard asset accumulation over immediate yield generation.
April 23 Central Banking Conference Survey Recent survey data indicates participating institutions anticipate worldwide sovereign holdings will expand this year, predicting values will remain above $5,000 per ounce.
This structural demand explains why institutional analysts remain confident despite recent market contractions. Sovereign buyers operate on multi-year timelines, prioritising asset diversification over short-term price movements.
The Monetary Mathematics of Federal Reserve Easing
Macroeconomic policy provides the second foundational pillar for institutional forecasts. The relationship between United States monetary easing and precious metal pricing is highly correlated, as lower interest rates reduce the opportunity cost of holding non-yielding assets. The Goldman Sachs economic baseline model relies specifically on this dynamic.
Their current forecast incorporates Federal Reserve rate reductions totalling 50 basis points for 2026. This expected policy shift translates directly into price targets through a specific sequence of market reactions:
- The Federal Reserve announces a confirmed rate reduction, confirming a shift toward looser monetary policy.
- Yields on conservative fixed-income assets, such as government bonds, decline in response to the lower benchmark rate.
- Capital rotates out of lower-yielding bonds and into alternative assets, providing approximately $120 per ounce of direct price support for every 50 basis points of reduction.
Broader market projections regarding the Federal Reserve remain sharply divided. Expectations currently range from zero cuts, with rates holding steady until 2027, to two separate cuts totalling 25 to 50 basis points. Investors can adjust their own portfolio expectations based on this mathematics, understanding exactly how much upside is vulnerable if the Federal Reserve delays action.
The March 2026 Federal Reserve economic projection summaries reveal a cautious consensus among policymakers, forcing traders to constantly recalibrate their models as inflation data fluctuates.
Wall Street Divergence on Precious Metal Valuations
The Goldman Sachs affirmation sits within a wider institutional rotation into safe-haven assets. Comparing major financial institutions reveals a detailed spectrum of valuation expectations for the remainder of the year. Top-tier investment banks maintain exceptionally bullish positions, while broader industry averages remain distinctly conservative.
This divergence occurs alongside increasing private sector diversification into the asset class. Wealth managers are mirroring central bank behaviour, allocating capital to precious metals as a hedge against macroeconomic instability. The resulting forecast spectrum shows a significant gap between aggressive outliers and cautious baseline models.
Family offices and private funds are actively implementing institutional defensive strategies that prioritize capital preservation over aggressive equity exposure during periods of heightened global volatility.
| Institution | Q1 to Q3 Peak Target | Year-End Target | General Stance |
|---|---|---|---|
| JPMorgan | Not specified | $6,300 | Highly Bullish |
| UBS | $6,200 | $5,600 | Bullish |
| Goldman Sachs | Not specified | $5,400 | Bullish |
| Broader Industry Average | Not specified | $4,323 | Conservative |
By evaluating this range of institutional forecasts, investors can better weigh the current consolidation phase against longer-term projections.
Geopolitical Premiums and Near-Term Hazards
Institutional targets rely on macroeconomic fundamentals, but short-term volatility is consistently driven by geopolitical premiums. Escalating conflict risks, persistent inflation fears, and broader United States dollar weakness are currently pushing alternative asset adoption. Tangible conflict risks force capital into safe-haven positions regardless of retail market sentiment.
The current geopolitical narrative is firmly centred on Middle Eastern escalations. Ongoing Iran-related conflicts serve as a primary catalyst, highlighted by the recent oil tanker incident near Dubai. Analysts stress that there are no material safe-haven drivers tied to regions like Venezuela or Greenland, contrary to some market misconceptions.
While conflict drives accumulation, investors must also account for sudden financial hazards. Goldman Sachs has issued clear warnings regarding potential near-term value declines driven by unexpected private-market liquidations.
Navigating Liquidation Risks in Correlated Markets
Short-term hazards often materialise when broader stock and bond sectors experience sudden downturns. During a severe equity market sell-off, investors may face margin calls on their leveraged positions.
To cover these immediate capital requirements, institutions will execute forced selling of their liquid alternative assets, including precious metals. This mechanism explains why gold prices can temporarily collapse alongside equities during a liquidity crisis, even when the structural safe-haven thesis remains sound.
For readers wanting to understand the mechanics behind sudden equity downturns, our full explainer on algorithmic market correction risk details how automated trading models handle qualitative geopolitical threats and physical supply shocks.
Final Outlook for the Late 2026 Precious Metals Horizon
The tension between the aggressive $5,400 structural target and the current $4,600 stabilisation phase defines the market heading into the second half of 2026. Long-term sovereign buying continues to provide an unbreakable floor beneath the asset class, insulating it from terminal decline. Conversely, Federal Reserve interest rate decisions and Middle Eastern geopolitical tensions will dictate how quickly prices can challenge previous ceilings.
Investors should monitor upcoming central bank purchasing reports and Federal Reserve policy statements to gauge the trajectory of these baseline models.
This article is for informational purposes only and should not be considered financial advice. Past performance does not guarantee future results.
Financial projections are subject to market conditions and various risk factors. Investors should conduct their own research and consult with financial professionals before making investment decisions.