Lululemon Plunges 12% on CEO Pick Amid Activist Investor Battle
2 hrs ago

The April reporting cycle presents a critical test for defence and infrastructure contractors. It separates firms chasing sheer volume from those mastering operational efficiency. A compelling divergence emerged on April 29, 2026, when Parsons released its latest quarterly financial results.
A surface-level reading of the initial Parsons earnings data reveals a 4 percent contraction in top-line revenue compared to the previous year. However, according to company data, the firm simultaneously delivered a striking 10-cent earnings per share beat, complicating the immediate market narrative. This gap between aggregate sales volume and bottom-line profitability reveals how investors are pricing the current defence contracting landscape.
Capital allocators increasingly reward margin expansion over unprofitable growth. What follows is a comprehensive breakdown of the underlying factors driving these financial results, offering clarity on the health of the company’s baseline business. The analysis separates isolated project headwinds from structural momentum to evaluate the firm’s true commercial trajectory.
The immediate financial results present a stark contradiction between shrinking sales and expanding profitability. Total revenue fell to $1.5 billion, representing a 4 percent annual decrease and an 8 percent organic contraction. Such a top-line decline typically signals fundamental distress within a contracting portfolio.
Instead, according to company data, the firm reported first-quarter adjusted earnings per share of $0.79, comfortably exceeding the $0.69 consensus estimate. This earnings beat points directly to historic operational efficiency rather than simple cost-cutting. According to company data, adjusted EBITDA reached an unprecedented $151 million, representing a 1 percent annual increase despite the smaller revenue base.
The magnitude of this earnings beat immediately caught the attention of institutional traders, contributing to a pre-market stock surge as markets digested the improved margins.
Profitability margins expanded by 50 basis points to a historical maximum of 10.1 percent. According to company data, the company also improved its capital mechanics, with operating cash flow utilisation tightening to $4 million. This represents a significant improvement from the $12 million recorded in the first quarter of 2025.
| Metric | Q1 2026 Reported Result | Analyst Estimate or Prior Year Result |
|---|---|---|
| Adjusted Earnings Per Share (EPS) | $0.79 | $0.69 (Consensus Estimate) |
| Total Revenue | $1.5 billion | 4% decrease (Prior Year Result) |
| Adjusted EBITDA Margin | 10.1% | 9.6% (Prior Year Result) |
Investors must determine whether a revenue miss is a structural failure or a temporary anomaly. By extracting more profit from fewer dollars, the firm demonstrated highly efficient capital execution. Company leadership highlighted this organisational resilience alongside the improved cash utilisation metrics.
CEO Commentary “Our record profitability margins and strong cash performance this quarter demonstrate the durability of our organisation, allowing us to deliver enhanced shareholder value even as we navigate isolated top-line fluctuations,” said Carey Smith, Chief Executive Officer.
Understanding the discrepancy between a sobering statutory reality and a celebrated operational beat requires a clear accounting framework. Generally Accepted Accounting Principles (GAAP) net income provides a strict, standardised view of total corporate profitability. Adjusted earnings metrics strip out specific non-recurring or non-operational costs to reveal the recurring baseline performance.
To prevent misleading public disclosures, the SEC guidance on non-GAAP measures requires companies to provide clear reconciliations that map these adjusted figures back to their statutory equivalents.
Defence and infrastructure contractors rely heavily on adjusted EBITDA to communicate their core operational health to the market. According to company data, in the first quarter, total net income dropped by 20 percent to settle at $53 million. This figure contrasts sharply with the record adjusted EBITDA of $151 million reported for the same period.
Total net income can fall significantly while adjusted metrics hit record highs because statutory accounting forces companies to recognise paper losses immediately. Acquisition-related expenses also weigh heavily on GAAP figures before providing actual operational benefits. By removing these variables, analysts can make more accurate commercial evaluations of the underlying stock.
Common non-operational items that typically drag down GAAP net income but are excluded from adjusted EBITDA calculations include:
Amortisation of intangible assets acquired through corporate mergers Stock-based compensation expenses for executive and employee retention Restructuring costs associated with facility closures or workforce realignments One-time legal settlements or regulatory compliance penalties
Understanding how to interpret these divergent metrics empowers investors to look past temporary accounting noise. It prevents casual observers from being misled by jargon-heavy financial reports.
The mystery of the aggregate revenue miss clarifies significantly when examining the exact source of the contraction. Management data indicates the top-line decline was driven almost entirely by lower volume on a single fixed-price confidential contract. This specific classified project caused corporate operating income to drop 12 percent to $96 million.
Fixed-price contracts carry unique structural risks, as revenue recognition scales directly with project volume regardless of broader corporate performance. Removing this isolated headwind reveals a fundamentally different corporate growth narrative. Excluding the classified project, total sales across the enterprise actually expanded by 8 percent annually.
Official GAO assessments of fixed-price contracts consistently highlight how these rigid agreements expose defence entities to margin compression when execution timelines face unexpected delays.
The Federal Solutions segment demonstrates this resilience most clearly. When removing the confidential contract from the calculation, the division saw revenue increase by 12 percent, including a 4 percent organic expansion rate. This data proves that the core business is not deteriorating, but rather absorbing a concentrated, isolated shock.
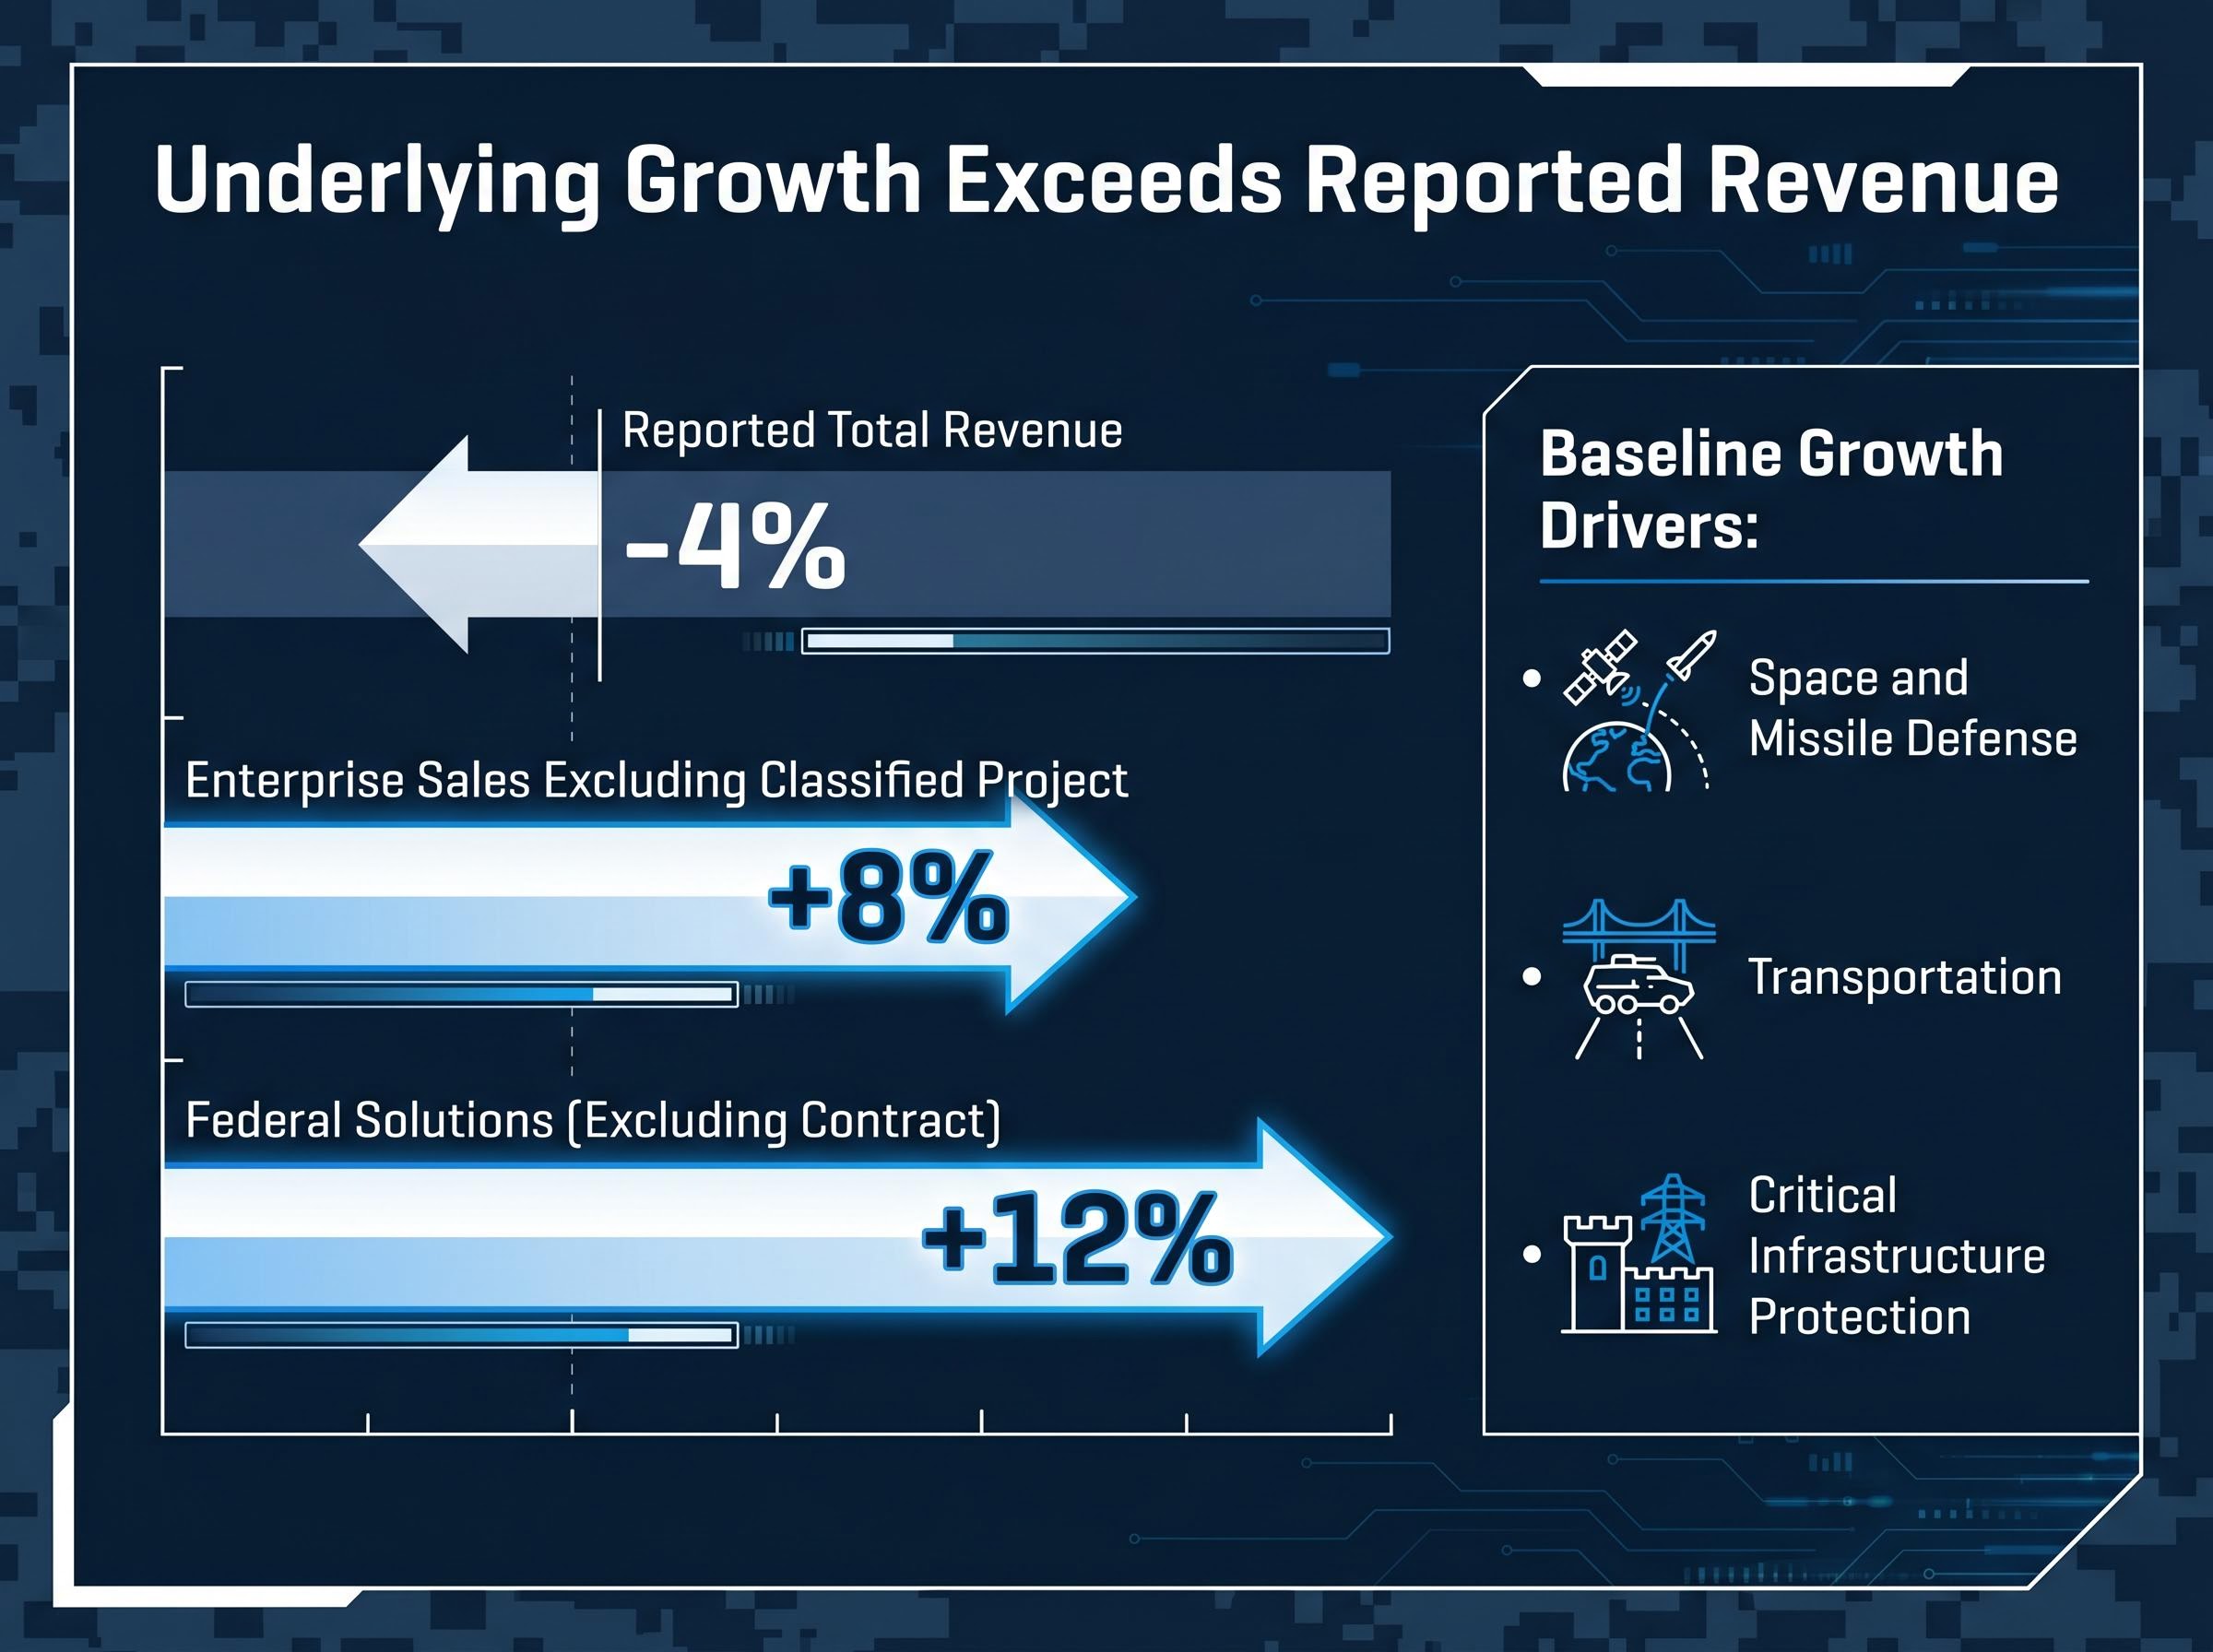
The underlying baseline expansion relies on consistent performance across several key operational pillars. The specific divisions driving this baseline growth include:
Space and Missile Defense Transportation * Critical Infrastructure Protection
Commercial readers evaluating defence portfolios often penalise stocks for opaque classified delays. However, this isolation of the revenue drag is the most crucial component of current risk assessment. It shifts the analytical perspective from aggregate concern to underlying reassurance.
The firm is successfully expanding its primary operational footprint while navigating a specific bottleneck in its classified portfolio. This demonstrates that the core service offering remains highly competitive in the open market.
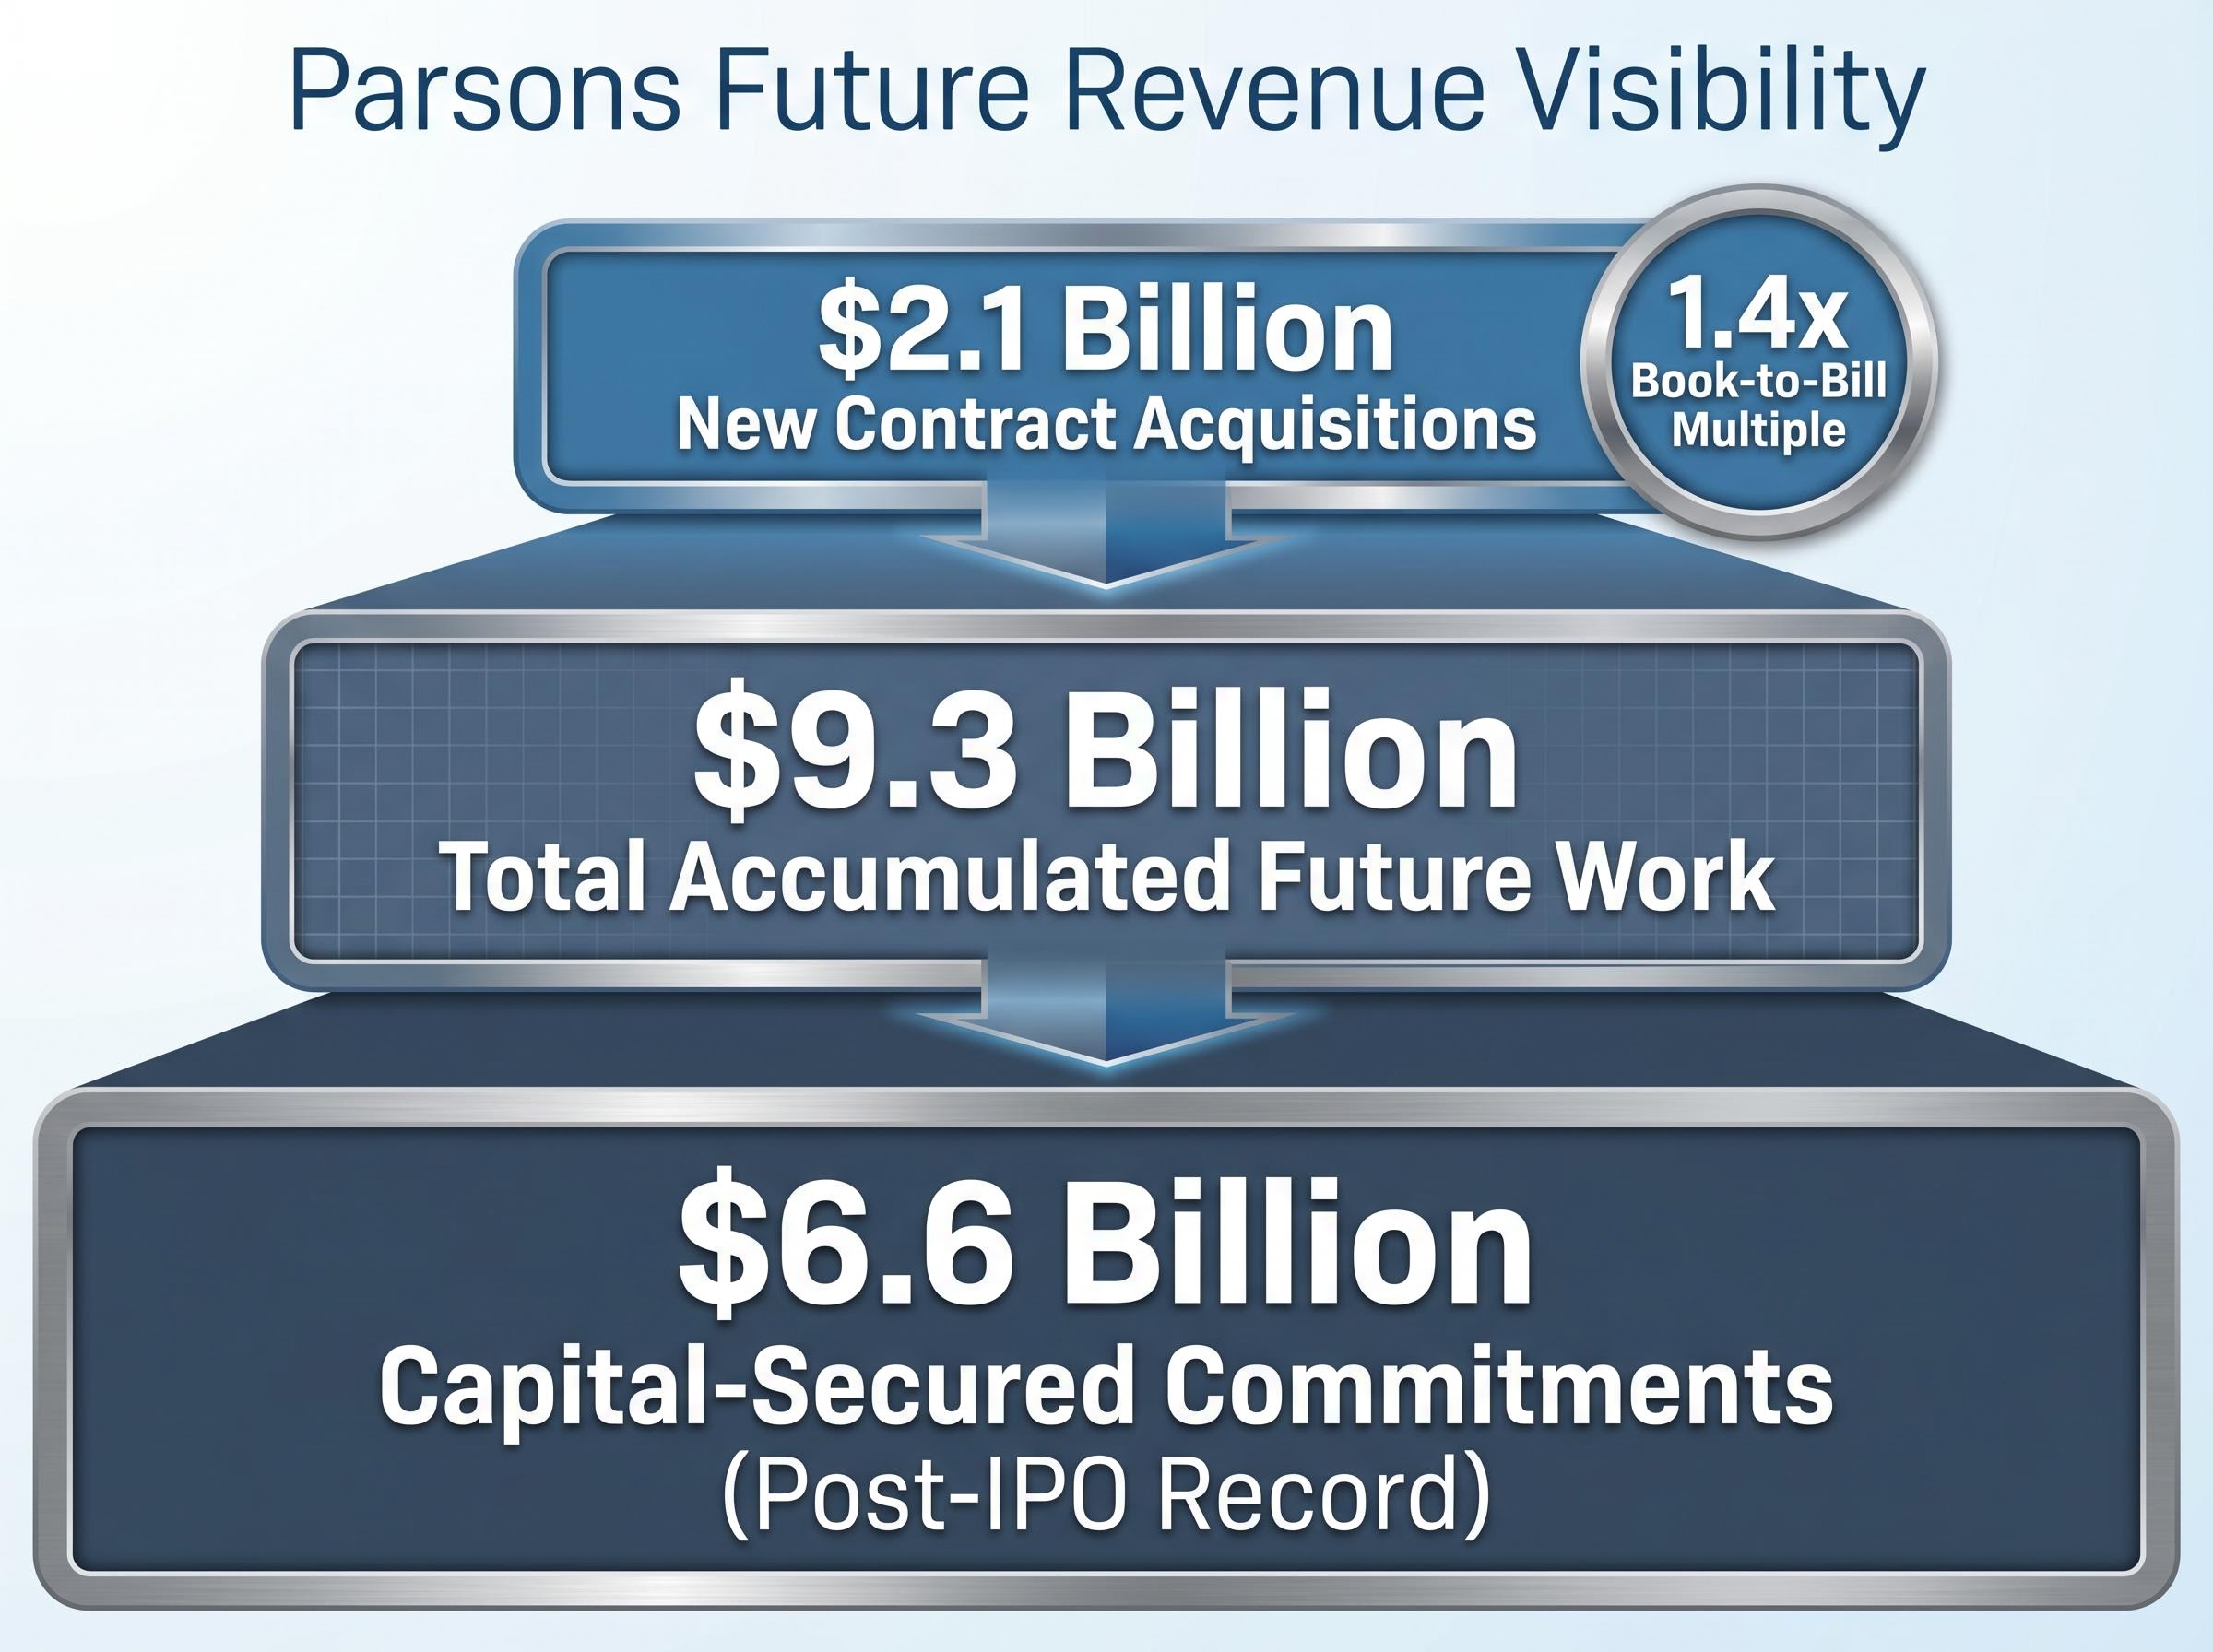
Past operational efficiency provides a foundation, but future revenue visibility offers the ultimate downside protection for the current stock valuation. The company demonstrated a robust ability to secure new work relative to the work it completes. According to company data, it captured new contract acquisitions of $2.1 billion during the quarter.
This generated a strong 1.4x book-to-bill multiple, indicating that demand continues to outpace the rate of project completion. According to company data, total accumulated future work reached $9.3 billion at the end of the quarter. According to company data, within this total, capital-secured commitments hit a post-IPO record of $6.6 billion.
Evaluating defence contractor backlogs requires monitoring this precise multiple; sustained metrics above 1.0x confirm that a firm is winning new agreements significantly faster than it fulfills existing obligations.
This unprecedented project backlog insulates the firm against near-term macroeconomic volatility. It provides analysts with highly reliable revenue projections, limiting the potential for unexpected downside surprises. Wall Street maintains a highly positive view of these forward indicators.
The analyst consensus currently features an “Overweight” rating with an average price target of $74.80. Notably, Truist raised its price target to $85 just days before the earnings release on April 20, 2026. The stock closed at $51.66 on April 29, 2026, marking a modest 0.32 percent gain on earnings day.
This mild market reaction reflects a stock consolidating its broader upward trajectory leading into the release, rather than a negative assessment of the quarterly data.
According to company data, management maintained its full-cycle revenue projections between $6.5 billion and $6.8 billion for the fiscal year. According to company data, the $6.65 billion guidance midpoint sits slightly beneath the market consensus expectation of $6.665 billion. Maintaining steady guidance rather than raising it is a common conservative posture in the defence sector during the first quarter.
This approach preserves corporate flexibility while allowing the historic backlog to dictate the true pace of future revenue realisation. It signals to investors that the firm prefers to exceed expectations rather than adjusting targets prematurely.
The latest financial results present a clear tension between a concentrated classified contract drag and record operational efficiency. When the single fixed-price headwind is removed from the equation, the core business growth remains demonstrably robust. The 10.1 percent margin peak and the 1.4x book-to-bill ratio serve as the definitive takeaways.
These metrics confirm that the baseline enterprise is operating at peak capital efficiency. Investors should monitor the evolution of the confidential contract in upcoming quarters, as its resolution will eventually remove the artificial ceiling on aggregate top-line growth. The underlying fundamentals suggest a highly durable business model insulated by a record capital-secured backlog.
Readers interested in building a broader sector portfolio will find our detailed coverage of defence contractor investing, which breaks down how to weigh political risks, military budget tailwinds, and operational scale across both mid-tier firms and industry giants.
This article is for informational purposes only and should not be considered financial advice. Investors should conduct their own research and consult with financial professionals before making investment decisions. Past performance does not guarantee future results, as financial projections remain subject to market conditions and various risk factors.
Parsons experienced a 4 percent revenue contraction primarily due to an isolated fixed-price confidential contract, but simultaneously achieved a 10-cent EPS beat and record profitability through enhanced operational efficiency.
Parsons reported a 1.4x book-to-bill ratio, which indicates the company is securing new contracts significantly faster than it completes existing projects, providing strong future revenue visibility.
Investors should understand that adjusted earnings, like adjusted EBITDA, often provide a clearer picture of a defense contractor's core operational health by excluding non-recurring or non-operational costs that can weigh down GAAP net income.
The top-line revenue decline was almost entirely driven by lower volume on a single fixed-price confidential contract, while sales across the rest of the enterprise actually expanded by 8 percent annually.