Lululemon Plunges 12% on CEO Pick Amid Activist Investor Battle
1 hr ago

Wall Street’s reaction to the latest Parsons earnings report on Wednesday morning, 29 April 2026, highlighted a market rewarding operational execution over headline revenue optics. The federal contractor surpassed profit expectations and secured a historic $9.3 billion project backlog, pushing shares higher before regular trading commenced.
Within the current defence and infrastructure contracting environment, investors are prioritising margin expansion and secure project pipelines over raw volume metrics. This update breaks down the underlying drivers of the company’s $0.79 adjusted earnings per share outperformance.
It also explains why a surface-level contraction in top-line sales actually masks sustained organic growth within the core business. By isolating contract anomalies from operational efficiency, the latest financial results provide a clear view of the company’s forward trajectory and capital management strategy.
The immediate market reaction focused squarely on the exact size of the bottom-line outperformance. Pre-market trading algorithms and early investors pushed the share price to $53.49, representing a 3.15% jump from the previous close. This upward momentum followed adjusted per-share earnings of $0.79, which comfortably exceeded the prior period’s $0.78.
While net income fell by 20% to $53 million, the company achieved record profitability margins during the first quarter. Adjusted EBITDA hit a first-quarter high of $151 million. This specific metric drove profit margins to a peak of 10.1%.
The official Q1 2026 earnings press release confirms the exact components of this margin expansion, detailing how operational efficiencies offset the drop in net income.
Investors immediately rewarded this margin expansion, viewing the profitability increase as a stronger indicator of corporate health than the drop in net income. It demonstrates that the company is extracting more value from its current operations.
| Financial Metric | Q1 2026 Result | Market Expectation / Prior Period |
|---|---|---|
| Adjusted EPS | $0.79 | $0.78 |
| Adjusted EBITDA | $151 million | Up 1% Year-Over-Year |
| Adjusted EBITDA Margin | 10.1% | Increased |
| Net Income | $53 million | Down 20% Year-Over-Year |
Federal defence contractors frequently manage single, large-scale fixed-price agreements that can distort quarterly revenue figures when those specific contracts wind down. When massive, single-phase projects reach maturity, the corresponding drop in billable milestones can artificially depress year-over-year comparisons. Understanding the latest results requires looking past these surface-level optics to identify the true organic growth rate.
Current industry analysis on fixed-price defence contracts indicates that major aerospace and defence firms are actively shifting toward cost-plus agreements to avoid the exact revenue distortions currently impacting legacy pipelines.
Total sales generated $1.5 billion, representing a 4% annual drop. However, this top-line contraction masks the actual expansion of the core business. Excluding one specific confidential contract from the calculations, total sales climbed 8% annually.
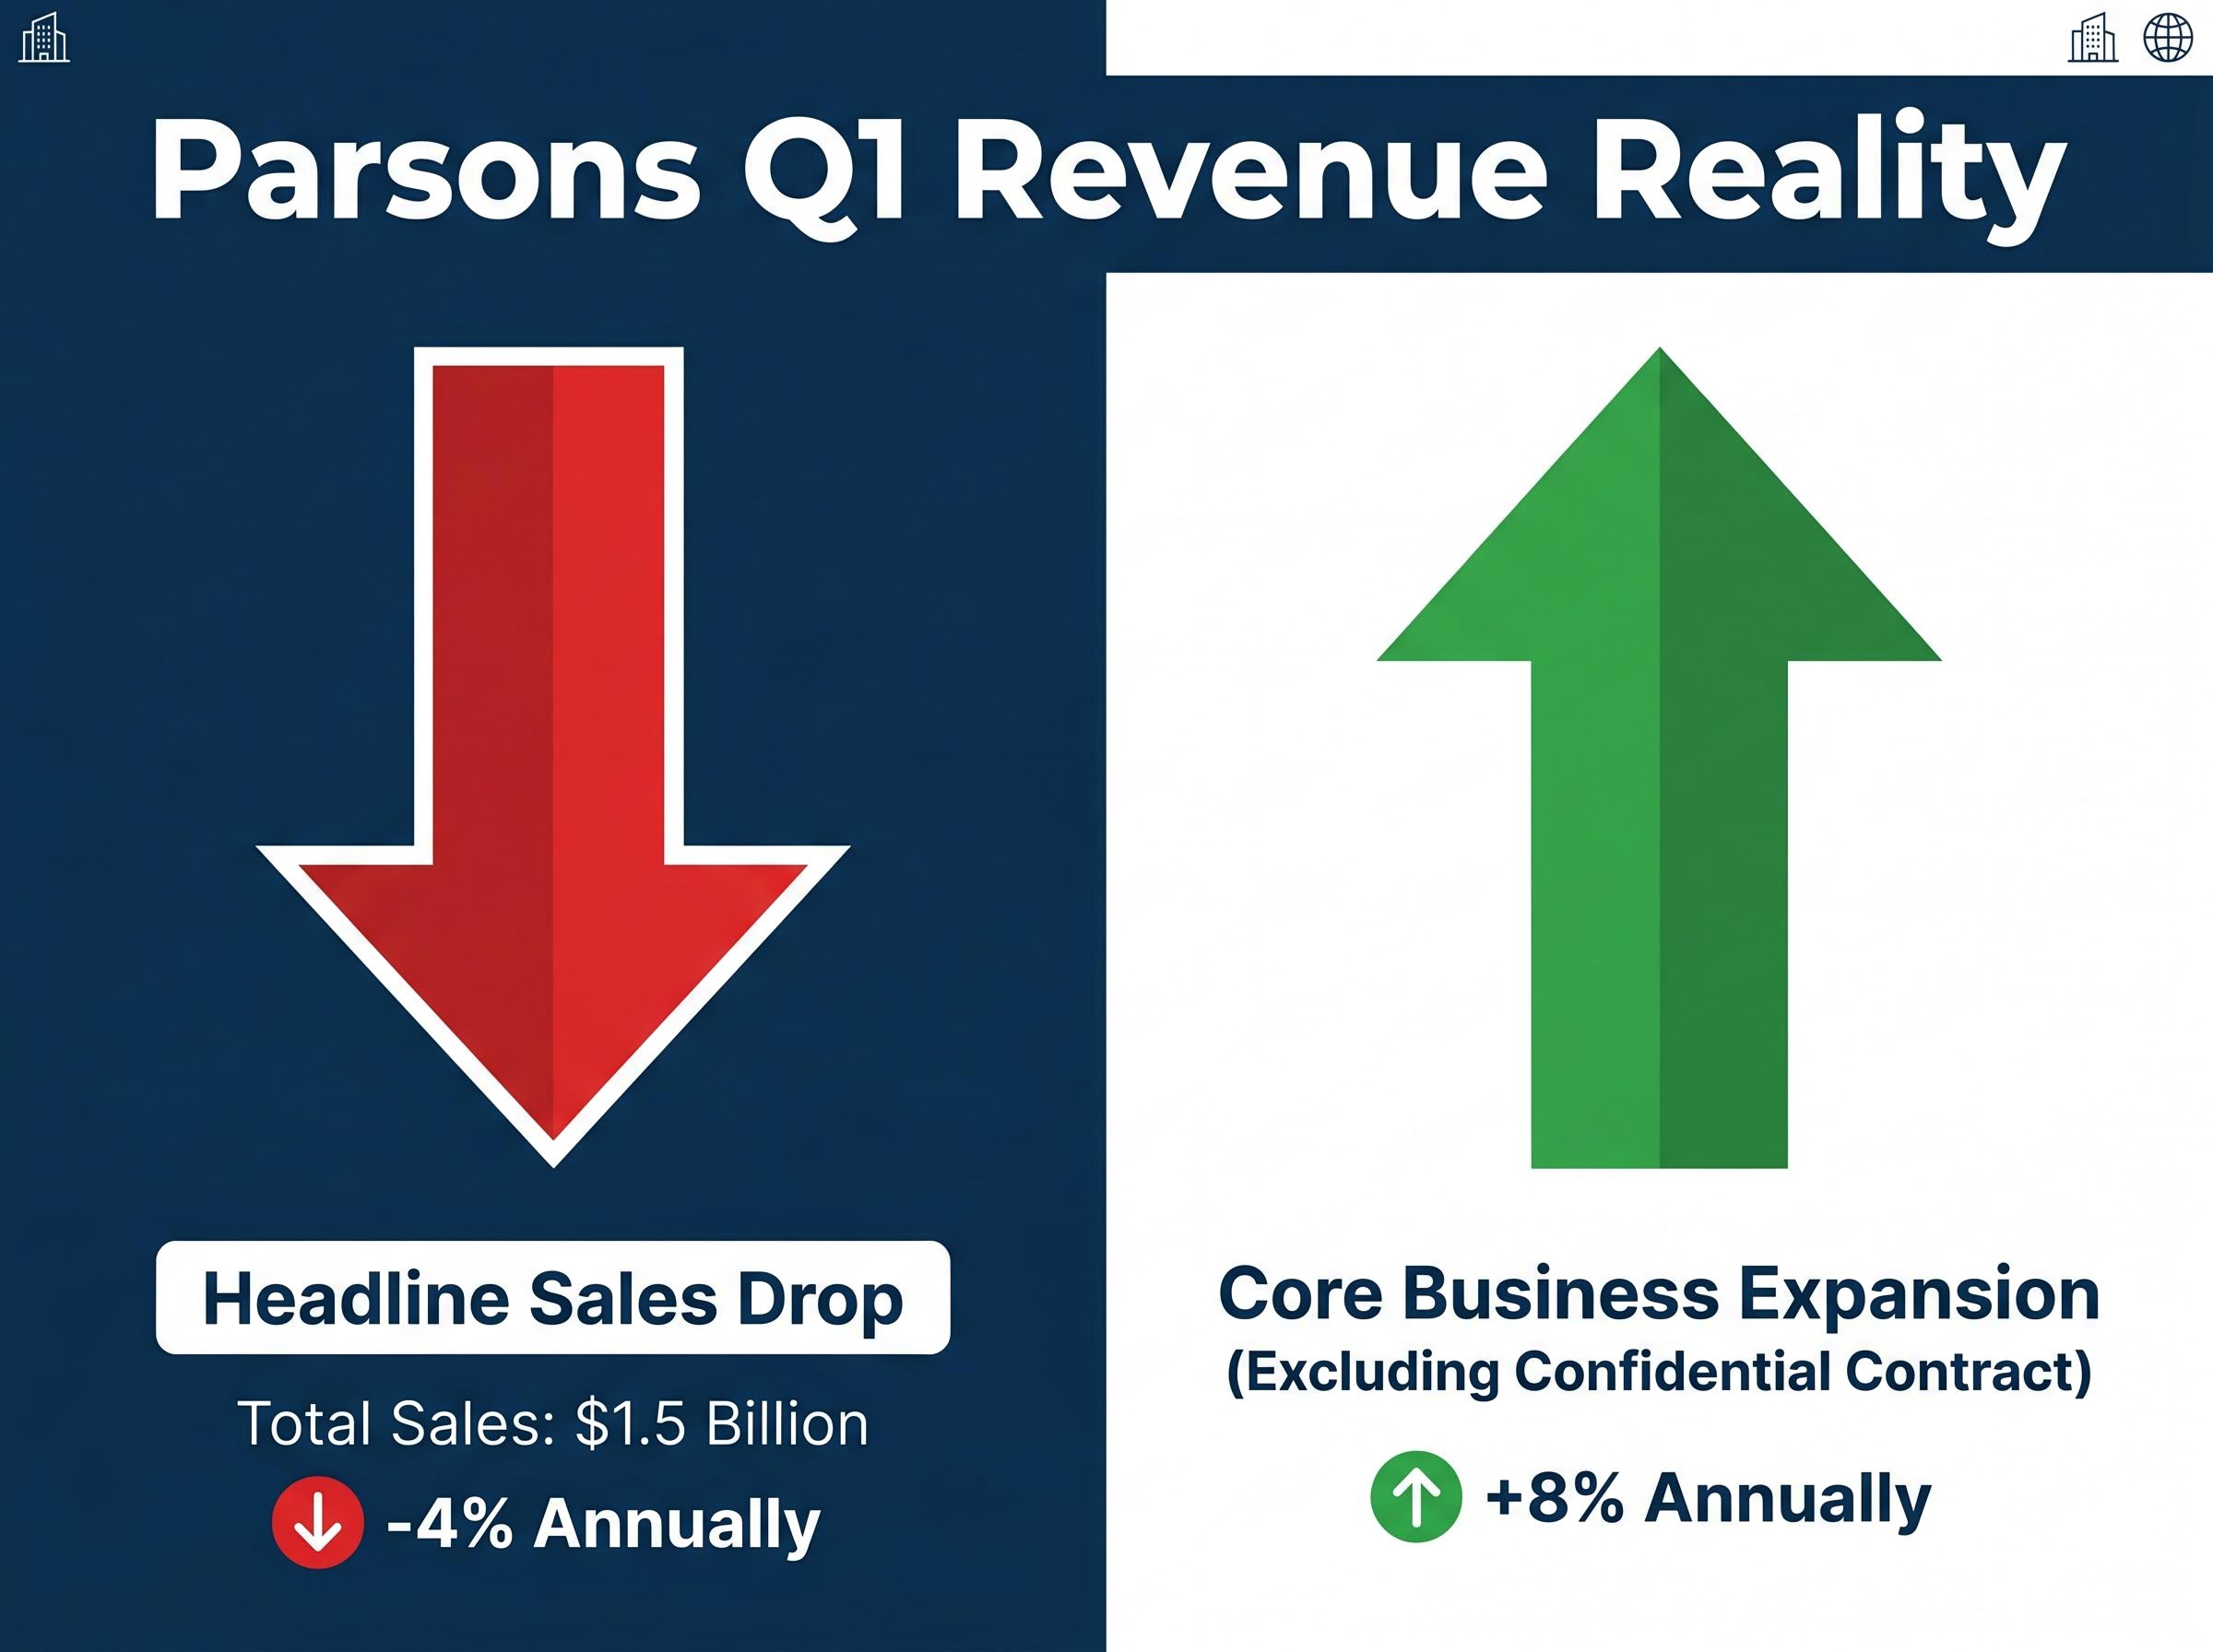
This hidden organic growth was fueled primarily by the transportation, space and missile defence, and critical infrastructure protection divisions. Chief Executive Officer Carey Smith addressed this apparent contradiction directly during the reporting cycle.
“Our first quarter results demonstrate the resilience of our portfolio, as we delivered record adjusted EBITDA margin and strong bookings despite lower volume from a confidential fixed-price contract.”
This distinction teaches investors to evaluate federal contractors by isolating isolated anomalies from recurring operational revenue. The margin expansion demonstrates that the underlying business is operating more profitably even as one specific legacy agreement contributes less to the top line.
Past performance optics matter less than future security in the infrastructure contracting sector. The company’s massive project backlog serves as the most reliable indicator of long-term corporate health and future revenue visibility. Total net bookings reached $2.1 billion during the quarter, creating a highly favourable 1.4x book-to-bill ratio.
This aggressive booking pace pushed the cumulative project pipeline to a historic maximum of $9.3 billion.
Four major contract wins exceeded $100 million each, driving this pipeline expansion across primary divisions:
$593 million Federal Aviation Administration extension ($410 million booked in Q1) Up to $500 million agreement for U.S. Cyber Command ($250 million booked in Q1) $340 million transportation contract in the Middle East ($300 million booked in Q1) $145 million GARDEM software system contract ($38 million booked in Q1)
The momentum established in the first quarter continued directly into April. Following the quarter’s close, the company secured an additional $400 million in Other Transaction Agreements. They also signed a $184 million classified indefinite-delivery/indefinite-quantity contract and an $87 million contract increase, reinforcing the structural backing for upcoming quarters.
For investors exploring how allied military spending is flowing to specific manufacturers, our detailed coverage of US defence contract awards examines recent high value remote weapon system orders and their impact on future production pipelines.
Strong project pipelines require efficient capital management to translate into tangible shareholder value. During the first quarter, cash consumed by operations contracted to $4 million. This represents a marked improvement from the same timeframe last year.
Successfully mitigating defence contract execution risks through ready inventory and rapid fulfilment cycles is becoming a critical differentiator for companies looking to accelerate their cash collections.
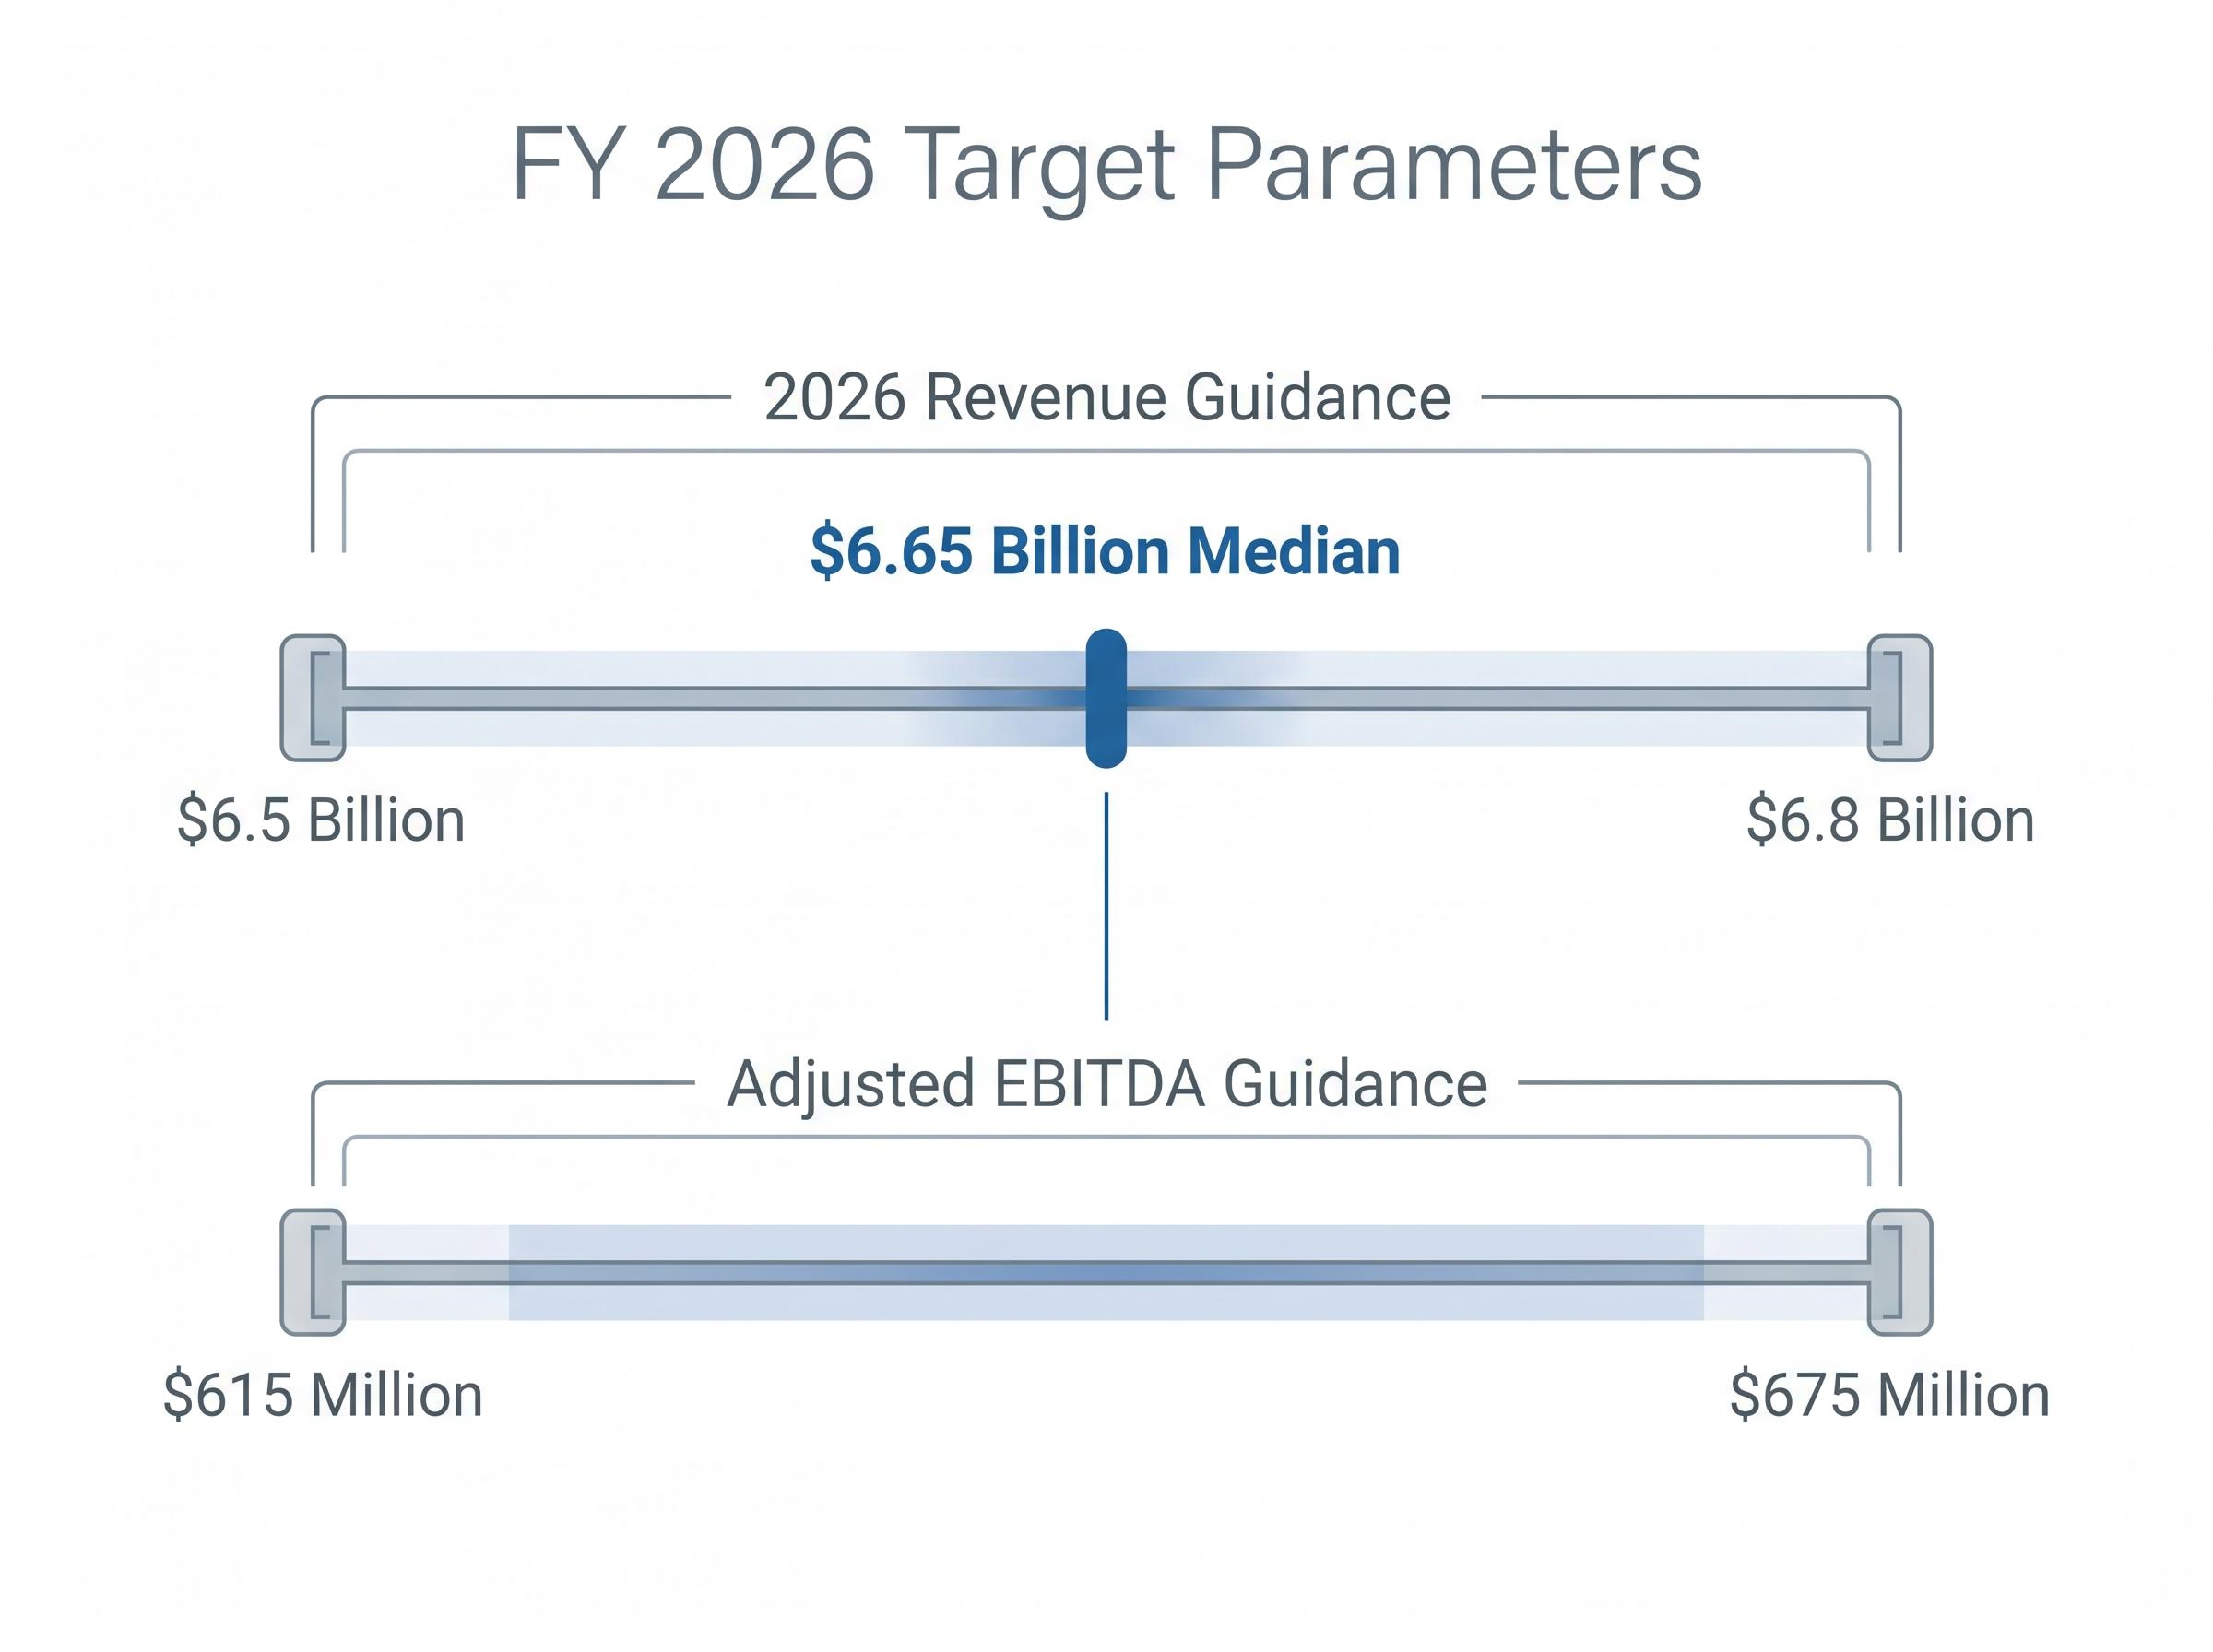
This operational efficiency allows management to maintain steady expectations despite the strong margin expansion recorded early in the year. The leadership team reaffirmed their guidance parameters for the remainder of 2026, opting for a conservative but solid outlook.
The full-year expectations track closely with broader market models:
The $6.65 billion median revenue guidance anchors these expectations. This steady calibration ensures investors know exactly what financial benchmarks the company expects to hit in subsequent quarters.
The first-quarter results demonstrate why margin expansion and a historic project backlog outweigh surface-level revenue declines. When isolated from specific contract anomalies, the core organic growth remains strong across both defence and infrastructure portfolios.
Vendors that can demonstrate strict alignment with funded US defence requirements generally enjoy greater revenue visibility, as these multiple year budget appropriations insulate core projects from short term economic fluctuations.
Updated analyst ratings and revised price targets are expected to follow the conclusion of the morning earnings call. In a sector heavily reliant on secure, multi-year pipelines, the combination of a 10.1% profit margin and a $9.3 billion backlog positions the company to absorb market volatility and execute on its upcoming deliverables.
This article is for informational purposes only and should not be considered financial advice. Investors should conduct their own research and consult with financial professionals before making investment decisions. Past performance does not guarantee future results, and financial projections are subject to market conditions.
Parsons' stock rose due to exceeding profit expectations with $0.79 adjusted EPS and achieving record adjusted EBITDA margins of 10.1%, despite a decline in net income.
Total sales showed a 4% annual drop because of a large, winding-down confidential fixed-price contract, but excluding this anomaly, the core business actually grew organically by 8%.
The historic $9.3 billion project backlog indicates strong long-term corporate health and high future revenue visibility, underpinned by a 1.4x book-to-bill ratio and significant new contract wins.
Parsons reaffirmed full-year 2026 guidance, expecting revenue between $6.5 billion and $6.8 billion and adjusted EBITDA between $615 million and $675 million.