
The S&P 500 closed at an all-time high of 7,173.91 on 27 April 2026, capping a month where crude oil traded near $100 per barrel. Simultaneously, Goldman Sachs characterised the US-Iran conflict as the largest energy supply disruption in history. Investors assessing stock market geopolitical risk must reconcile a record-setting equity sprint against an unresolved global shock.
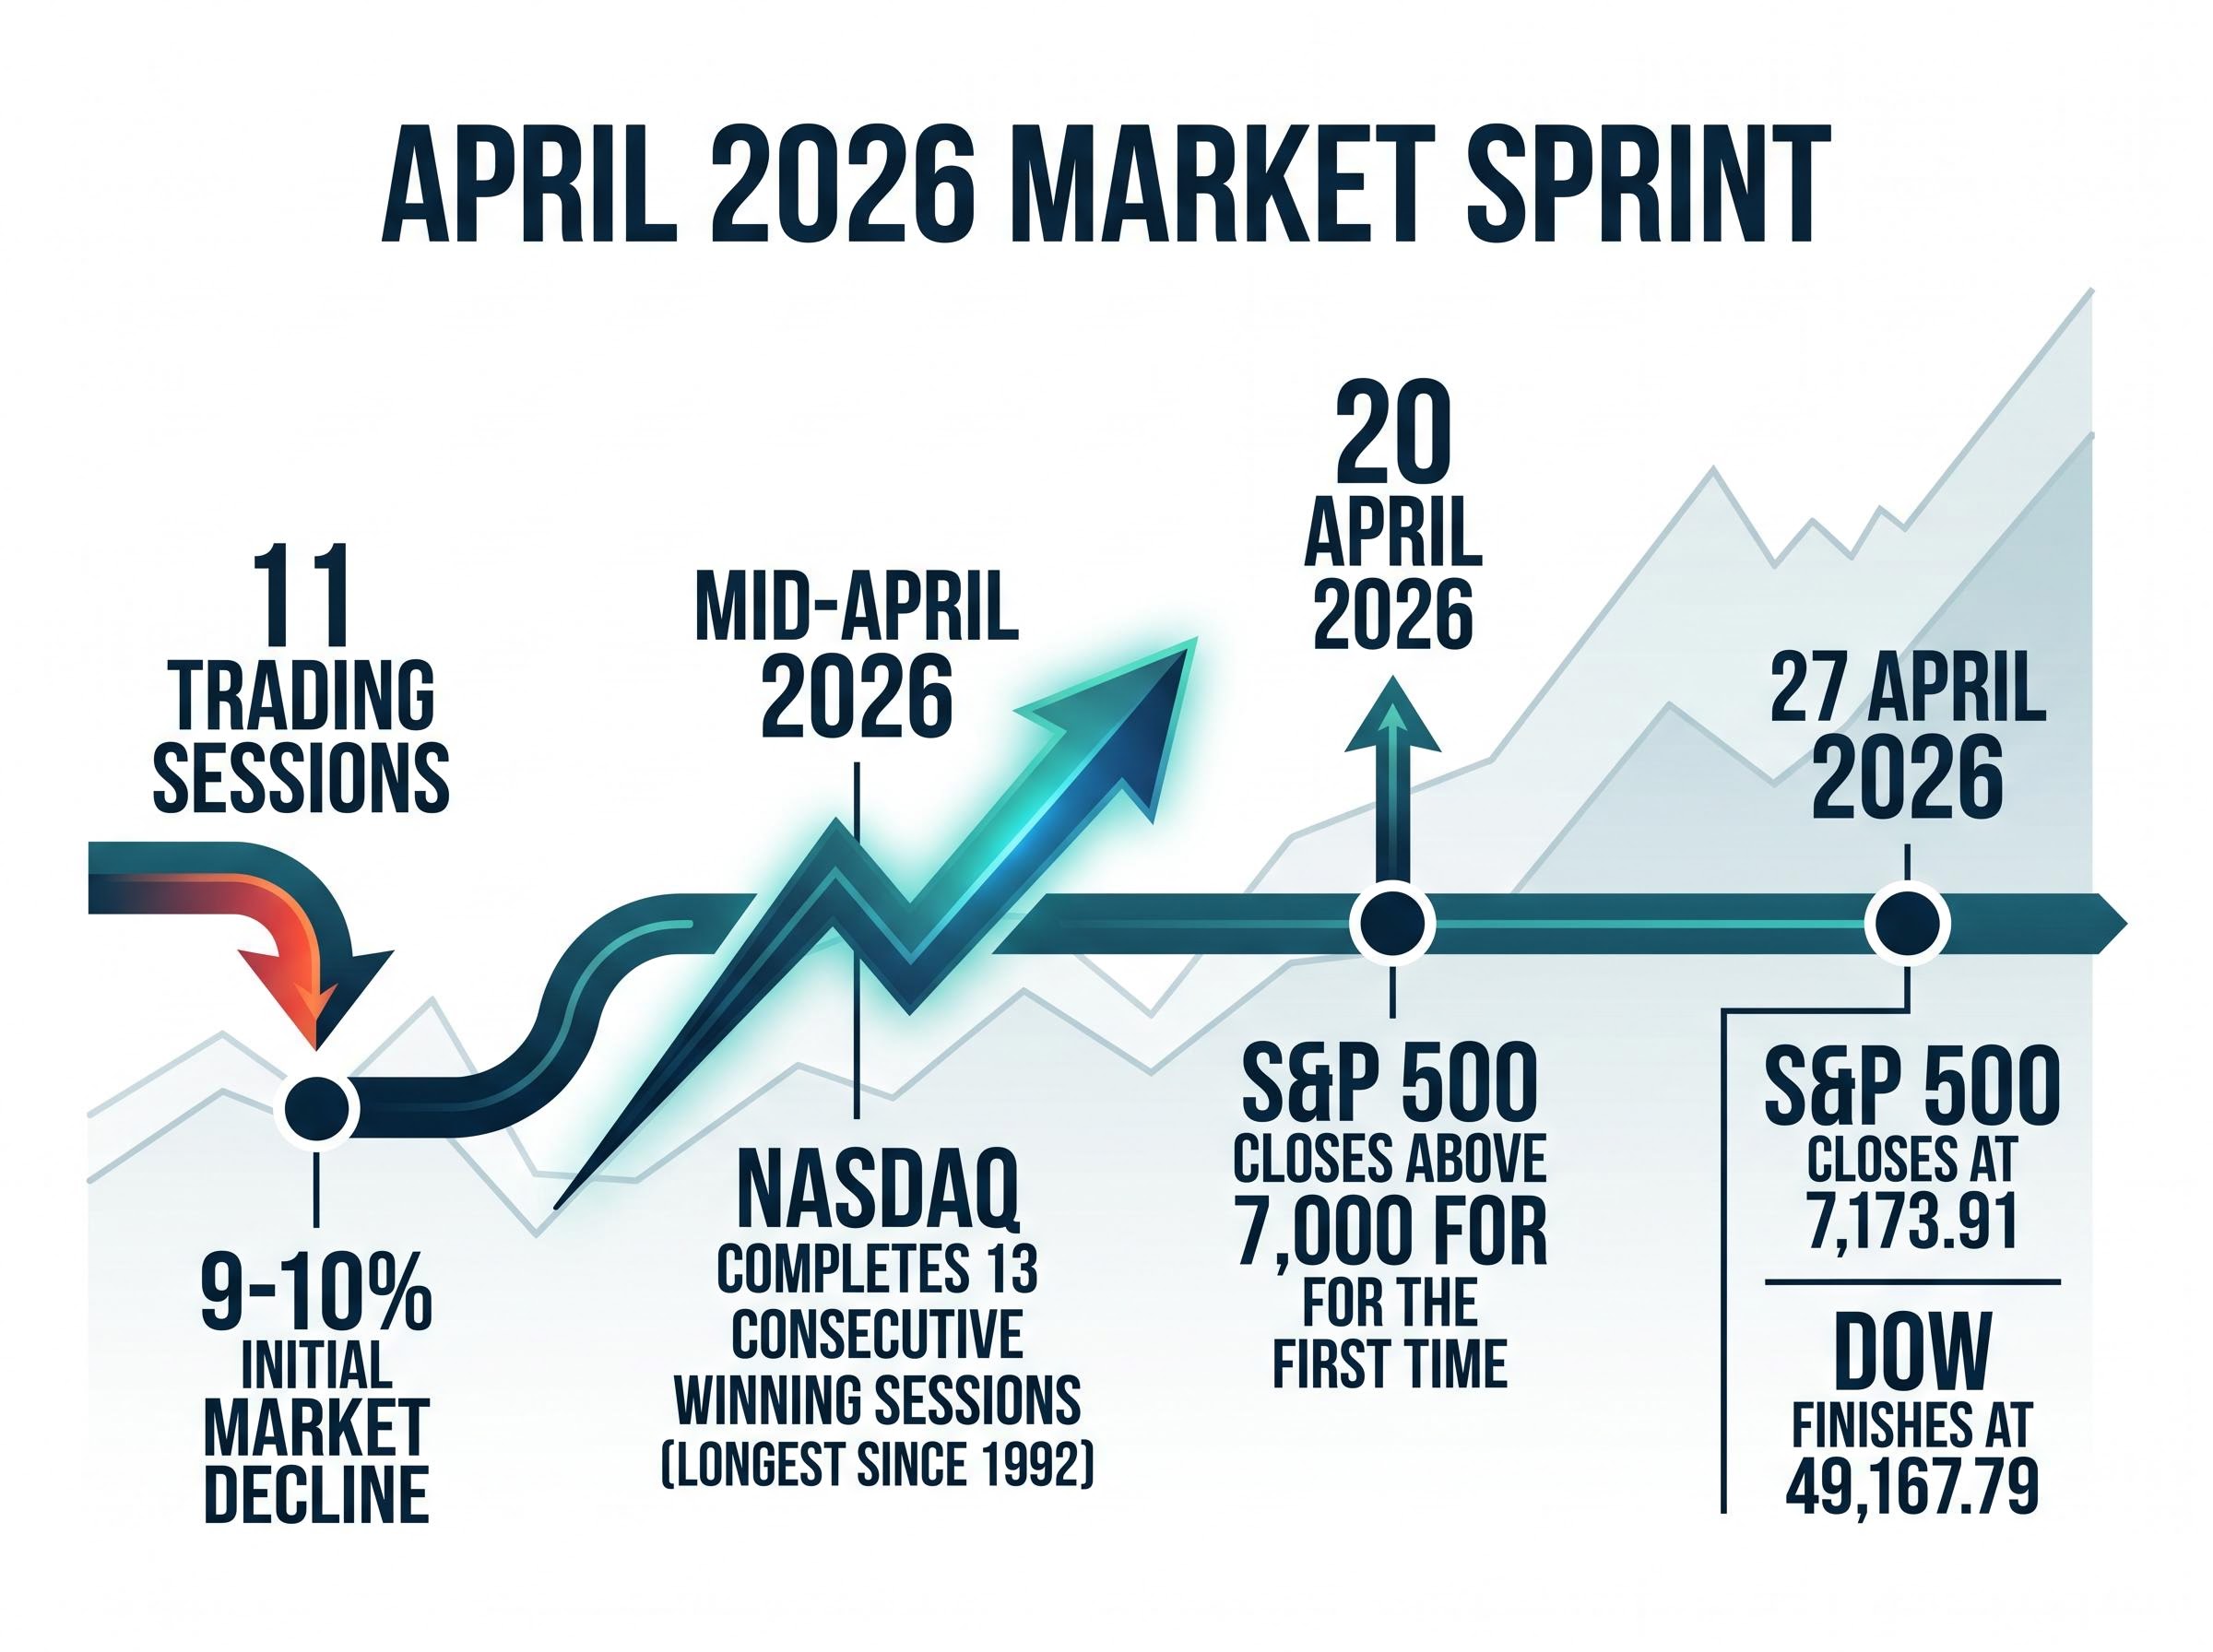
The index erased a 9-10% decline in roughly 11 trading sessions. The Nasdaq logged 13 consecutive winning sessions, marking its longest streak since 1992. According to the AAII sentiment survey, retail investors swung bullish by mid-April 2026.
This analysis examines whether the equity market’s dismissal of global threats is supported by fundamentals or whether investors are discounting dangers that are difficult to price. Readers will gain a clear framework for evaluating external threats when markets move in the opposite direction.
The fastest recovery no one is talking about
The equity rebound’s velocity presents an empirical puzzle. A recovery this fast either reflects genuine resolution of underlying threats or indicates selective attention to facts supporting a bullish case. The data outlines an aggressive recalibration of asset prices that outpaced the actual geopolitical timeline.
Specific milestones demonstrate how quickly capital rotated back into risk assets.
20 April 2026: The S&P 500 closed above 7,000 for the first time, initiating a three-day streak of consecutive record highs not seen since October 2025. Mid-April 2026: The Nasdaq completed 13 consecutive winning sessions, establishing its longest streak since 1992. * 27 April 2026: The S&P 500 reached an intraday all-time high before closing at 7,173.91, while the Dow Jones Industrial Average finished at 49,167.79.
This sprint occurred against a backdrop of severe commodity market dislocation.
“The ongoing situation represents the largest energy supply disruption in history, yet markets have moved to price out worst-case scenarios with unprecedented speed.”
The speed of market recoveries is often treated as a reassuring signal. However, velocity itself is a variable worth examining when the underlying catalyst for the initial 9-10% decline remains partially unresolved.
When big ASX news breaks, our subscribers know first
What investors appear to be pricing in (and what they are leaving out)
The rapid equity recovery relies on collapsing a complex geopolitical web into a single bullish narrative. The market has heavily weighted the ceasefire progress and the reopening of the Strait of Hormuz. This specific catalyst drove a $13 per barrel weekly decline in crude oil, providing immediate relief to inflation models.
Technology and artificial intelligence momentum has acted as a structural counterweight to energy headwinds. Investors have treated AI growth as an overriding fundamental that supersedes regional conflicts.
This tech-driven enthusiasm effectively masks macroeconomic vulnerabilities, as the soaring probability of economic contraction fueled by persistent supply constraints is largely ignored by momentum-focused participants.
| What the Market is Pricing In | What Remains Unresolved |
|---|---|
| Strait of Hormuz reopening and sustained tanker traffic | Potential for sudden re-disruption of regional maritime chokepoints |
| Conflict containment via current ceasefire agreements | Escalation or widening of hostilities beyond current agreements |
| Energy shock treated as temporary and fading | Delayed inflation pass-through from elevated baseline oil prices |
| Federal Reserve maintaining a neutral policy stance | Hawkish pivot required if energy costs re-accelerate |
Understanding this divergence is the difference between participating in a rally with awareness and doing so blindly. Piper Sandler chief market technician Craig Johnson warned of near-term vulnerability, noting that specific downside catalysts are being ignored.
“Investors have a well-documented tendency to set aside geopolitical threats they cannot easily quantify or build a reliable trading framework around, opting instead to follow price momentum.”
Crude oil remained near $100 per barrel around 22 April 2026. The market is pricing in the relief, but it is leaving out the lingering baseline elevation.
Why oil at $100 is not just an energy story
The equity market’s assumption that energy inflation will be temporary anchors the current bull thesis. However, elevated crude oil prices transmit into broader inflation through a specific, delayed mechanism. This transmission chain works its way through the economy systematically.
Federal Reserve research on second-round inflation effects confirms that supply shocks operate with long lags, meaning higher production and transportation costs often take several quarters to fully pass through to core consumer goods.
- Crude price increases establish a higher baseline cost for unrefined inputs.
- Fuel costs rise directly at the pump, absorbing discretionary household capital.
- Transportation and logistics costs increase for industrial and retail distributors.
- Producer prices escalate as manufacturing and freight margins compress.
- Consumer prices ultimately rise as businesses pass through accumulated costs.
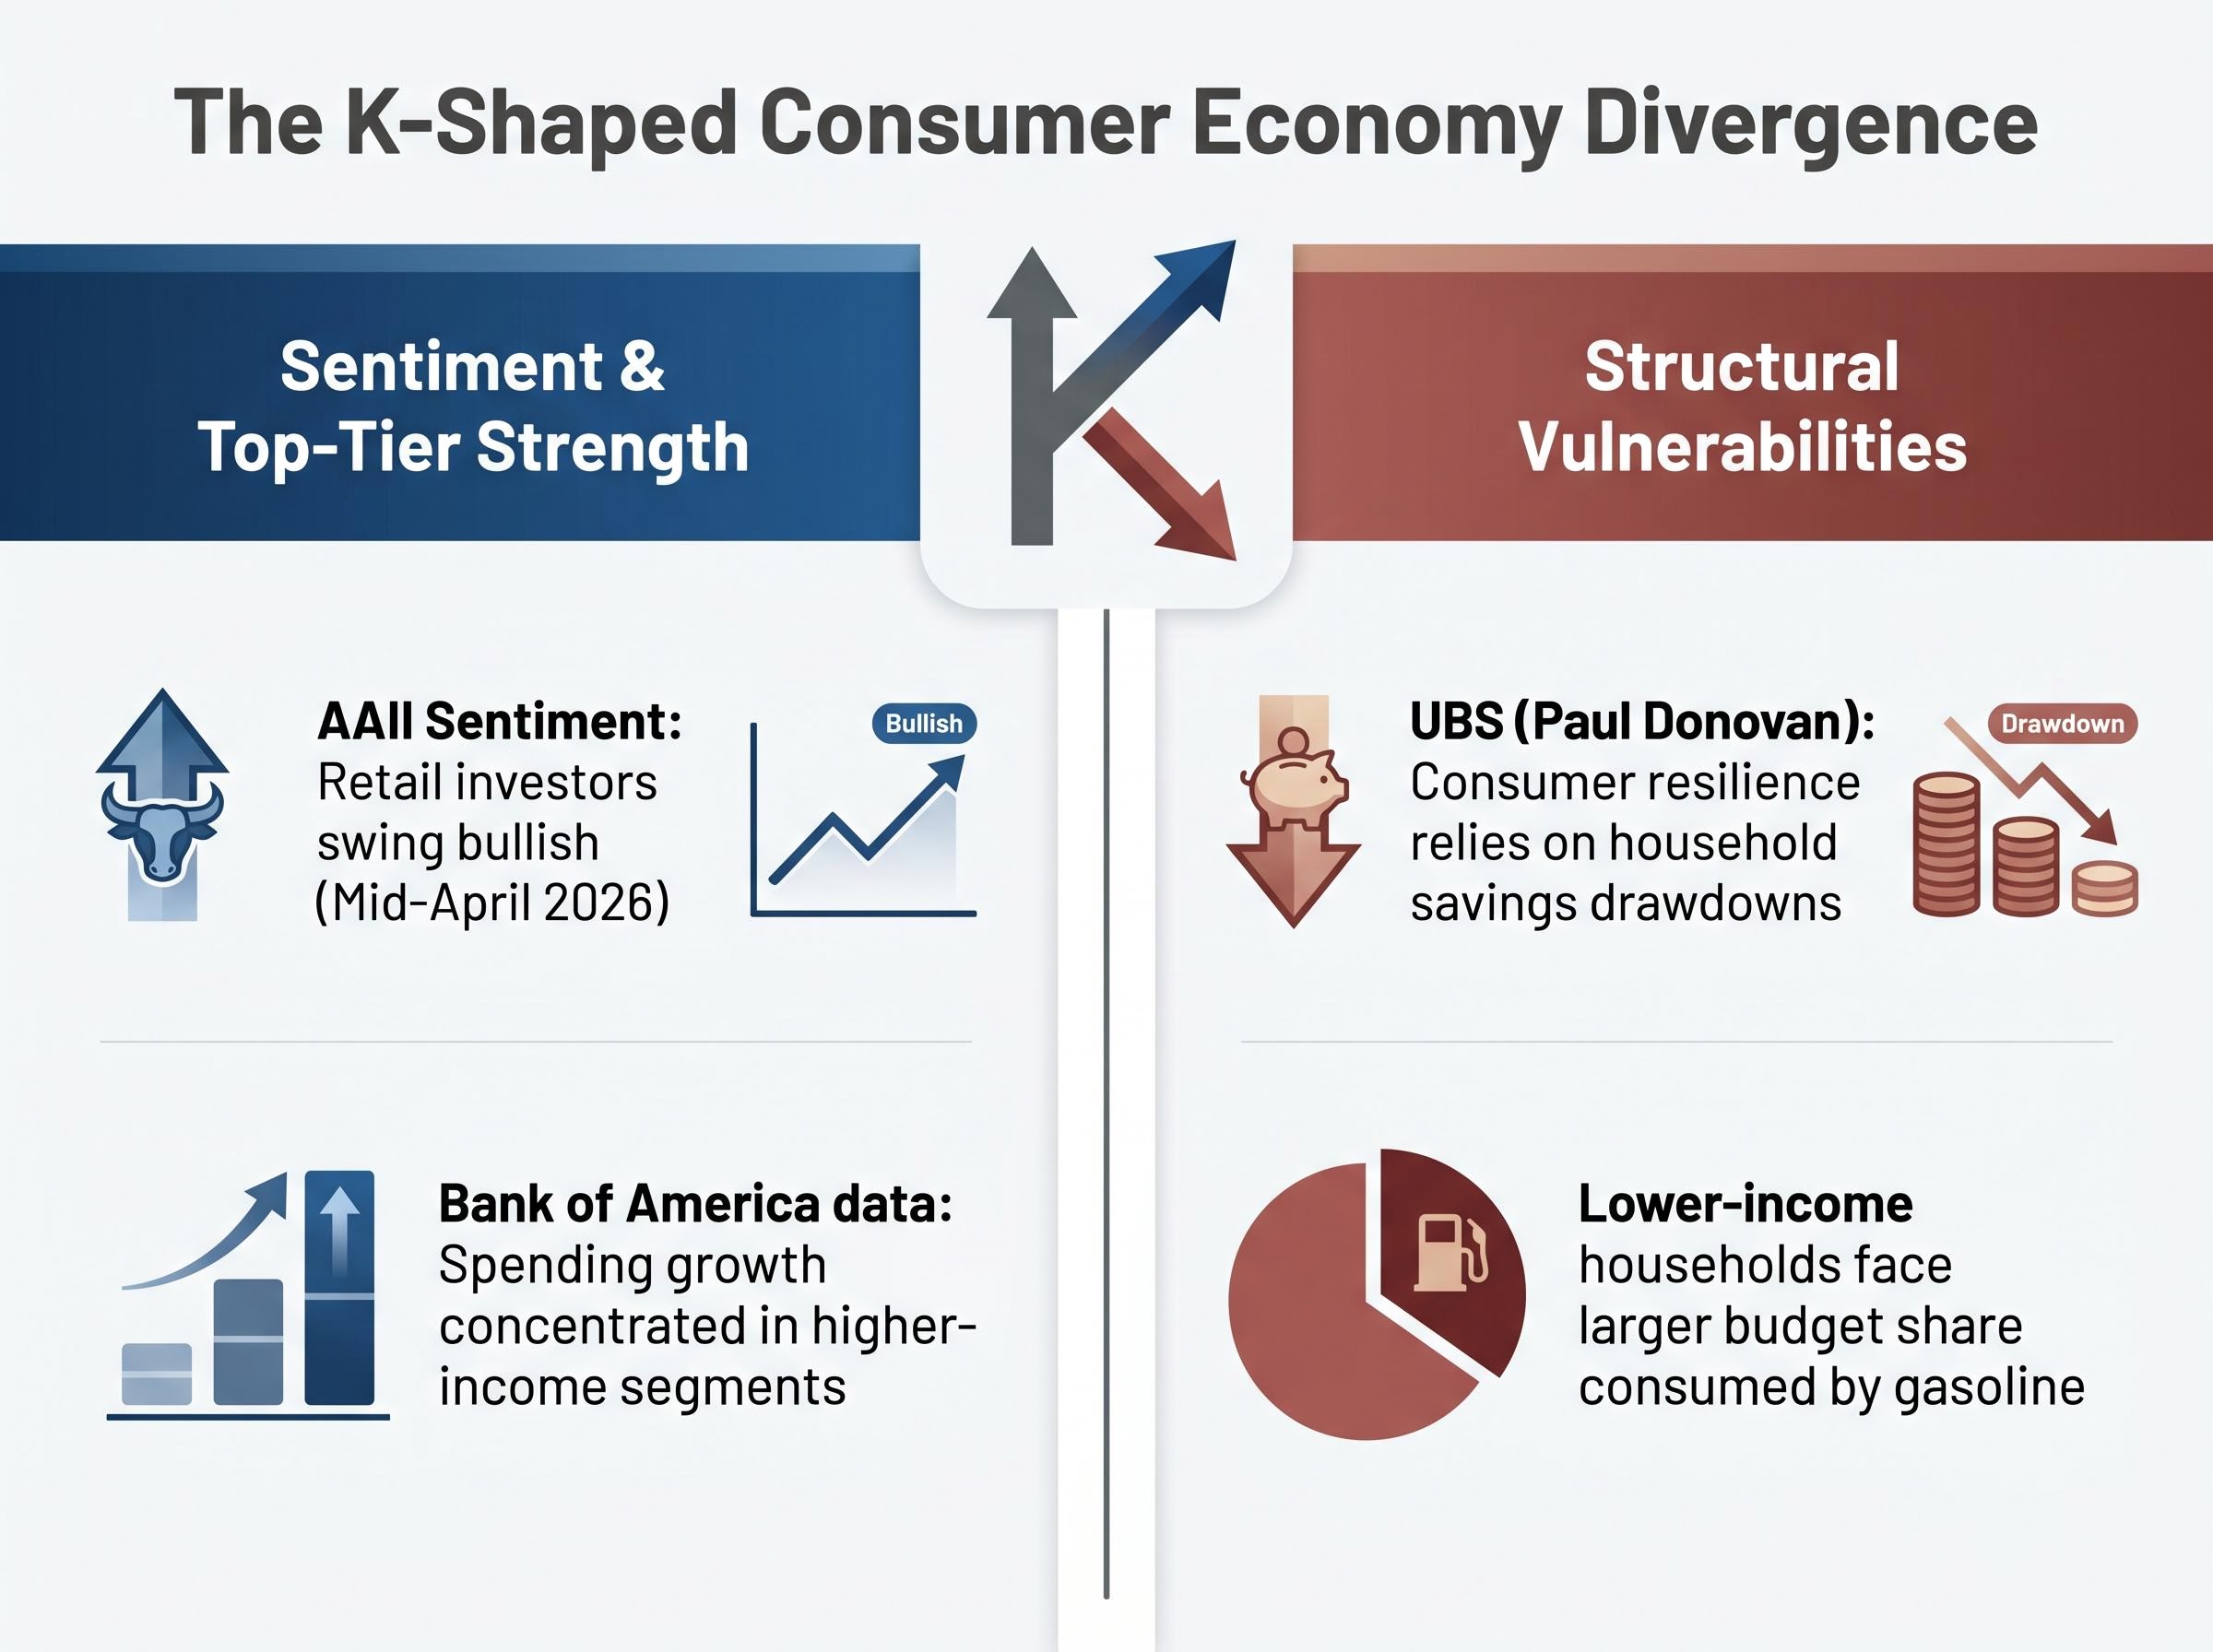
Therefore, the US economy has not yet felt the conflict’s full erosive impact. UBS chief global economist Paul Donovan characterised current spending patterns as unsustainable. Donovan noted that current consumer resilience partly reflects the drawdown of household savings rather than real income strength.
Supporting this, Bank of America data showed aggregate consumer expenditure climbed. This creates a delayed reckoning scenario that record-high equity valuations have not fully integrated.
What the Fed rate hold assumption is actually betting on
Markets broadly priced in a rate hold for the 28 April 2026 Federal Open Market Committee meeting. This implies the central bank views the energy-driven inflation spike as a transitory, geopolitically induced event.
This bet requires the conflict to remain contained and energy costs to continue their downward trajectory. If the conflict re-escalates or oil stays elevated near $100 longer than expected, this premise breaks down. A persistent energy shock would likely force a more hawkish policy response, compressing the equity multiples that currently support the S&P 500 at 7,173.91.
The retail investor sentiment swing and what history says about it
Behavioural finance data provides another lens to view this rapid market recovery. Sentiment extremes have historically flagged turning points, and the reversal observed during this conflict period was unusually sharp.
“The AAII sentiment survey revealed that retail investors were bullish by mid-April 2026, a rapid expansion from those who reported bullishness before the conflict began.”
Goldman Sachs analysed this pattern, framing the rapid recovery as reflecting a degree of complacency observed in past Middle East shocks. Historically, initial sharp selloffs in these scenarios give way to swift recoveries that can overshoot before economic fundamentals catch up.
This optimism masks structural vulnerabilities within the K-shaped consumer economy.
A Brookings Institution analysis of deteriorating household finances shows a widening gap between demographic tiers, suggesting that aggregate consumer spending metrics fail to capture the severe budget constraints developing at the lower end of the income spectrum.
The speed of the equity recovery outpaced the resolution of physical supply constraints. The rapid sentiment swing from fear to near-majority bullishness signals potential exhaustion of cautious positioning. According to reports, Bank of America data indicates spending growth is highly concentrated in higher-income segments. Lower-income households are facing a proportionally larger share of their budgets consumed by elevated gasoline costs.
When aggregate spending masks income bifurcation, the broader economy is more fragile than headline indices suggest. The market is ignoring unresolved risks in the Strait of Hormuz, assuming higher-income spending will permanently offset lower-income energy burdens.
How investors should think about geopolitical risk when markets are looking away
When markets correctly look through external shocks, they reward those holding their positions. But the investor who understands why the market is dismissing a threat is positioned to respond when that dismissal stops being warranted. Craig Johnson identified the core analytical challenge, noting that investors default to dismissing unquantifiable threats rather than building them into a probability-weighted view.
Overcoming this behavioural bias requires investors to actively monitor escalating corporate energy costs across non-energy sectors to recognize when theoretical global conflicts transition into quantifiable profit destruction.
The International Monetary Fund has flagged energy price impacts on inflation and growth in import-dependent economies as a global financial stability concern. This global dynamic may eventually feed back into US export conditions and corporate earnings.
- Identify the specific tail scenarios, such as supply route disruption or conflict escalation, that sit outside current consensus.
- Assess the precise geopolitical or economic triggers required for each tail scenario to materialise.
- Consider whether current portfolio positioning offers exposure to energy and inflation-sensitive sectors if the base case fails.
Adam Crisafulli assessed the US-Iran de-escalation track as the market’s base case, providing support for record equity highs. The analytical task is defining what happens if that base case proves incorrect.
Applying the framework to the current Iran conflict moment
Applying these three steps to late April 2026 clarifies the immediate vulnerabilities. The live tail scenarios include a collapse of the ceasefire or a renewed blockade of the Strait of Hormuz. The entire equity rally is dependent on these conditions holding steady.
Furthermore, the energy inflation lag remains the most likely delayed catalyst for a market recalibration. The absorption of $100 oil into producer prices presents an ongoing test for corporate margins.
These statements are speculative and subject to change based on market developments.
Record highs are not proof the risks have gone away
The central paradox of late April 2026 is that record highs amid unresolved tension do not disprove underlying threats. The market has been largely correct in the short term, as the recovery was swift and new index peaks were achieved. However, correctness in the short term and prudence regarding forward exposure are entirely different analytical disciplines.
The current fragility embedded in equity pricing becomes starkly apparent when considering that physical shipping blockades and diplomatic optimism can present entirely contradictory signals within a single trading session.
The S&P 500 closing at 7,173.91 raises the stakes. It demands near-perfect execution of the ceasefire and a frictionless reopening of the Strait of Hormuz. The UBS delayed reckoning thesis provides the necessary counterweight to this optimism.
“Current resilience in household consumption is heavily reliant on savings drawdowns, a pattern that becomes structurally unsustainable if elevated energy prices persist.”
The preconditions for the equity bull case are visible, but they are fragile. Investors are invited to hold both possibilities simultaneously. The market may continue its upward trajectory, supported by technology earnings and contained regional tensions. But the professional who has mapped the load-bearing assumptions understands exactly what would need to break for this consensus to unravel.
This article is for informational purposes only and should not be considered financial advice. Investors should conduct their own research and consult with financial professionals before making investment decisions.