ASIC Hands Director Maximum 5-Year Ban After $12.4M Collapse
49 mins ago
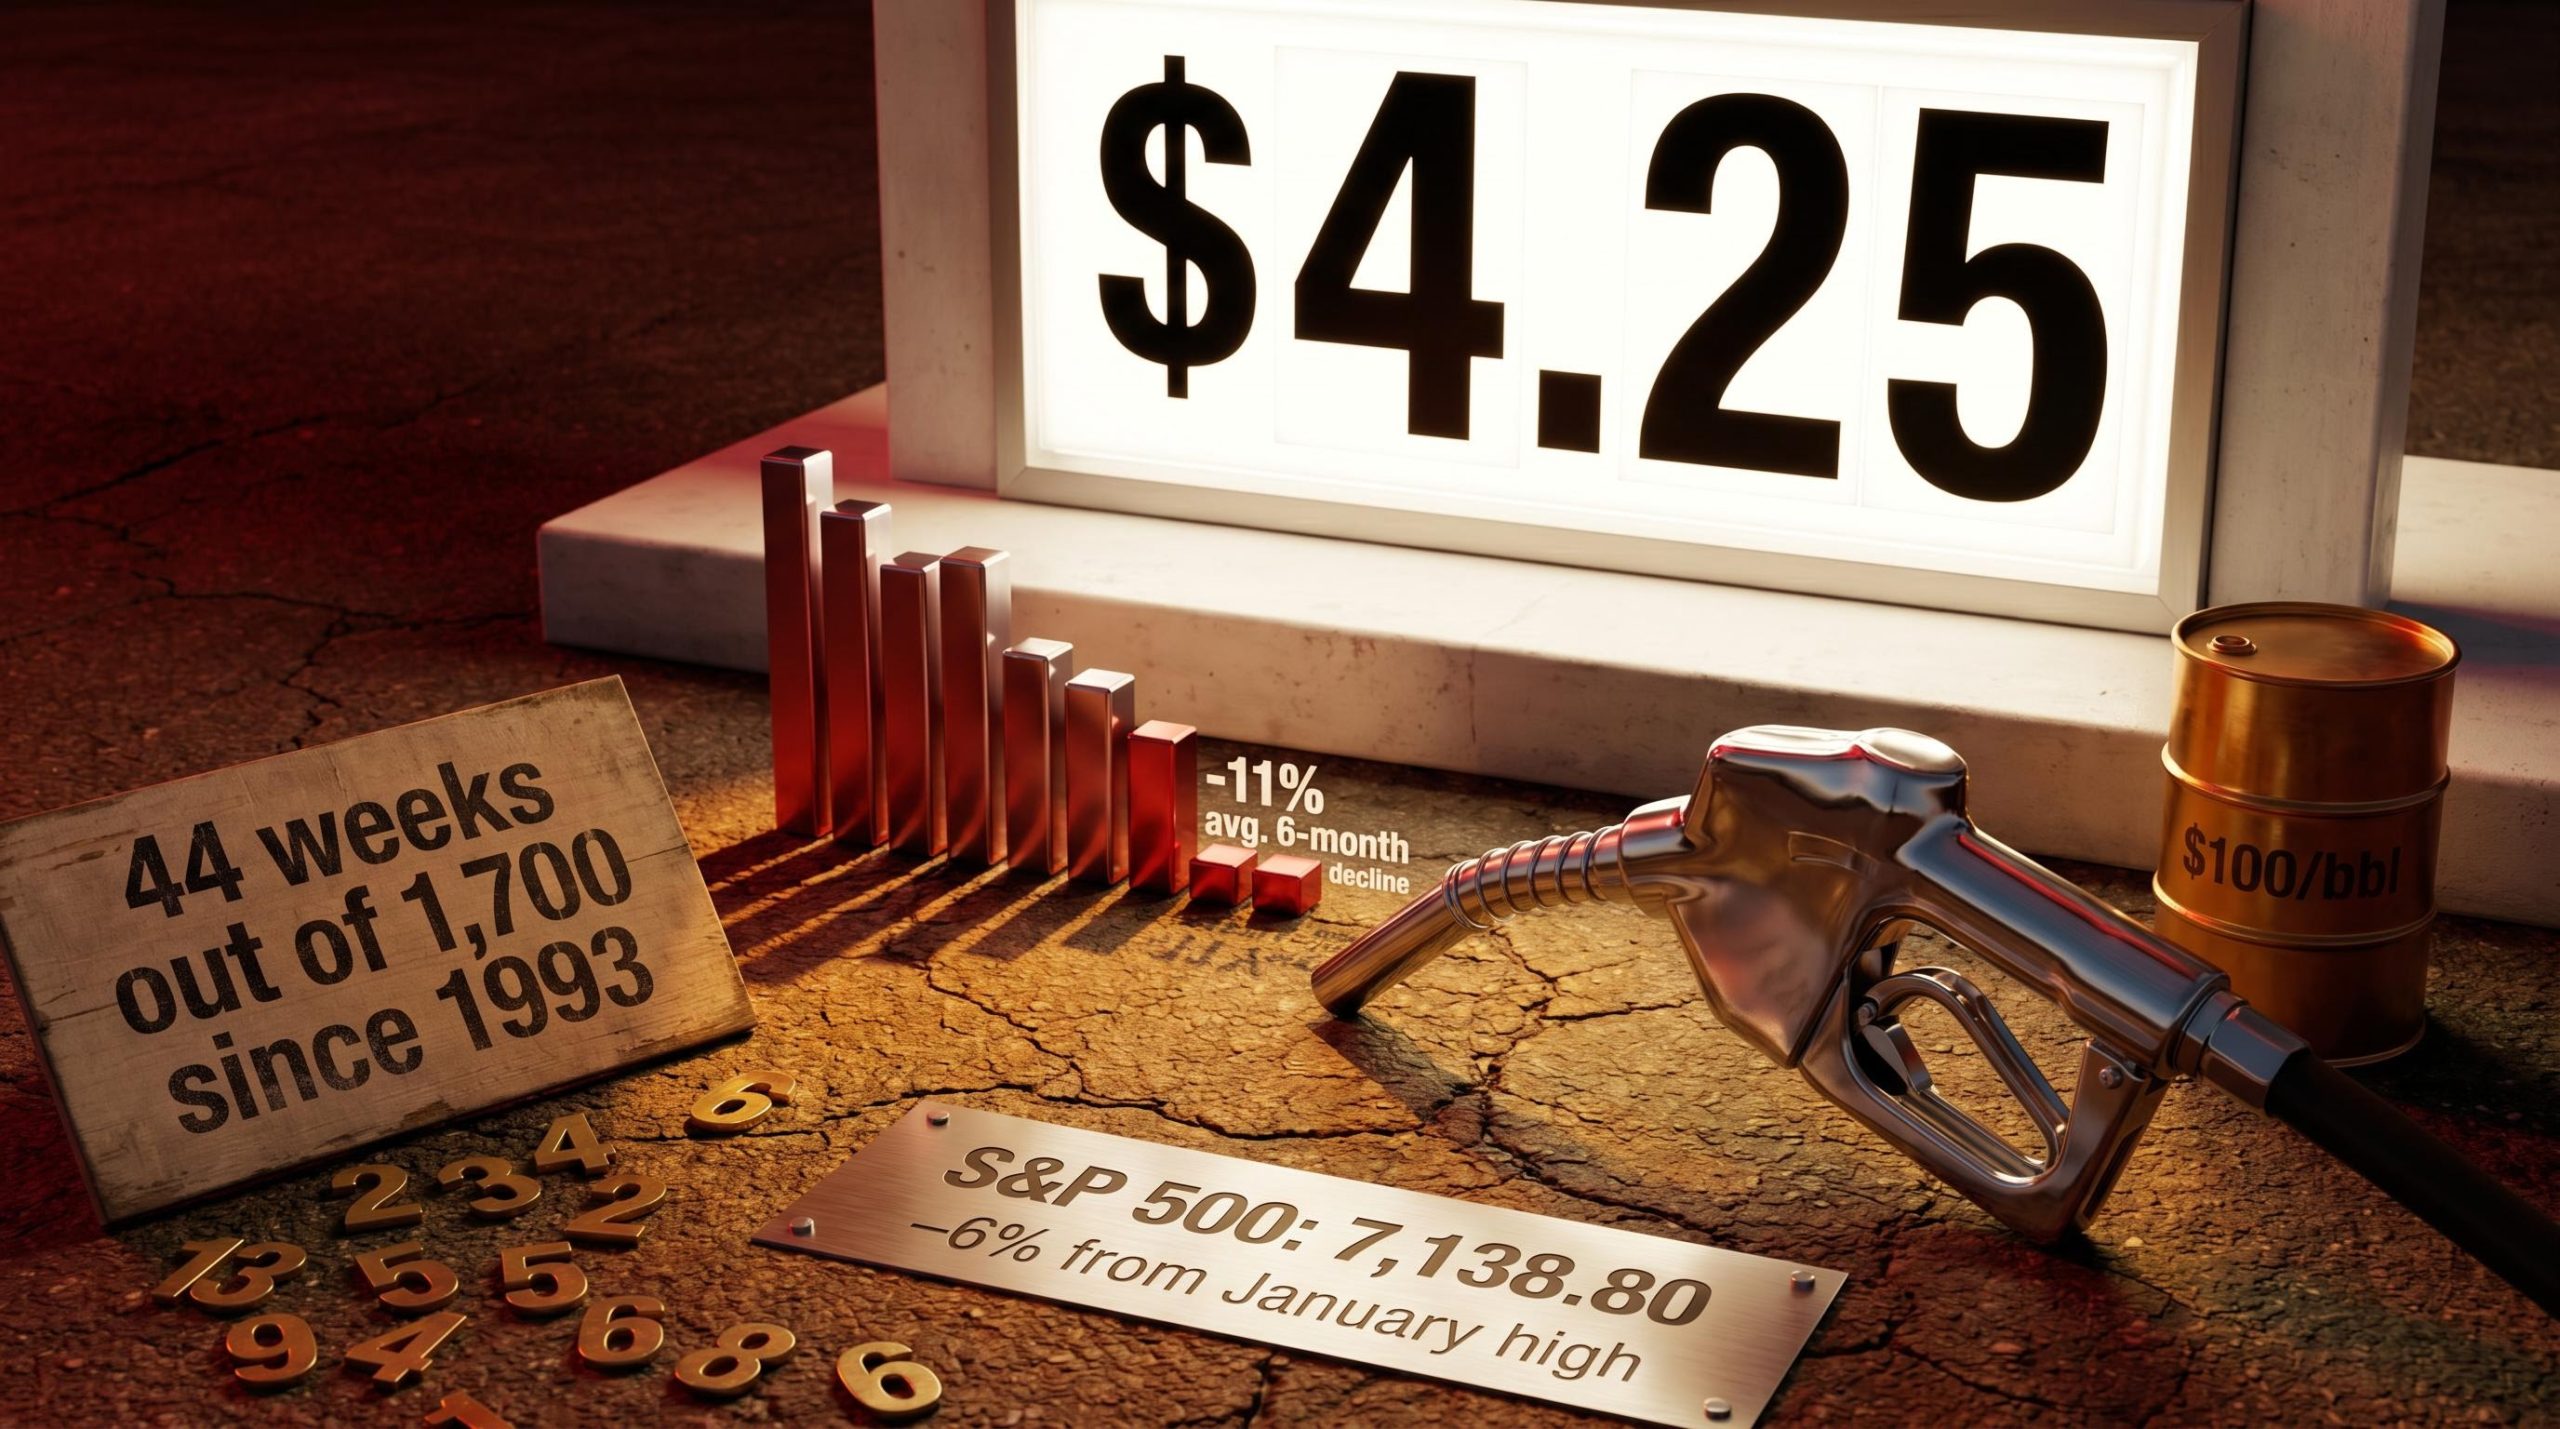
Gasoline at $4.25 per gallon sounds alarming. The historical record suggests it should be. In the 44 weeks since 1993 when national average prices cleared $4.00 per gallon, the S&P 500 fell an average of 11% over the following six months. That statistic is no longer abstract: the national average hit $4.25 for the week ending 27 April 2026, a 45% surge from January driven by the Iran conflict and the Strait of Hormuz disruption. The S&P 500 sits at 7,138.80, roughly 6% below its January record high, having recovered a sharp initial selloff. But the underlying catalysts remain unresolved. What follows is an examination of what three decades of data reveal about the relationship between high gas prices and stock market performance, how the current episode compares structurally to 2008 and 2022, and what the range of outcomes looks like for investors over the next six to twelve months.
The $4.25 per gallon reading for the week ending 27 April 2026 is not just high in absolute terms. It is statistically exceptional. Since the Energy Information Administration (EIA) began tracking weekly averages in 1993, prices have exceeded $4.00 per gallon in only 44 weeks out of roughly 1,700 total weeks.
$4.00+ per gallon in only 44 weeks out of more than 1,700 since 1993, fewer than 3% of all weeks.
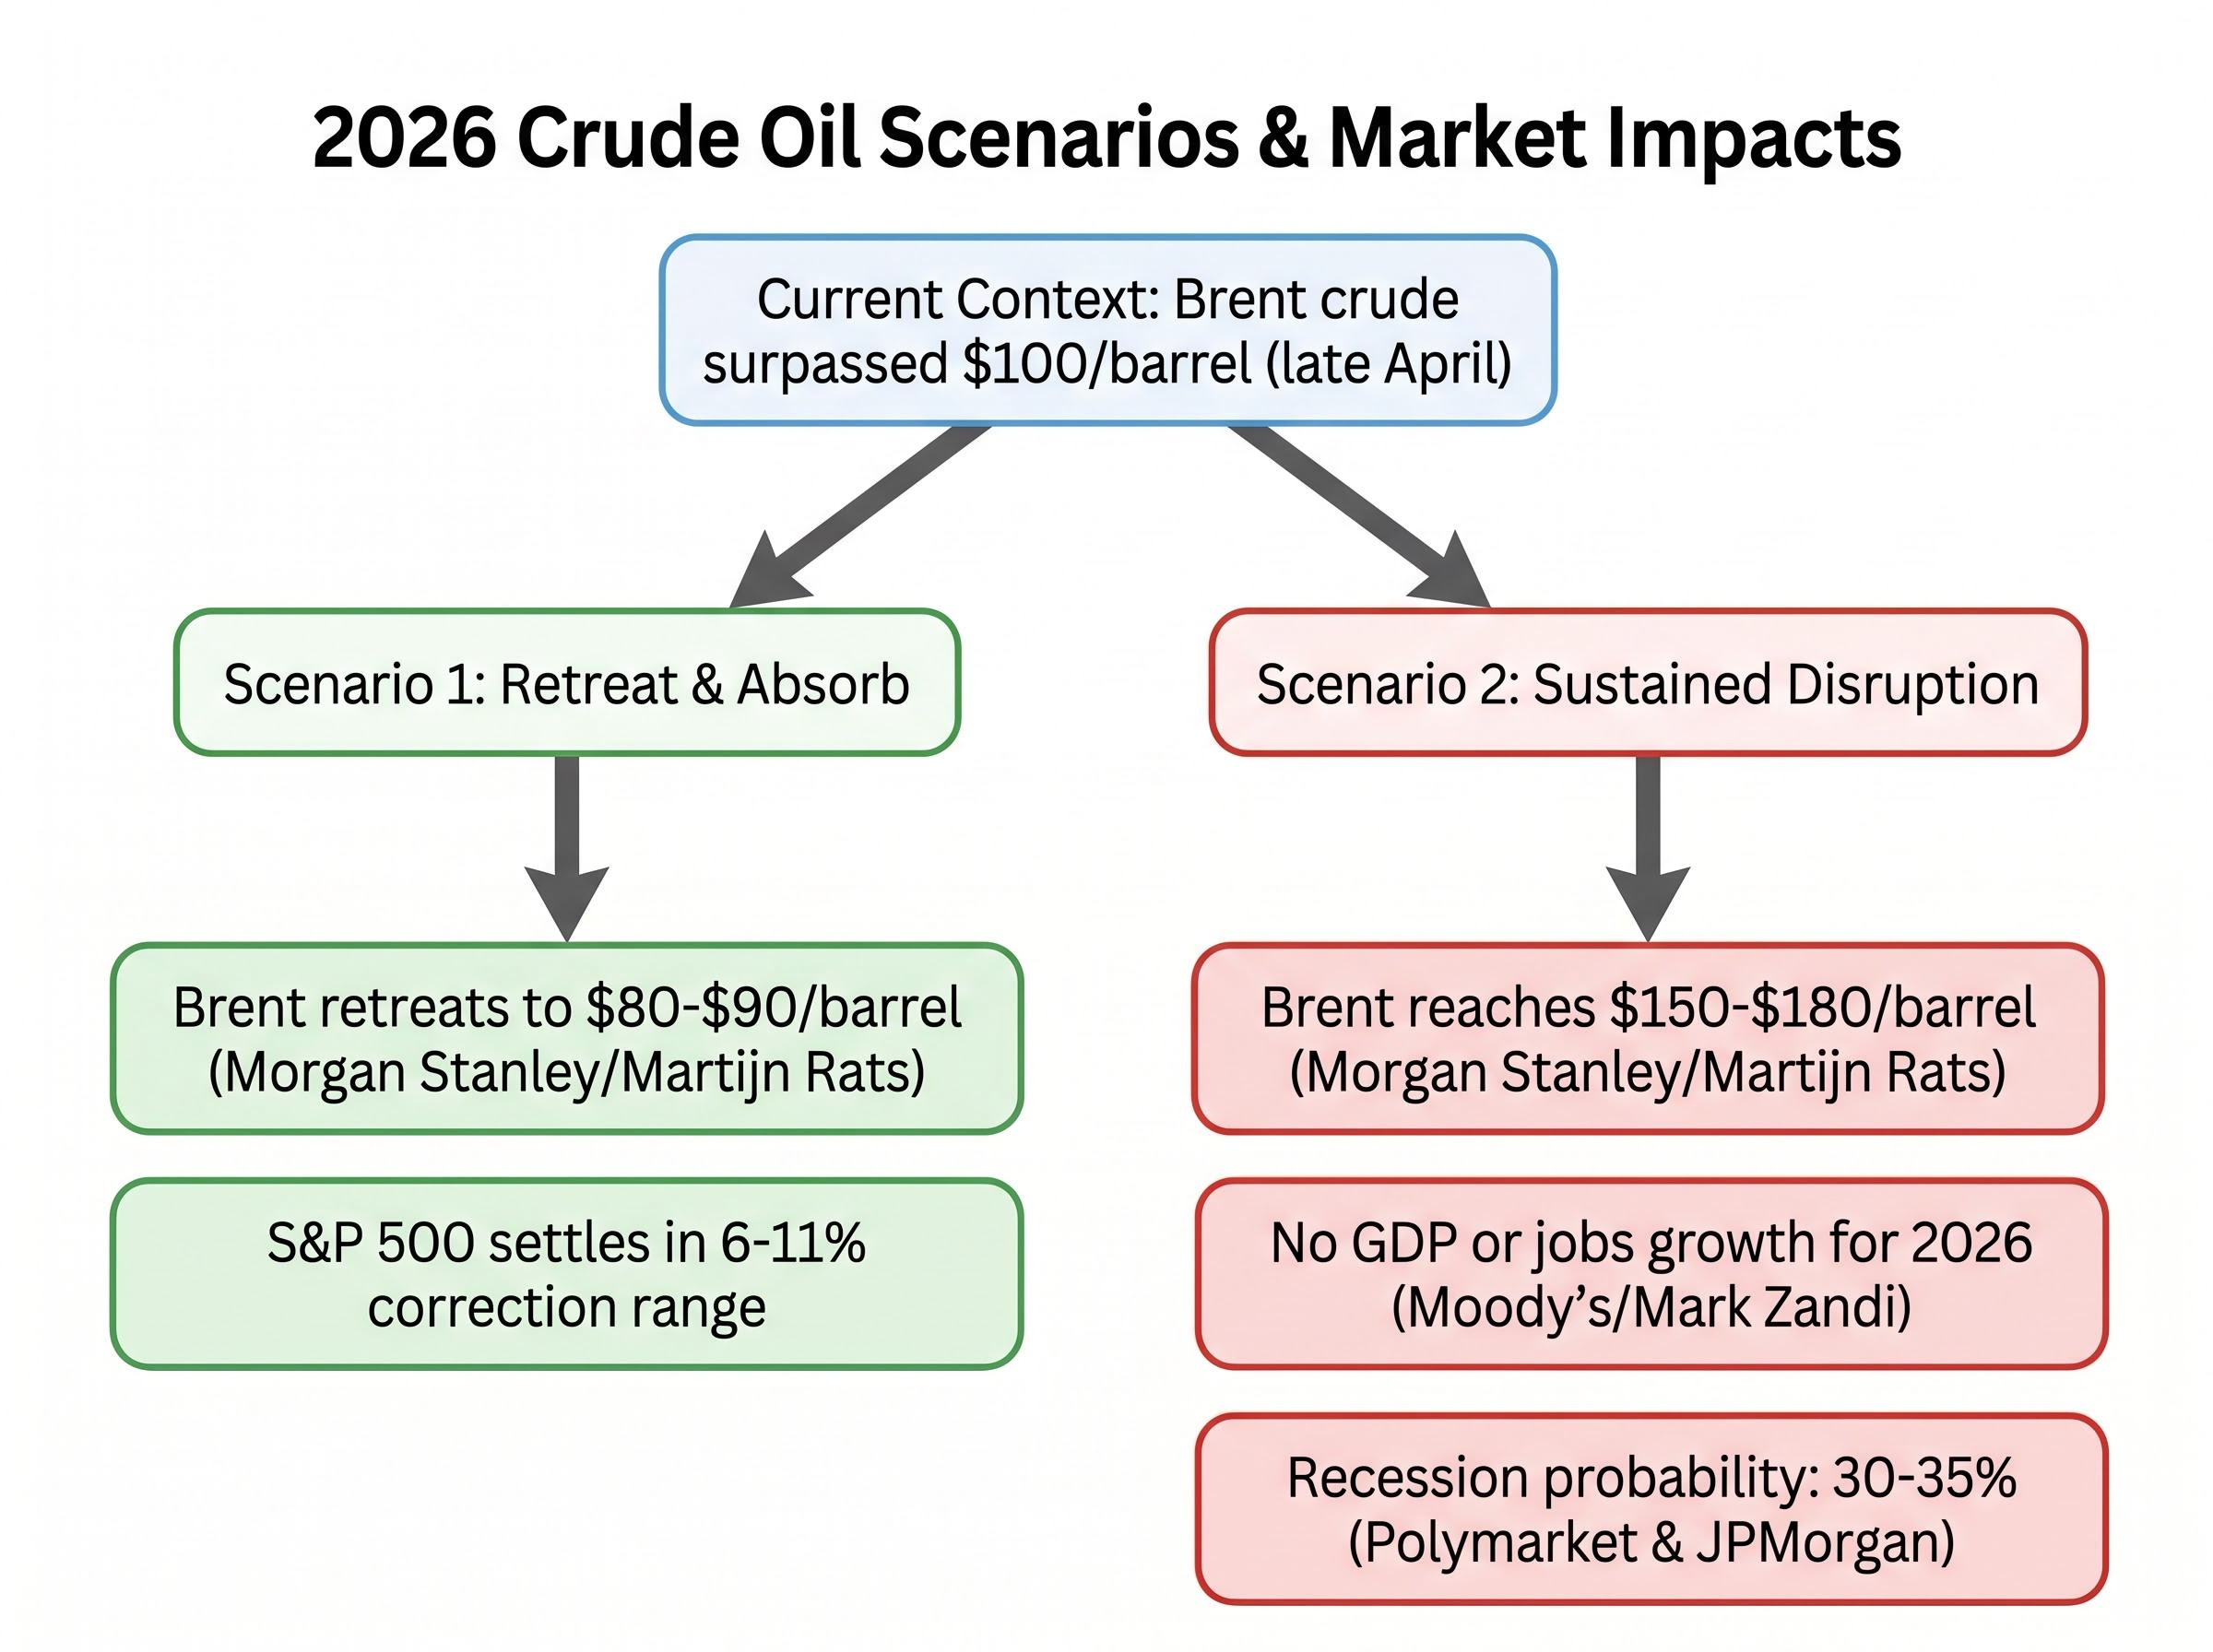
The level alone does not tell the full story. The speed of the ascent is what makes this episode structurally dangerous. Prices rose 45% from 1 January 2026, with Brent crude surpassing $100 per barrel in late April, up from approximately $65 per barrel at the start of the year, a gain of more than 50% year-to-date. That velocity of increase, driven by a supply-side shock rather than organic demand growth, distinguishes this episode from past demand-driven spikes.
The three prior instances when national averages sustained above $4.00 offer the closest historical parallels:
Each of those episodes preceded or accompanied a significant equity market correction.
The starting point is the six-month window following each of those 44 weeks when gasoline exceeded $4.00 per gallon. Across that entire data set, the S&P 500 declined by an average of 11%, according to historical analysis cited by Trevor Jennewine. The consistency of that pattern across structurally different periods, a financial crisis in 2008, a geopolitical supply squeeze in 2011-2013, and a wartime commodity shock in 2022, is what gives the figure its analytical weight.
The average masks a wider distribution. IndexBox analysis published in April 2026 identified three sustained above-$4 episodes, each associated with an S&P 500 bear market, with an average peak-to-trough decline of 41%. That figure represents the worst-case historical range, not the base case. The distinction matters: the 11% six-month average captures the typical correction; the 41% figure captures the recessionary tail.
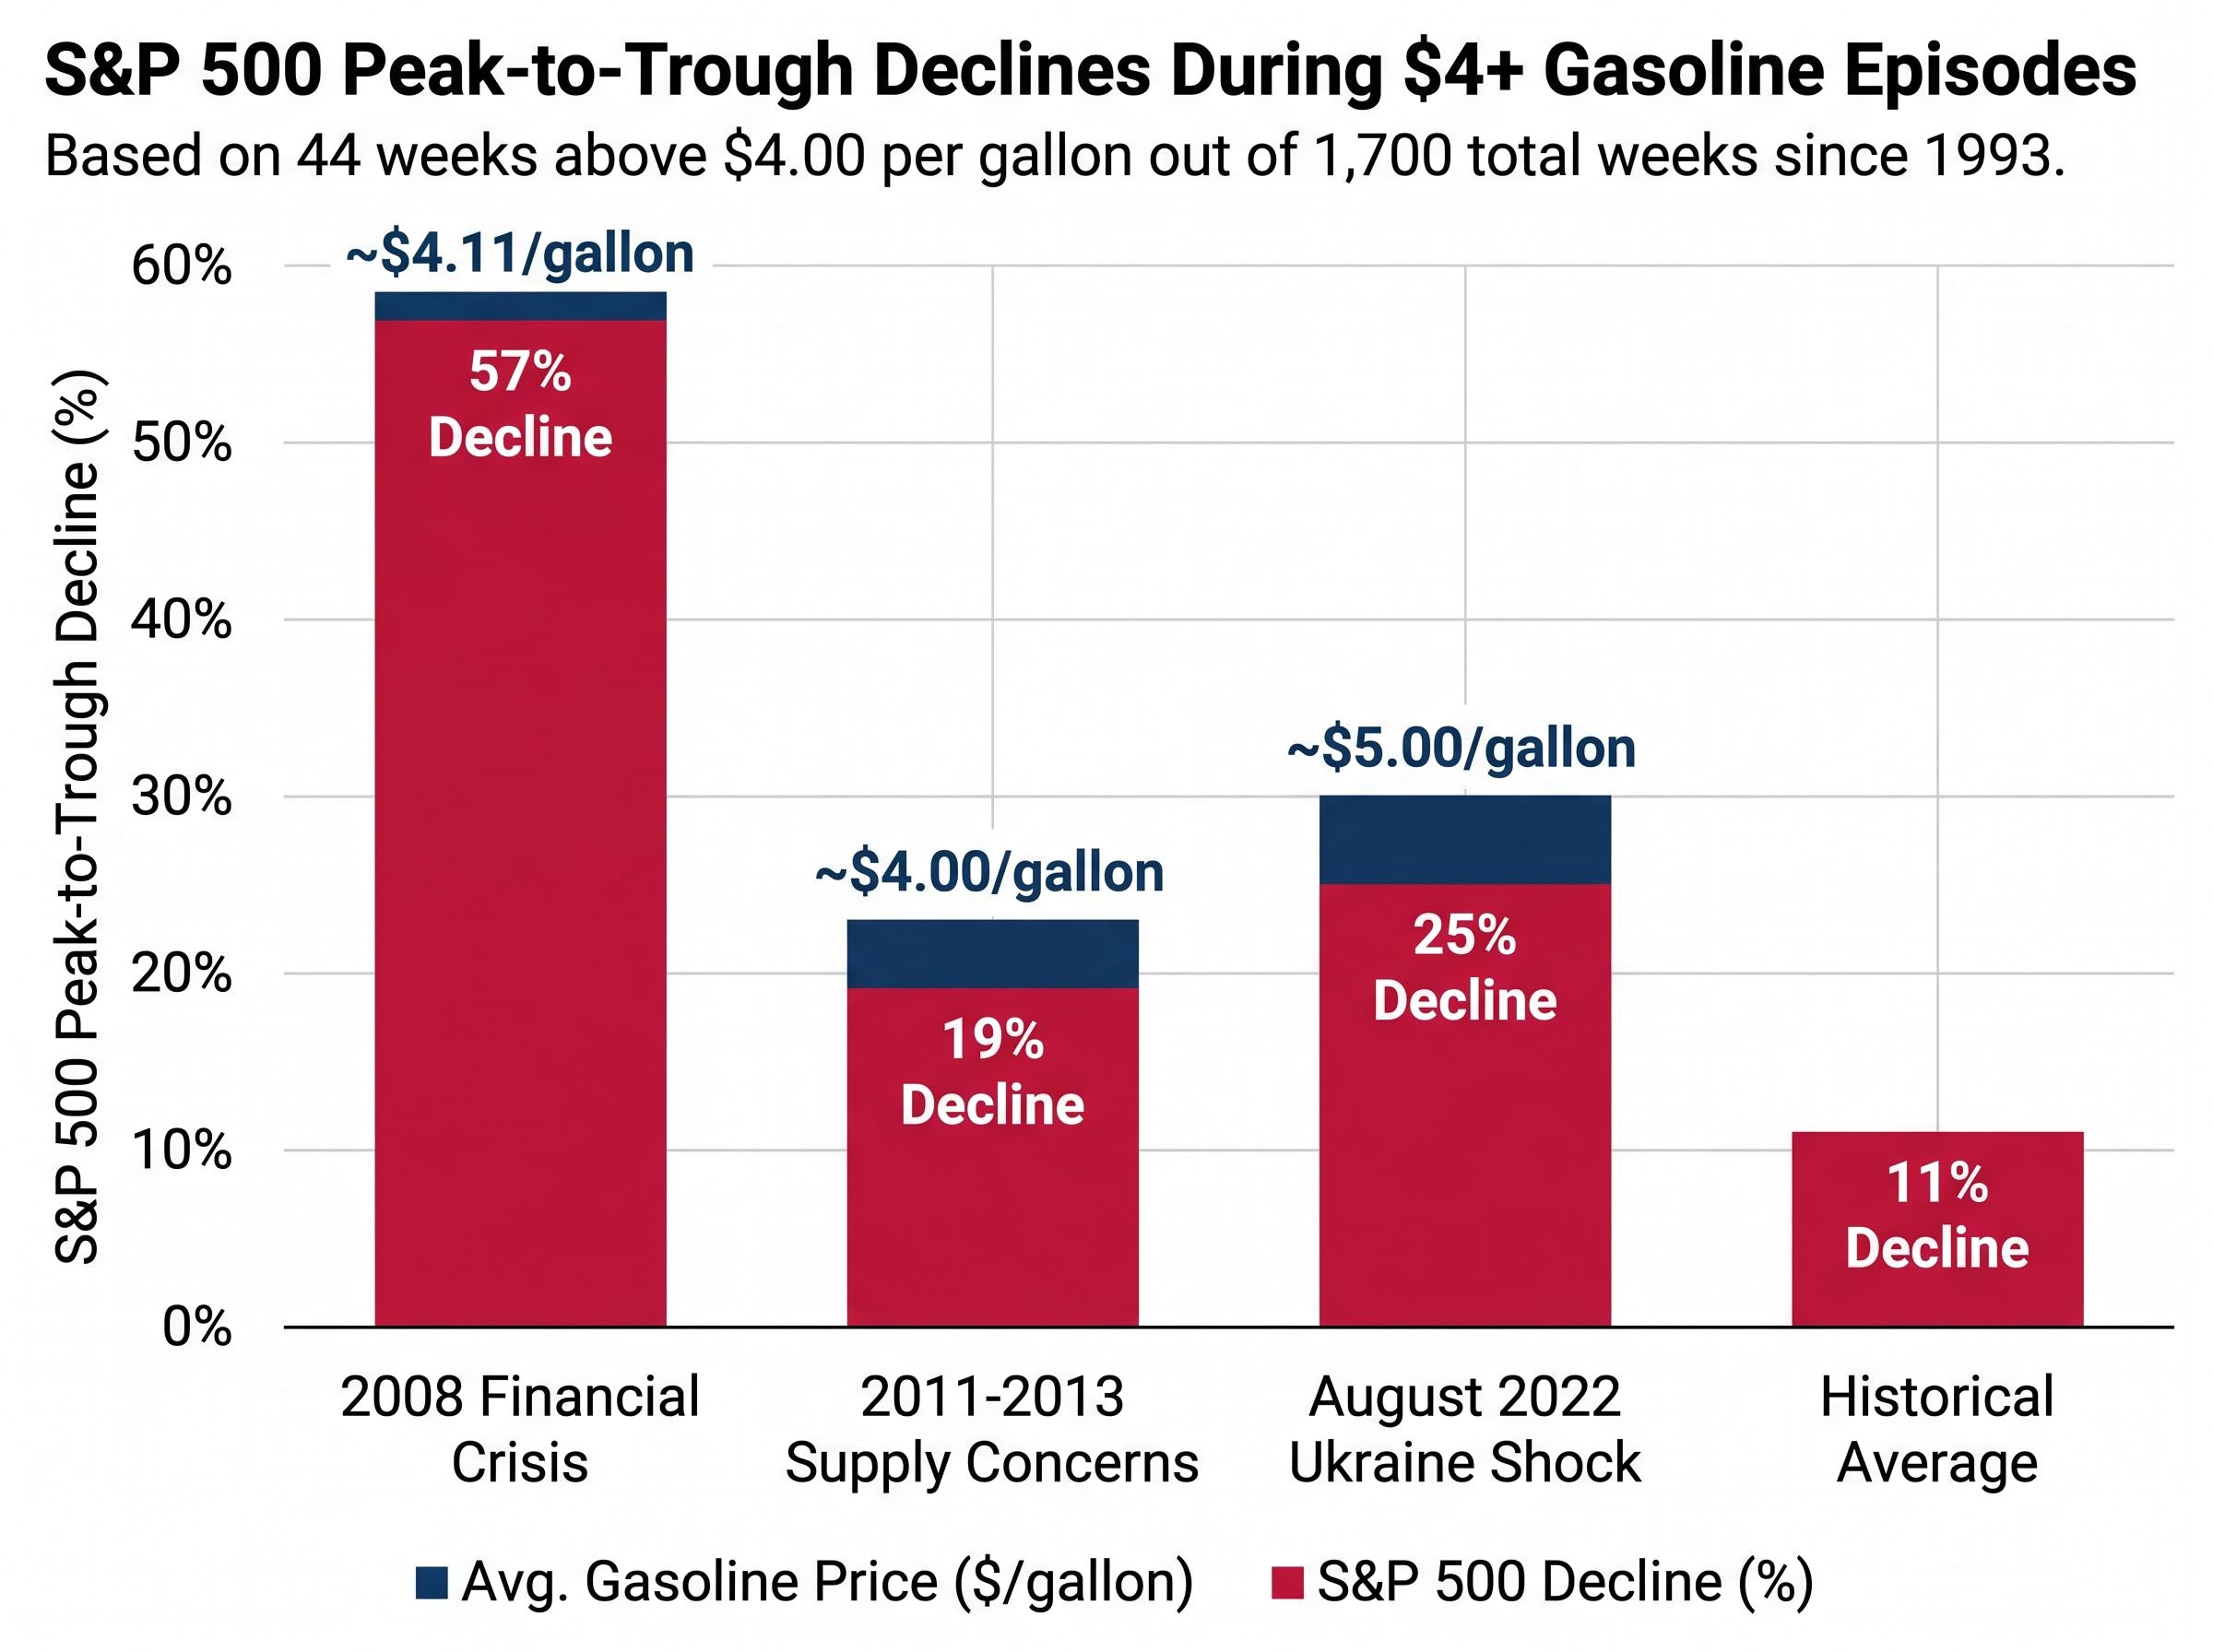
| Episode | Approximate Price Peak | Duration Above $4 | S&P 500 Peak-to-Trough Decline |
|---|---|---|---|
| 2008 Financial Crisis | ~$4.11/gallon | Several weeks | ~57% |
| 2011-2013 Supply Concerns | ~$4.00/gallon | Extended (multiple quarters) | ~19% |
| August 2022 Ukraine Shock | ~$5.00/gallon | Several weeks | ~25% |
In the six months following weeks when gasoline topped $4.00 per gallon, the S&P 500 declined an average of 11%.
Since 1957, the S&P 500 has declined by an average of 32% during recessionary periods. With the index currently at 7,138.80, approximately 6% below its January record high, the gap between where markets sit today and where history suggests they could land is the analytical question that matters most.
The correlation between high gasoline and lower equity prices is not coincidence. It operates through three specific transmission channels, each of which is already showing measurable activity in 2026.
U.S. retail sales surged 1.7% in March 2026 to $752.1 billion, but the headline figure was inflated by higher gasoline receipts. Underlying discretionary spending showed signs of softness that the top-line number obscured.
EIA data shows weekly gasoline demand decreased from 8.68 million barrels per day to 8.56 million barrels per day as of the 15 April 2026 reporting period. That week-over-week decline may appear modest, but it carries a specific historical signal.
GasBuddy’s Patrick De Haan noted early signs of consumer pullback by 21 March 2026. Tom Kloza of Gulf Oil warned of a consumer “breaking point” above $4 per gallon, referencing the 2022 demand destruction episode when prices reached $4.50-$5.00 per gallon. Demand destruction eventually pulls prices lower, but it first confirms that consumers have already curtailed spending. The relief comes after the damage, not before it.
The index-level decline of 6% understates the divergence beneath the surface. Some sectors are absorbing the full force of the energy shock while one sector is capturing the upside.
| Sector | Direction of Impact | Mechanism | Named Example |
|---|---|---|---|
| Airlines | Negative | Elevated fuel as a percentage of operating costs | JetBlue |
| Trucking/Logistics | Negative | Fuel surcharges pressuring customer margins | UPS |
| Consumer Discretionary | Negative | Household budget reallocation away from discretionary spending | Sector down ~5.3% in March 2026 |
| Energy | Positive | Commodity price surge boosting earnings | Exxon Mobil |
| Fixed Income/Cash | Inflows | Risk-off capital rotation to Treasuries and money markets | U.S. Treasury bonds, money market funds |
Exxon Mobil has seen earnings and stock performance boosted by the commodity price surge, while investors have simultaneously shifted capital toward U.S. Treasury bonds and money market funds following the onset of the Iran conflict. This internal rotation means the S&P 500’s headline performance can mask significantly more severe damage in consumer-facing and transportation-heavy parts of the market. An investor with heavy discretionary or logistics exposure faces a materially different risk profile than the index suggests.
The S&P 500 at 7,138.80 reflects a market that has priced in something between two distinct outcomes but has not resolved which one will materialise. Both deserve equal analytical weight.
This scenario requires three conditions to hold:
If these conditions are met, the S&P 500 likely settles within the 6-11% correction range suggested by the six-month historical average. WTI crude has already pulled back to approximately $83.85 per barrel following the partial reopening of the Strait of Hormuz, which lends some support to this scenario.
If the disruption extends for several months, the numbers change materially:
Moody’s Mark Zandi projects no GDP or jobs growth for 2026 even in a rapid de-escalation scenario, with unemployment expected to rise.
The S&P 500 recovered its initial 9% decline from the March peak by late April, suggesting markets are not yet pricing the adverse scenario. That recovery could reflect genuine confidence in de-escalation, or it could reflect the kind of bear market rally that preceded deeper declines in 2008.
The S&P 500 at 7,138.80 has declined 6% from its January record high. The historical range for sustained above-$4 gasoline episodes runs considerably wider:
From a 6% current decline, history suggests outcomes ranging from an 11% six-month average correction to a 41% peak-to-trough bear market.
The one variable most likely to determine which end of that range materialises is whether crude oil prices sustain below the level needed to pull retail gasoline back under $4 per gallon before consumer and corporate damage becomes self-reinforcing. WTI at approximately $83.85 per barrel represents a significant retreat from the $118 per barrel peak, but it remains elevated relative to pre-conflict levels.
Historical data does not guarantee outcomes. The 2011-2013 episode saw a modest correction rather than a full bear market, while 2008 produced the deepest decline in a generation. What three decades of data do provide is a probability-weighted framework, one that places the current 6% decline at the mild end of a distribution that has historically extended much further when gasoline prices stayed above $4 for an extended period.
This article is for informational purposes only and should not be considered financial advice. Investors should conduct their own research and consult with financial professionals before making investment decisions. Past performance does not guarantee future results. Financial projections are subject to market conditions and various risk factors.
Historical data since 1993 shows the S&P 500 has declined an average of 11% in the six months following weeks when national average gasoline prices exceeded $4.00 per gallon. In the worst sustained episodes, peak-to-trough declines reached 32-41%.
High gasoline prices act like a tax on households by redirecting spending away from discretionary goods and services toward fuel costs, which compresses corporate earnings and can trigger a self-reinforcing demand destruction cycle. The consumer discretionary sector fell approximately 5.3% in March 2026 as this dynamic took hold.
The 2026 spike shares key structural features with both prior episodes: it is supply-side driven rather than demand-led, and it has been rapid, with prices rising 45% from January 2026 following the Iran conflict and Strait of Hormuz disruption. The 2008 episode preceded a 57% S&P 500 decline, while the 2022 Ukraine shock coincided with a roughly 25% drawdown.
Energy companies such as Exxon Mobil benefit directly from higher commodity prices, while airlines, trucking and logistics firms, and consumer discretionary stocks absorb the heaviest damage through higher operating costs and reduced consumer spending. Investors have also rotated into U.S. Treasury bonds and money market funds as a risk-off response.
If crude oil remains elevated and retail gasoline stays above $4.00 per gallon, the S&P 500 faces a historical range of outcomes from an 11% six-month average correction to a 32-41% peak-to-trough bear market decline. Recession probability estimates cited by JPMorgan and Polymarket sit in the 30-35% range, with Moody's projecting no GDP or jobs growth for 2026 even under a rapid de-escalation scenario.