Lululemon Plunges 12% on CEO Pick Amid Activist Investor Battle
23 mins ago

Glanbia PLC delivered a Q1 2026 trading update on 29 April 2026 that blew past consensus on every headline metric. Like-for-like revenue grew 7.2%, nearly double the 4.6% analysts had pencilled in. Volume growth landed at 8.2%, more than triple the 2.5% consensus forecast. The result, the first scheduled update of fiscal 2026, arrived against a backdrop of rising whey input costs and broader caution across consumer staples, making the scale of the beat all the more striking. What follows is a segment-by-segment breakdown of what drove the outperformance, what management has done to guidance, what the whey cost story means for the rest of the year, and why the stock moved the way it did.
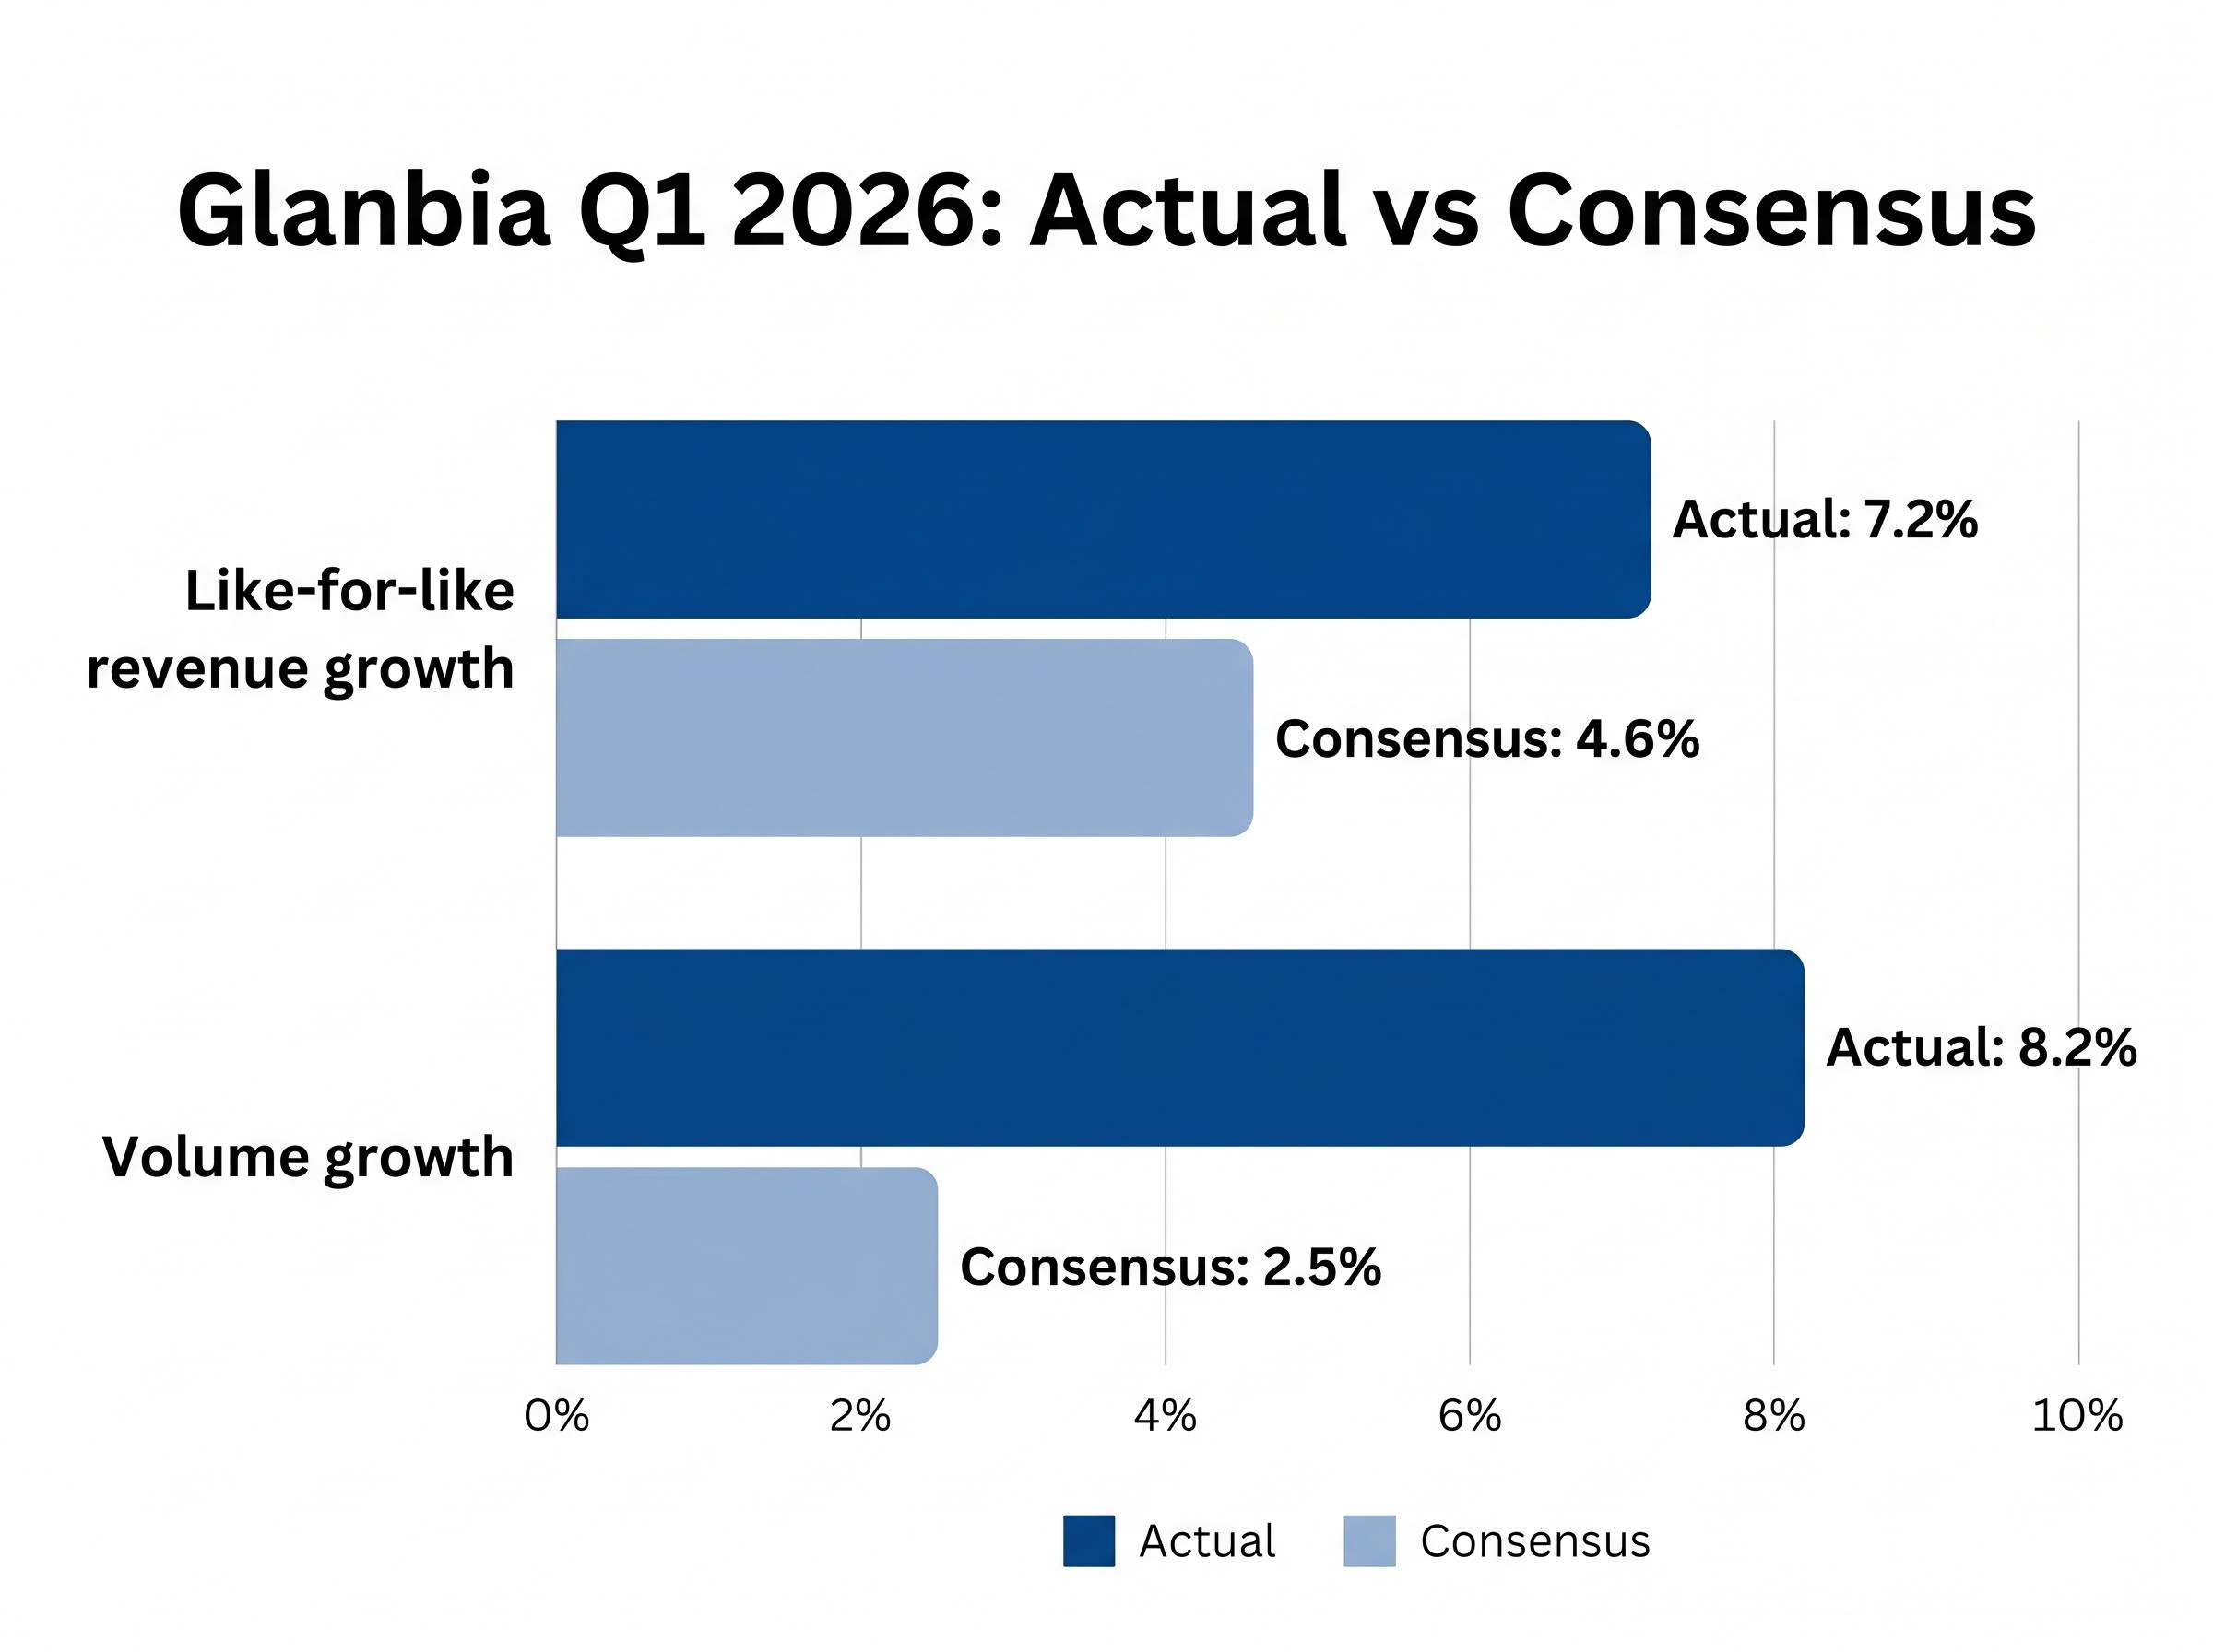
The gap between expectation and reality was wide enough to shift sentiment in a single session. Glanbia posted Q1 2026 like-for-like revenue growth of 7.2%, against a consensus estimate of 4.6%. That alone would have been enough to move the stock. The volume figure made it emphatic.
Volume growth of 8.2% versus a 2.5% consensus forecast confirmed that the beat was demand-led, not a pricing artefact. For a company operating against approximately $3.9 billion in FY2025 revenue, that kind of volume acceleration signals real consumer pull-through rather than opportunistic price-taking.
Both of Glanbia’s operating divisions contributed to the outperformance. The beat was broad-based, a detail that matters when distinguishing a one-quarter anomaly from a genuine step-change in trading momentum.
| Metric | Glanbia Q1 2026 Actual | Analyst Consensus |
|---|---|---|
| Like-for-like revenue growth | 7.2% | 4.6% |
| Volume growth | 8.2% | 2.5% |
The aggregate numbers told a strong story. The divisional breakdown made it stronger.
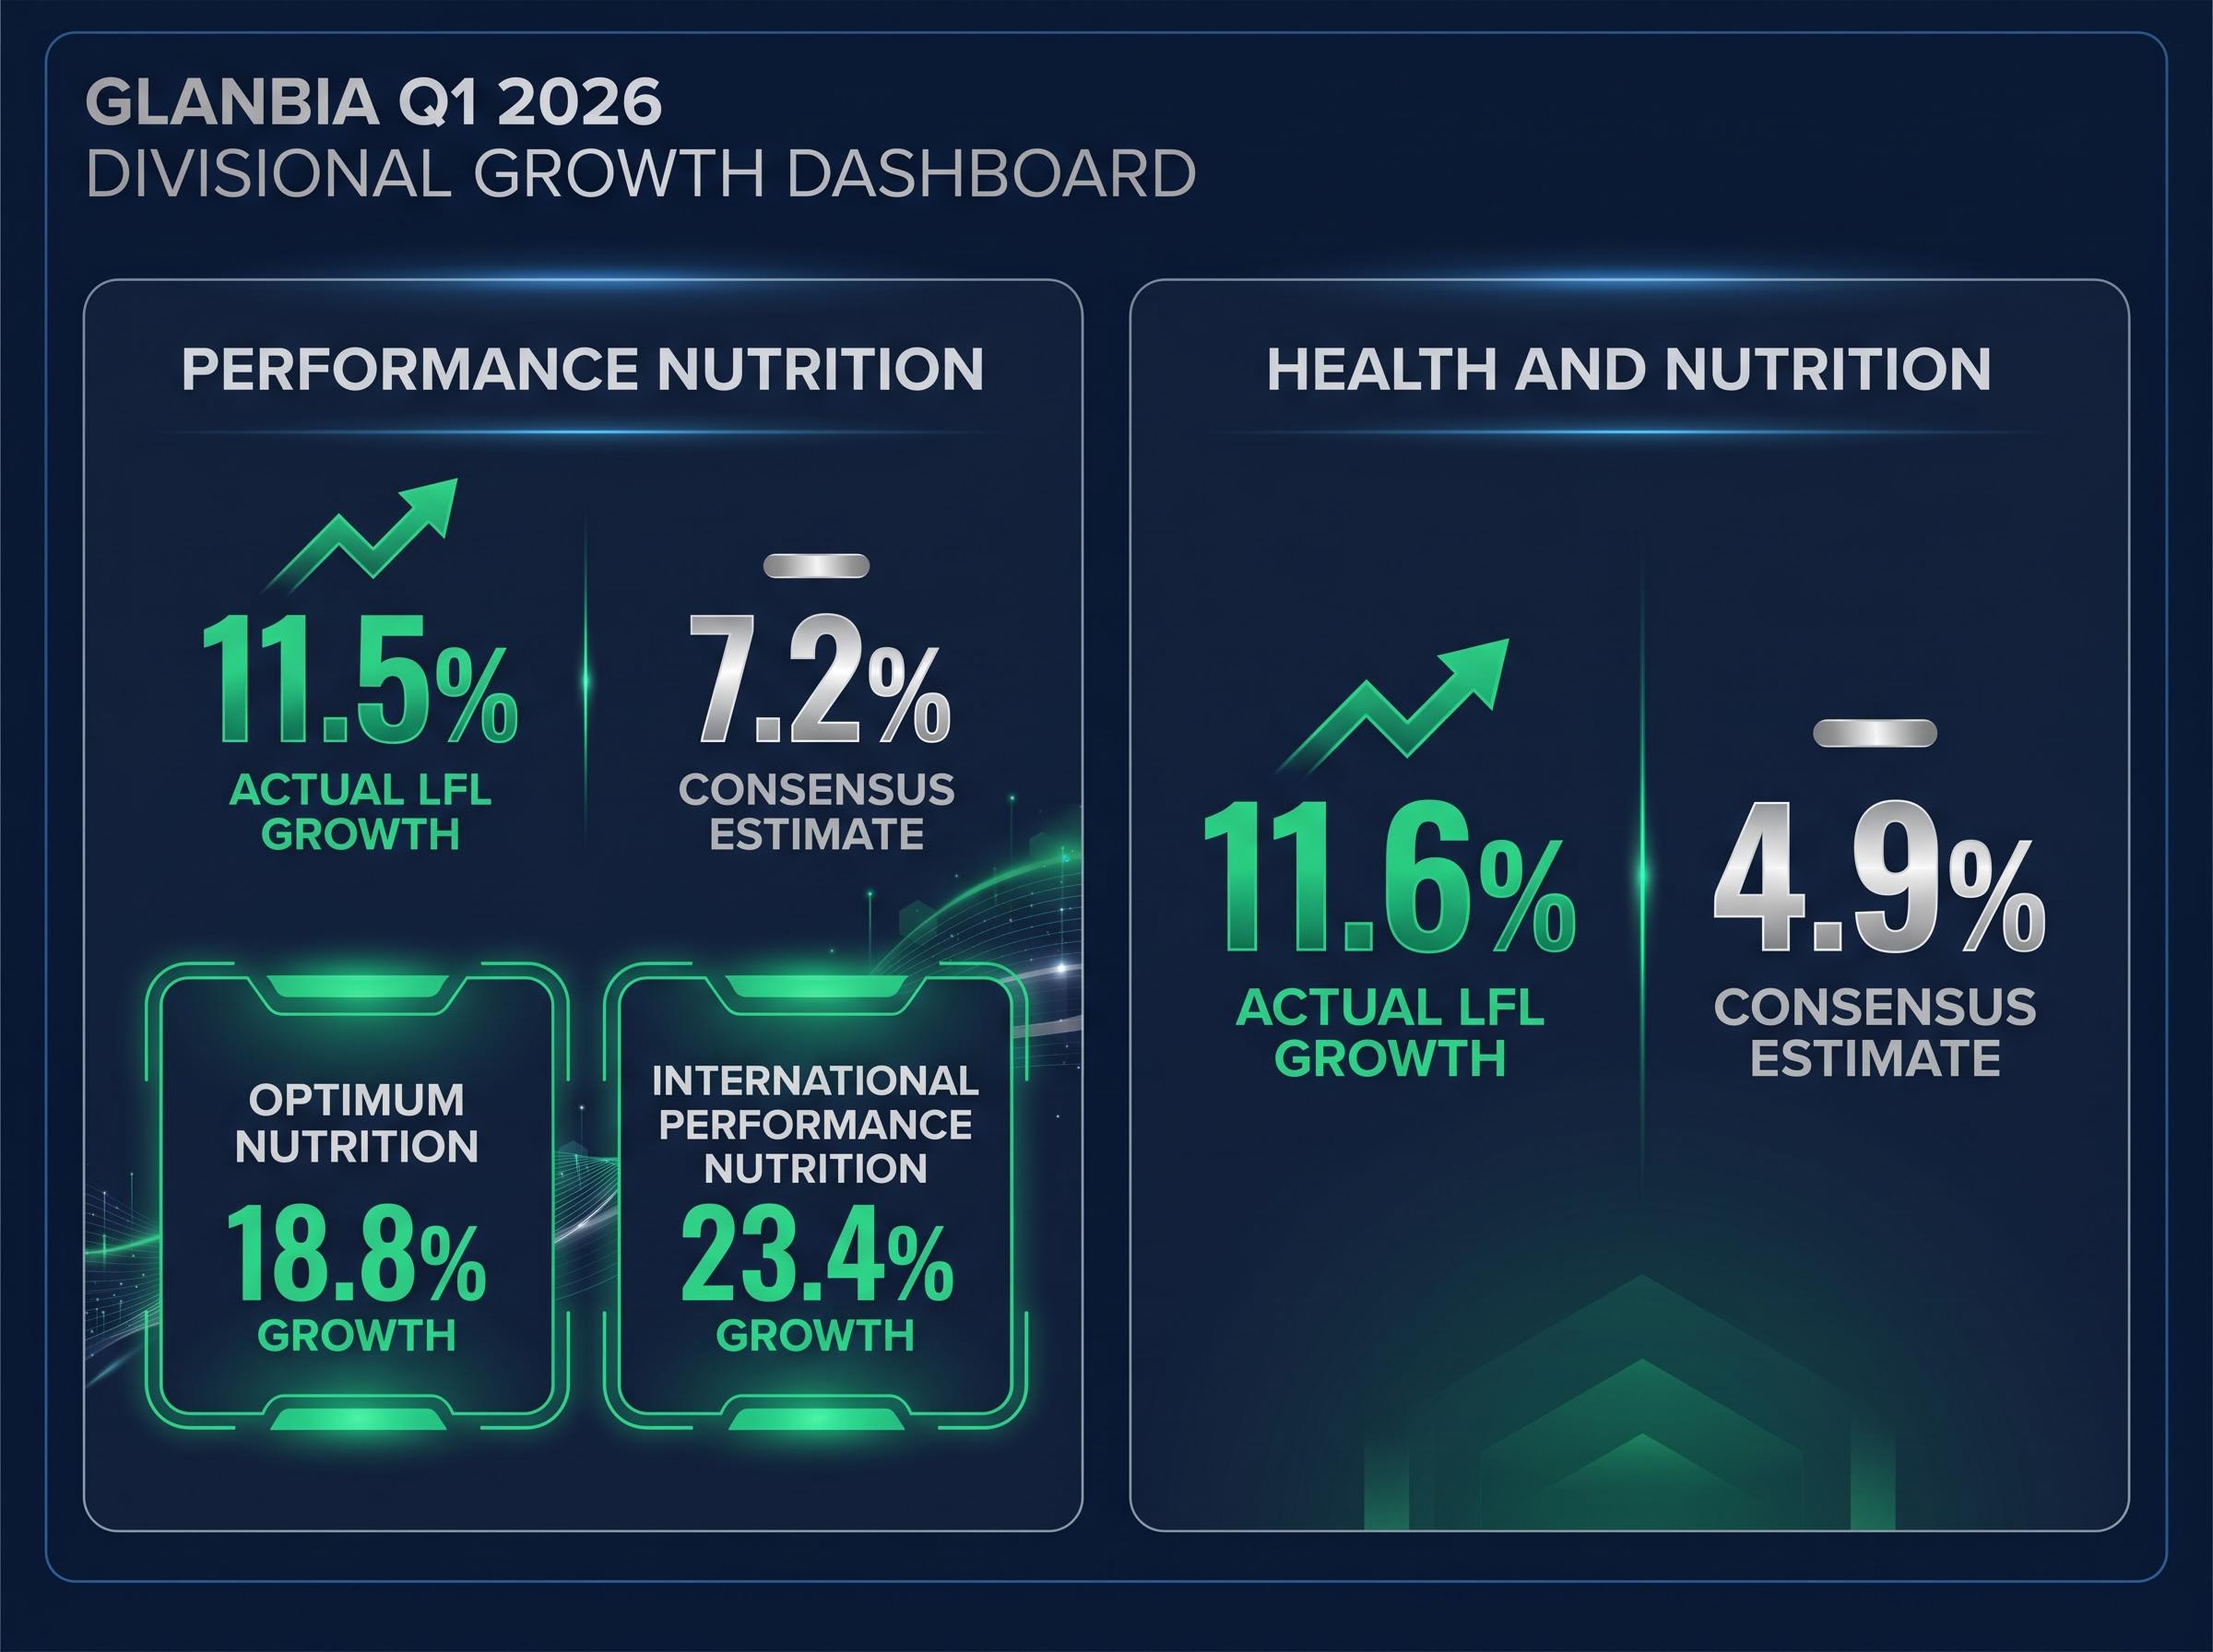
Performance Nutrition delivered like-for-like growth of 11.5%, comfortably ahead of the 7.2% consensus expectation. Within that segment, Optimum Nutrition was the standout, posting 18.8% growth in Q1 2026 on the back of sustained demand for its flagship product lines:
International Performance Nutrition expanded 23.4%, a figure that suggests geographic diversification is translating into incremental revenue rather than simply redistributing existing demand.
Branded product mix is emerging as a consistent differentiator across consumer staples reporting this season, with companies that have concentrated revenue in owned-brand lines showing greater pricing resilience; SPC Global’s Q3 FY26 update, published in early April 2026, showed branded product mix lifting from 77% to 81% quarter-on-quarter as the company reaffirmed its 25% EBITDA growth target, echoing the structural advantage Glanbia derives from its Optimum Nutrition flagship.
Euromonitor protein demand research published in late 2025 found that women now outnumber men globally in seeking higher protein intake, a structural broadening of the addressable market that helps explain why international volumes for brands such as Optimum Nutrition continue to accelerate beyond traditional sports nutrition demographics.
Health and Nutrition matched its sibling with like-for-like growth of 11.6%, against a consensus estimate of just 4.9%. Proportionally, this was the larger surprise. Investors have historically assigned the highest growth premium to Performance Nutrition; the fact that Health and Nutrition delivered an even wider beat relative to expectations may prompt a reassessment of that segment’s contribution to the investment case.
| Segment | Actual LFL Growth | Consensus Estimate |
|---|---|---|
| Performance Nutrition | 11.5% | 7.2% |
| Health and Nutrition | 11.6% | 4.9% |
An Interim Management Statement (IMS) is a scheduled trading update issued by companies listed on European exchanges, typically covering revenue and volume trends for a defined period. It does not include audited earnings per share or net income figures.
That distinction matters. An IMS confirms trading momentum, not bottom-line profit.
An IMS confirms trading momentum, not bottom-line profit. Revenue and volume trends are disclosed, but audited earnings per share and net income are not.
Glanbia’s fiscal year 2025 ended on 3 January 2026, making Q1 2026 the January-to-March 2026 trading period. This IMS is the first scheduled update of the new fiscal year, meaning it sets the tone for the full-year narrative. The next full results disclosure, expected at the half-year mark, will provide the first audited EPS figure of fiscal 2026. Until then, like-for-like growth and any guidance revision are the metrics that carry the most weight.
Management did not just report a strong quarter. They acted on it.
Fiscal 2026 adjusted EPS growth guidance has been narrowed to the upper end of the 7-11% range, implying approximately 9% growth at the midpoint. That sits above Bloomberg consensus of approximately 8%, a deliberate signal that the Q1 momentum is not being treated as a one-off.
The Dairy Nutrition EBITDA guidance was lifted to $160-170 million, up from the prior $150-160 million range. A combination of higher whey pricing flowing through ingredient sales and strong Q1 volume performance underpinned the revision.
Performance Nutrition organic sales growth guidance moved to the upper end of the 5-7% medium-term target range.
The three guidance revisions in summary:
EPS guidance versus consensus: Management’s implied midpoint of approximately 9% adjusted EPS growth sits above the Bloomberg consensus estimate of approximately 8%.
A guidance raise this early in the fiscal year, before tariff and currency risks have fully resolved, typically prompts upward earnings revisions from sell-side analysts. Management acknowledged potential volume elasticity from April price increases, yet still chose to raise guidance, a move that communicates conviction in sustained demand.
Guidance downgrades in consumer staples have been a recurring theme in the April 2026 reporting cycle, with a2 Milk slashing its FY26 EBITDA margin target from 15.5-16.0% to 14.0-14.5% after supply chain disruptions concentrated in China pushed revenue recognition into FY27, a stark contrast to the conviction Glanbia’s management displayed in raising its own outlook.
The Q1 numbers were recorded before Glanbia enacted double-digit percentage price increases in April 2026 to offset elevated whey input costs. Those increases post-date the reporting period, meaning the consumer response is not yet visible in the data.
With whey protein prices hitting record highs in early 2026, the cost pressures facing Performance Nutrition manufacturers have become acute enough to reshape investment decisions and pricing strategies across the global dairy ingredients sector.
Management has acknowledged that some demand elasticity is expected over the remainder of fiscal 2026 as higher retail prices reach consumers. The question is not whether volumes will soften, but by how much.
Q1’s 8.2% volume growth sets the baseline. Any material compression in Q2 would raise questions about whether the upper-end EPS guidance can hold.
Glanbia’s integrated business model provides a partial cushion. The Dairy Nutrition segment processes and sells whey as an ingredient, meaning rising whey prices that increase Performance Nutrition’s input costs simultaneously benefit Dairy Nutrition’s revenues and margins. The $160-170 million EBITDA guidance raise for Dairy Nutrition reflects exactly this dynamic.
This structural feature does not eliminate margin risk, but it does mean that whey price volatility flows through both sides of the ledger rather than hitting one division unchecked. Q2 2026 volume data will be the definitive test of whether April’s price increases dampen the consumer demand momentum that defined Q1.
Supplier cost pressures have produced very different outcomes across consumer staples this reporting season: McPherson’s abandoned its FY26 EBITDA growth target entirely in late April 2026 after external supplier surcharges and an operating model transition combined to push sales below expectations, illustrating why Glanbia’s integrated whey processing capability, which buffers input cost volatility through the Dairy Nutrition segment, represents a structural advantage rather than a coincidental one.
The market’s response was immediate and unambiguous. Glanbia PLC (ticker: GL9, Euronext Dublin) gained 8.6% in a single session on 29 April 2026.
GL9 rose 8.6% on 29 April 2026, its largest single-day move in over a year.
For a large-cap nutrition stock, an 8.6% single-session move is a meaningful reaction by any measure. It reflects not just the Q1 beat but the guidance revision and the breadth of divisional outperformance that underpinned it.
The next substantive data point will be Glanbia’s half-year 2026 results, which will provide the first audited profit disclosure of fiscal 2026 and the first read on whether Q2 volumes held up after the April price increases.
Three pillars defined the Q1 story: a broad-based volume beat, dual-segment outperformance that surprised proportionally more in Health and Nutrition, and a guidance raise that landed above consensus. Together, they justified the market’s single-day verdict.
The forward-looking tension is equally clear. Double-digit April price increases are now in the market, and Q2 volume data will reveal whether consumer demand absorbs the increase or retreats from it. Glanbia’s half-year 2026 results will provide the first definitive read on post-price-increase demand trends and audited EPS delivery against the upgraded guidance range.
This article is for informational purposes only and should not be considered financial advice. Investors should conduct their own research and consult with financial professionals before making investment decisions.
Follow StockWire X for coverage of Glanbia’s half-year 2026 results and ongoing updates on the sports nutrition sector.
An Interim Management Statement is a scheduled trading update disclosing revenue and volume trends without audited earnings figures. For Glanbia, the Q1 2026 IMS was the first update of the new fiscal year, setting the tone for the full-year narrative ahead of the half-year results.
Glanbia posted Q1 2026 like-for-like revenue growth of 7.2% against a consensus estimate of 4.6%, and volume growth of 8.2% versus a 2.5% consensus forecast, with both operating divisions delivering double-digit like-for-like growth.
Management narrowed adjusted EPS growth guidance to the upper end of the 7-11% range (implying approximately 9% growth), raised Dairy Nutrition EBITDA guidance to $160-170 million from $150-160 million, and moved Performance Nutrition organic sales growth guidance to the upper end of the 5-7% medium-term target range.
Rising whey costs increase input expenses for Glanbia's Performance Nutrition segment, but the company's integrated Dairy Nutrition division benefits from higher whey prices as a seller of whey ingredients, partially offsetting the impact and providing a structural hedge against input cost volatility.
The next major data point is Glanbia's half-year 2026 results, which will provide the first audited profit figures of the fiscal year and the first read on whether consumer demand held up after the double-digit April 2026 price increases took effect.