
What Domino’s Q1 Results Reveal About the Consumer Spending Slowdown
15 hrs ago

On 24 April 2026, the S&P 500 and Nasdaq closed at record highs. That same month, the University of Michigan Consumer Sentiment Index printed 49.8, a reading that historically clusters around recession conditions. The gap between those two data points is not a matter of interpretation; it is a measurable divergence between what equity markets are pricing and what households are reporting about their economic reality.
Record index levels are being driven by a narrow band of technology earnings and artificial intelligence (AI) related capital expenditure, while consumer confidence, small business spending intentions, and commercial real estate (CRE) stress metrics are all flashing caution simultaneously. What follows maps the specific data points driving that gap, explains the structural mechanisms that allow it to persist, and identifies what it means for investors trying to assess whether current market valuations are durable or fragile.
The headline numbers are difficult to argue with on their own terms. Consider the snapshot:
The first three items tell a story of an equity market in robust health. The last two tell a different story entirely.
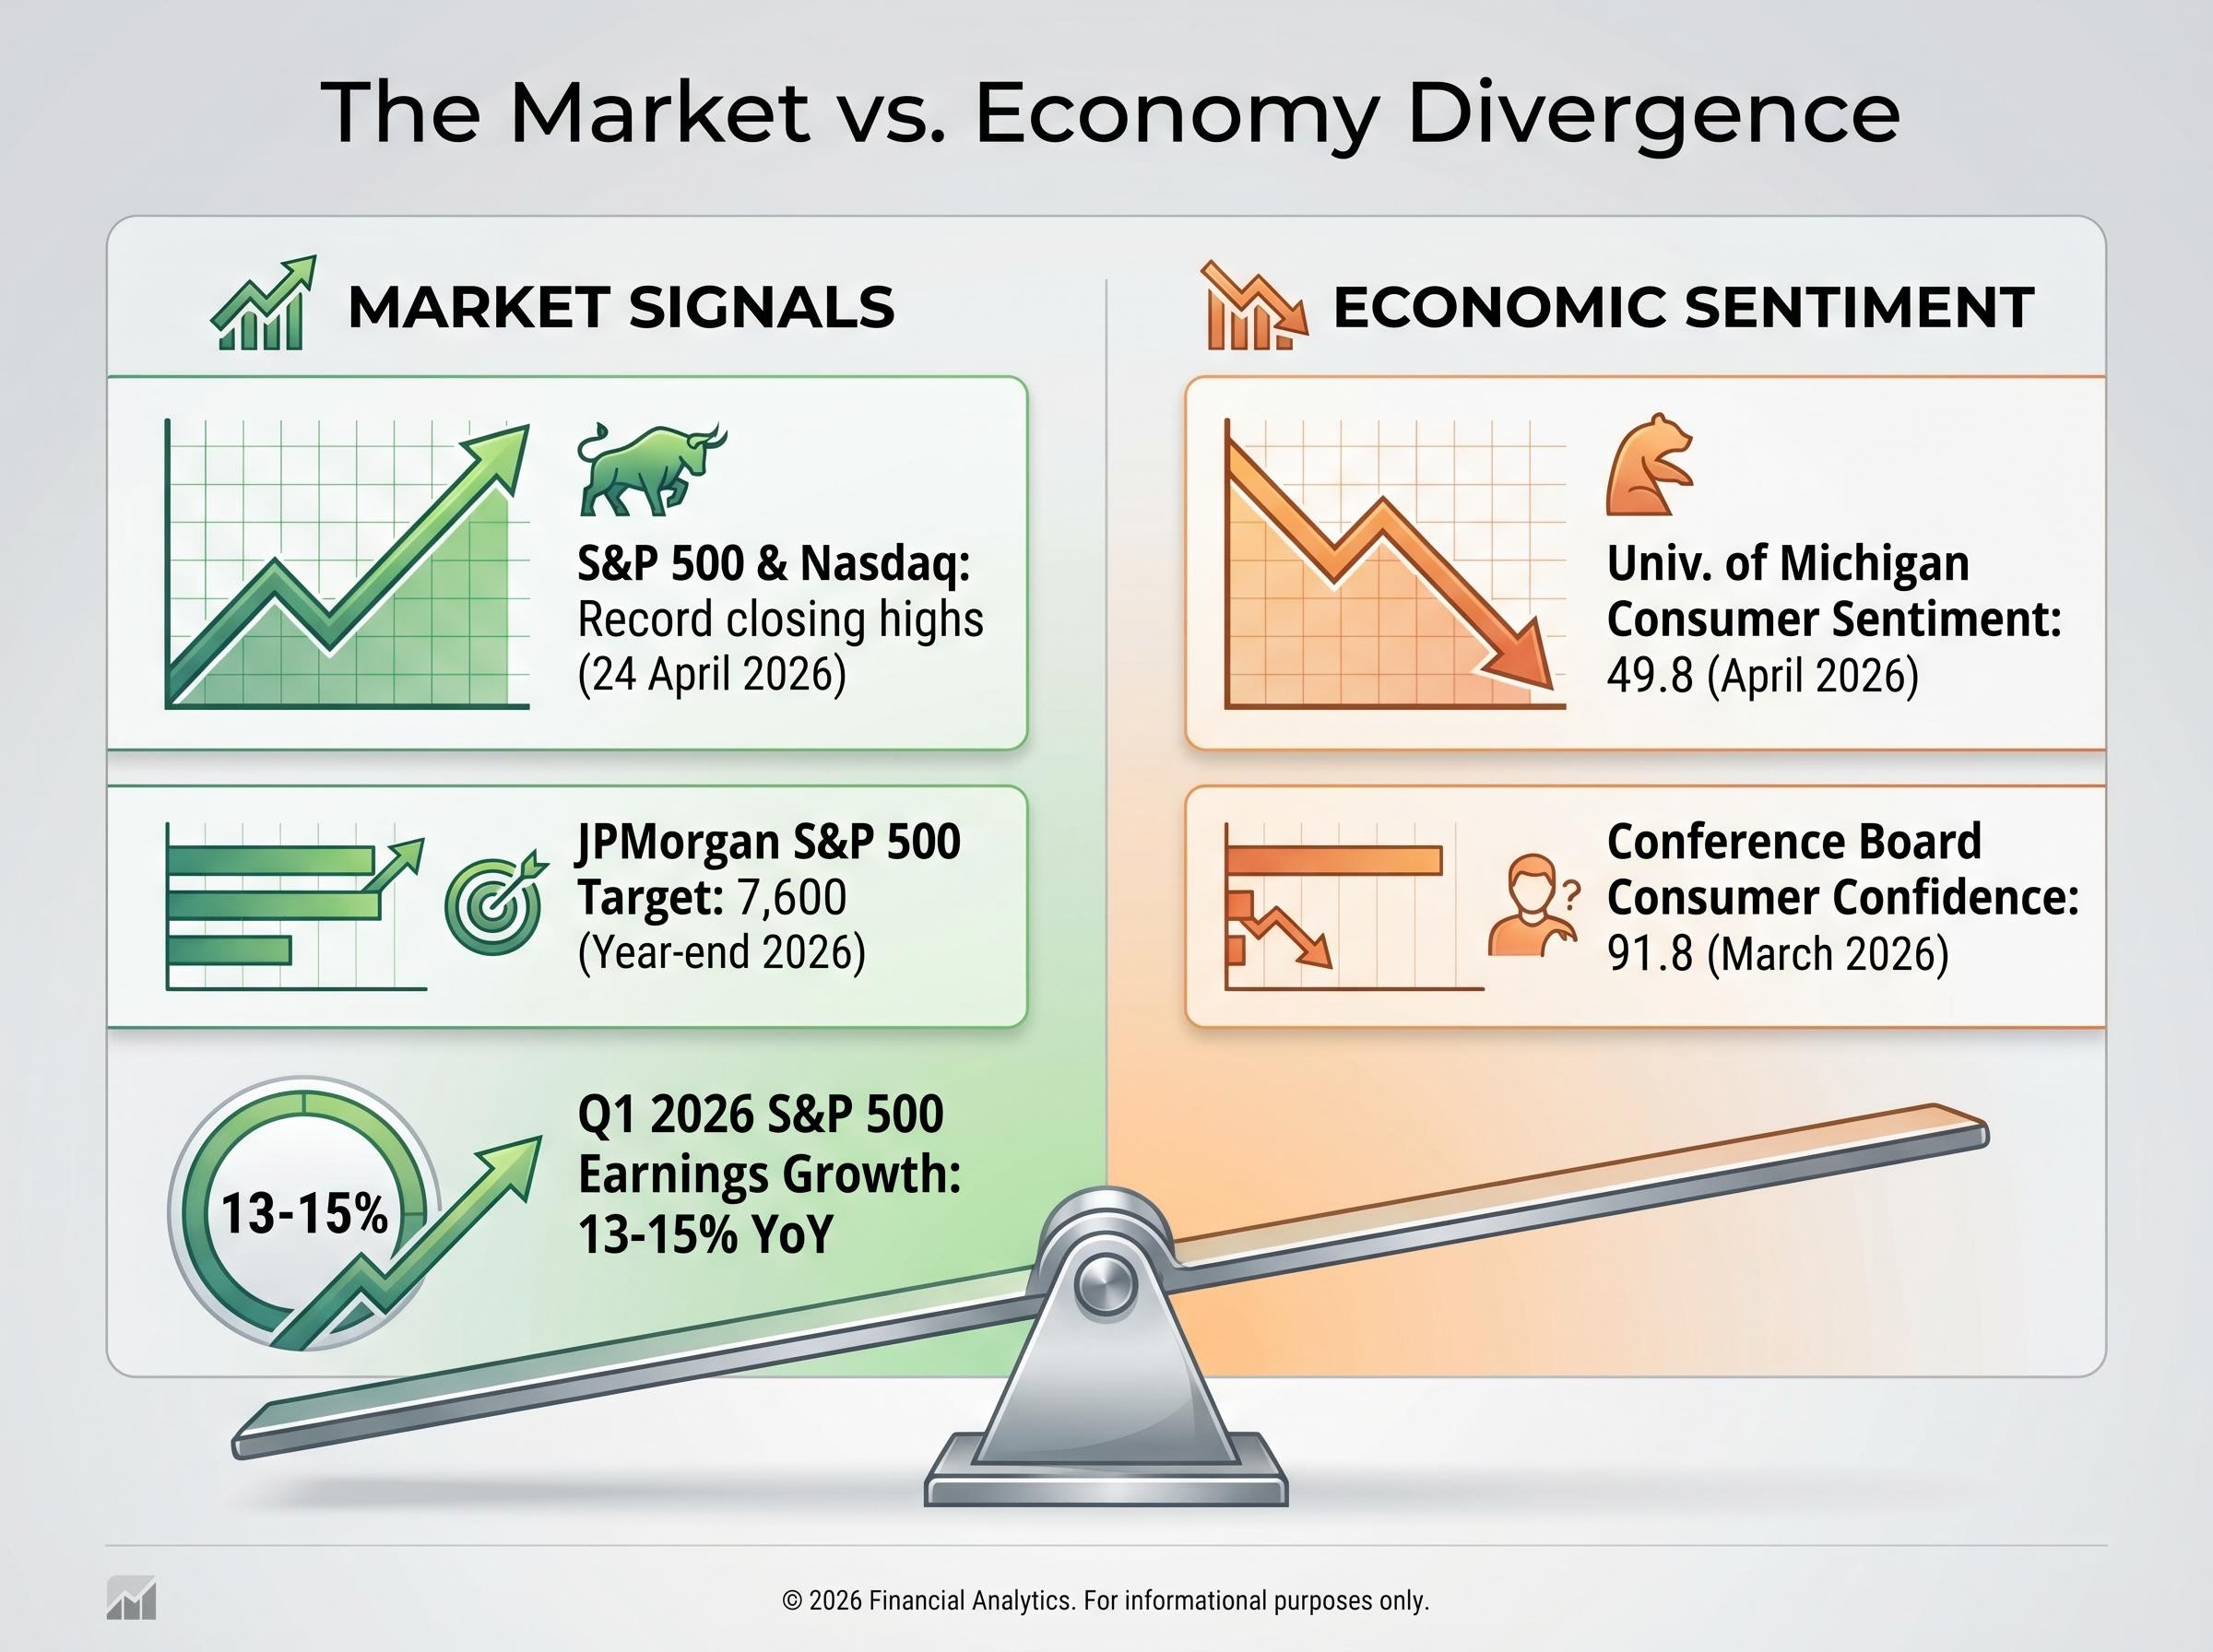
49.8: The April 2026 University of Michigan Consumer Sentiment reading, a level that has historically clustered near recession conditions.
A University of Michigan reading below 50 has not, in modern economic history, coincided with record equity highs. JPMorgan’s revised target reflects genuine optimism about AI-driven earnings momentum, and FactSet’s blended growth figure of 13-15% is strong by any historical standard. Yet those earnings are arriving in an economy where households report a degree of pessimism typically reserved for contractionary periods. The gap between these readings is not marginal. It is the widest it has been in this cycle, and it raises a straightforward question: which set of signals is telling the more accurate story about what comes next?
Two structural mechanisms explain how this divergence can exist without one side being simply “wrong.”
Both mechanisms are well documented. A 1999 Federal Reserve study established that sentiment declines have historically often preceded market corrections, meaning the divergence is not benign by default. Research published in the Journal of International Money and Finance in 2022 added a further layer: monetary policy interventions during low-sentiment phases can temporarily sustain elevated equity valuations by reducing investor fear. The Brookings Institution has framed the current disconnect between aggregate macroeconomic data and household sentiment as a structural paradox in this cycle, not a temporary anomaly.
The Federal Reserve Finance and Economics Discussion Series paper on consumer sentiment and stock market dynamics established empirical evidence that equity price movements and household sentiment can diverge for extended periods before converging, and that the causal pathway from sentiment weakness to spending contraction is more reliable than the reverse.
The S&P 500’s market-capitalisation weighting means a handful of mega-cap technology names can produce headline earnings growth of 13-15% even when earnings outside the technology sector are materially weaker. FactSet’s Q1 2026 reporting confirms that earnings strength remains heavily concentrated in technology. This is a known structural feature that experienced investors adjust for, but it can mislead readers who treat the blended figure as representative of the broad economy. A 15% blended growth rate and a 15% broad-based growth rate are very different economic signals, even though they produce the same headline number.
The two primary consumer sentiment gauges measure slightly different things, and both are weak.
| Index | Latest Reading | Date | Signal |
|---|---|---|---|
| University of Michigan Consumer Sentiment | 49.8 | April 2026 | Bearish |
| Conference Board Consumer Confidence | 91.8 | March 2026 | Bearish |
The University of Michigan index captures how households feel about their personal financial situation and the broader economy. The Conference Board measure places greater emphasis on labour market perceptions and near-term business conditions. Both are declining simultaneously, which makes the signal harder to dismiss as survey noise.
The FRED historical dataset for University of Michigan Consumer Sentiment shows that sub-50 readings have clustered tightly around the recession periods of 1980, 1990-1991, 2008-2009, and 2022, giving the April 2026 print of 49.8 a historically grounded benchmark against which its severity can be assessed.
The downstream consequence is spending. Consumer expenditure represents approximately 70% of US GDP; when households report this degree of pessimism, discretionary spending intentions typically contract, feeding into revenue risk for consumer-facing sectors.
Goldman Sachs projects US GDP growth of approximately 2.8% in 2026, a sturdy headline figure, but explicitly flags consumer sentiment lows as a risk to that forecast, acknowledging the tension between macroeconomic aggregates and household-level experience.
Morgan Stanley has framed resilient corporate earnings as the primary equity driver while noting a tempered broader economic outlook. Neither institution is dismissing the sentiment data. Both are treating it as a recognised risk embedded in an otherwise constructive macro picture.
Consumer sentiment is not the only stress signal operating independently of equity market strength. Two additional data streams point in the same direction.
The NFIB Small Business Optimism Index printed 95.8 in March 2026, below its long-run historical average. This reflects subdued confidence among small businesses amid ongoing pressures from inflation and labour costs. The reading does not indicate catastrophic collapse, but it confirms that the equity market’s bullish outlook is not shared by the small business community, which employs roughly half of the US private workforce.
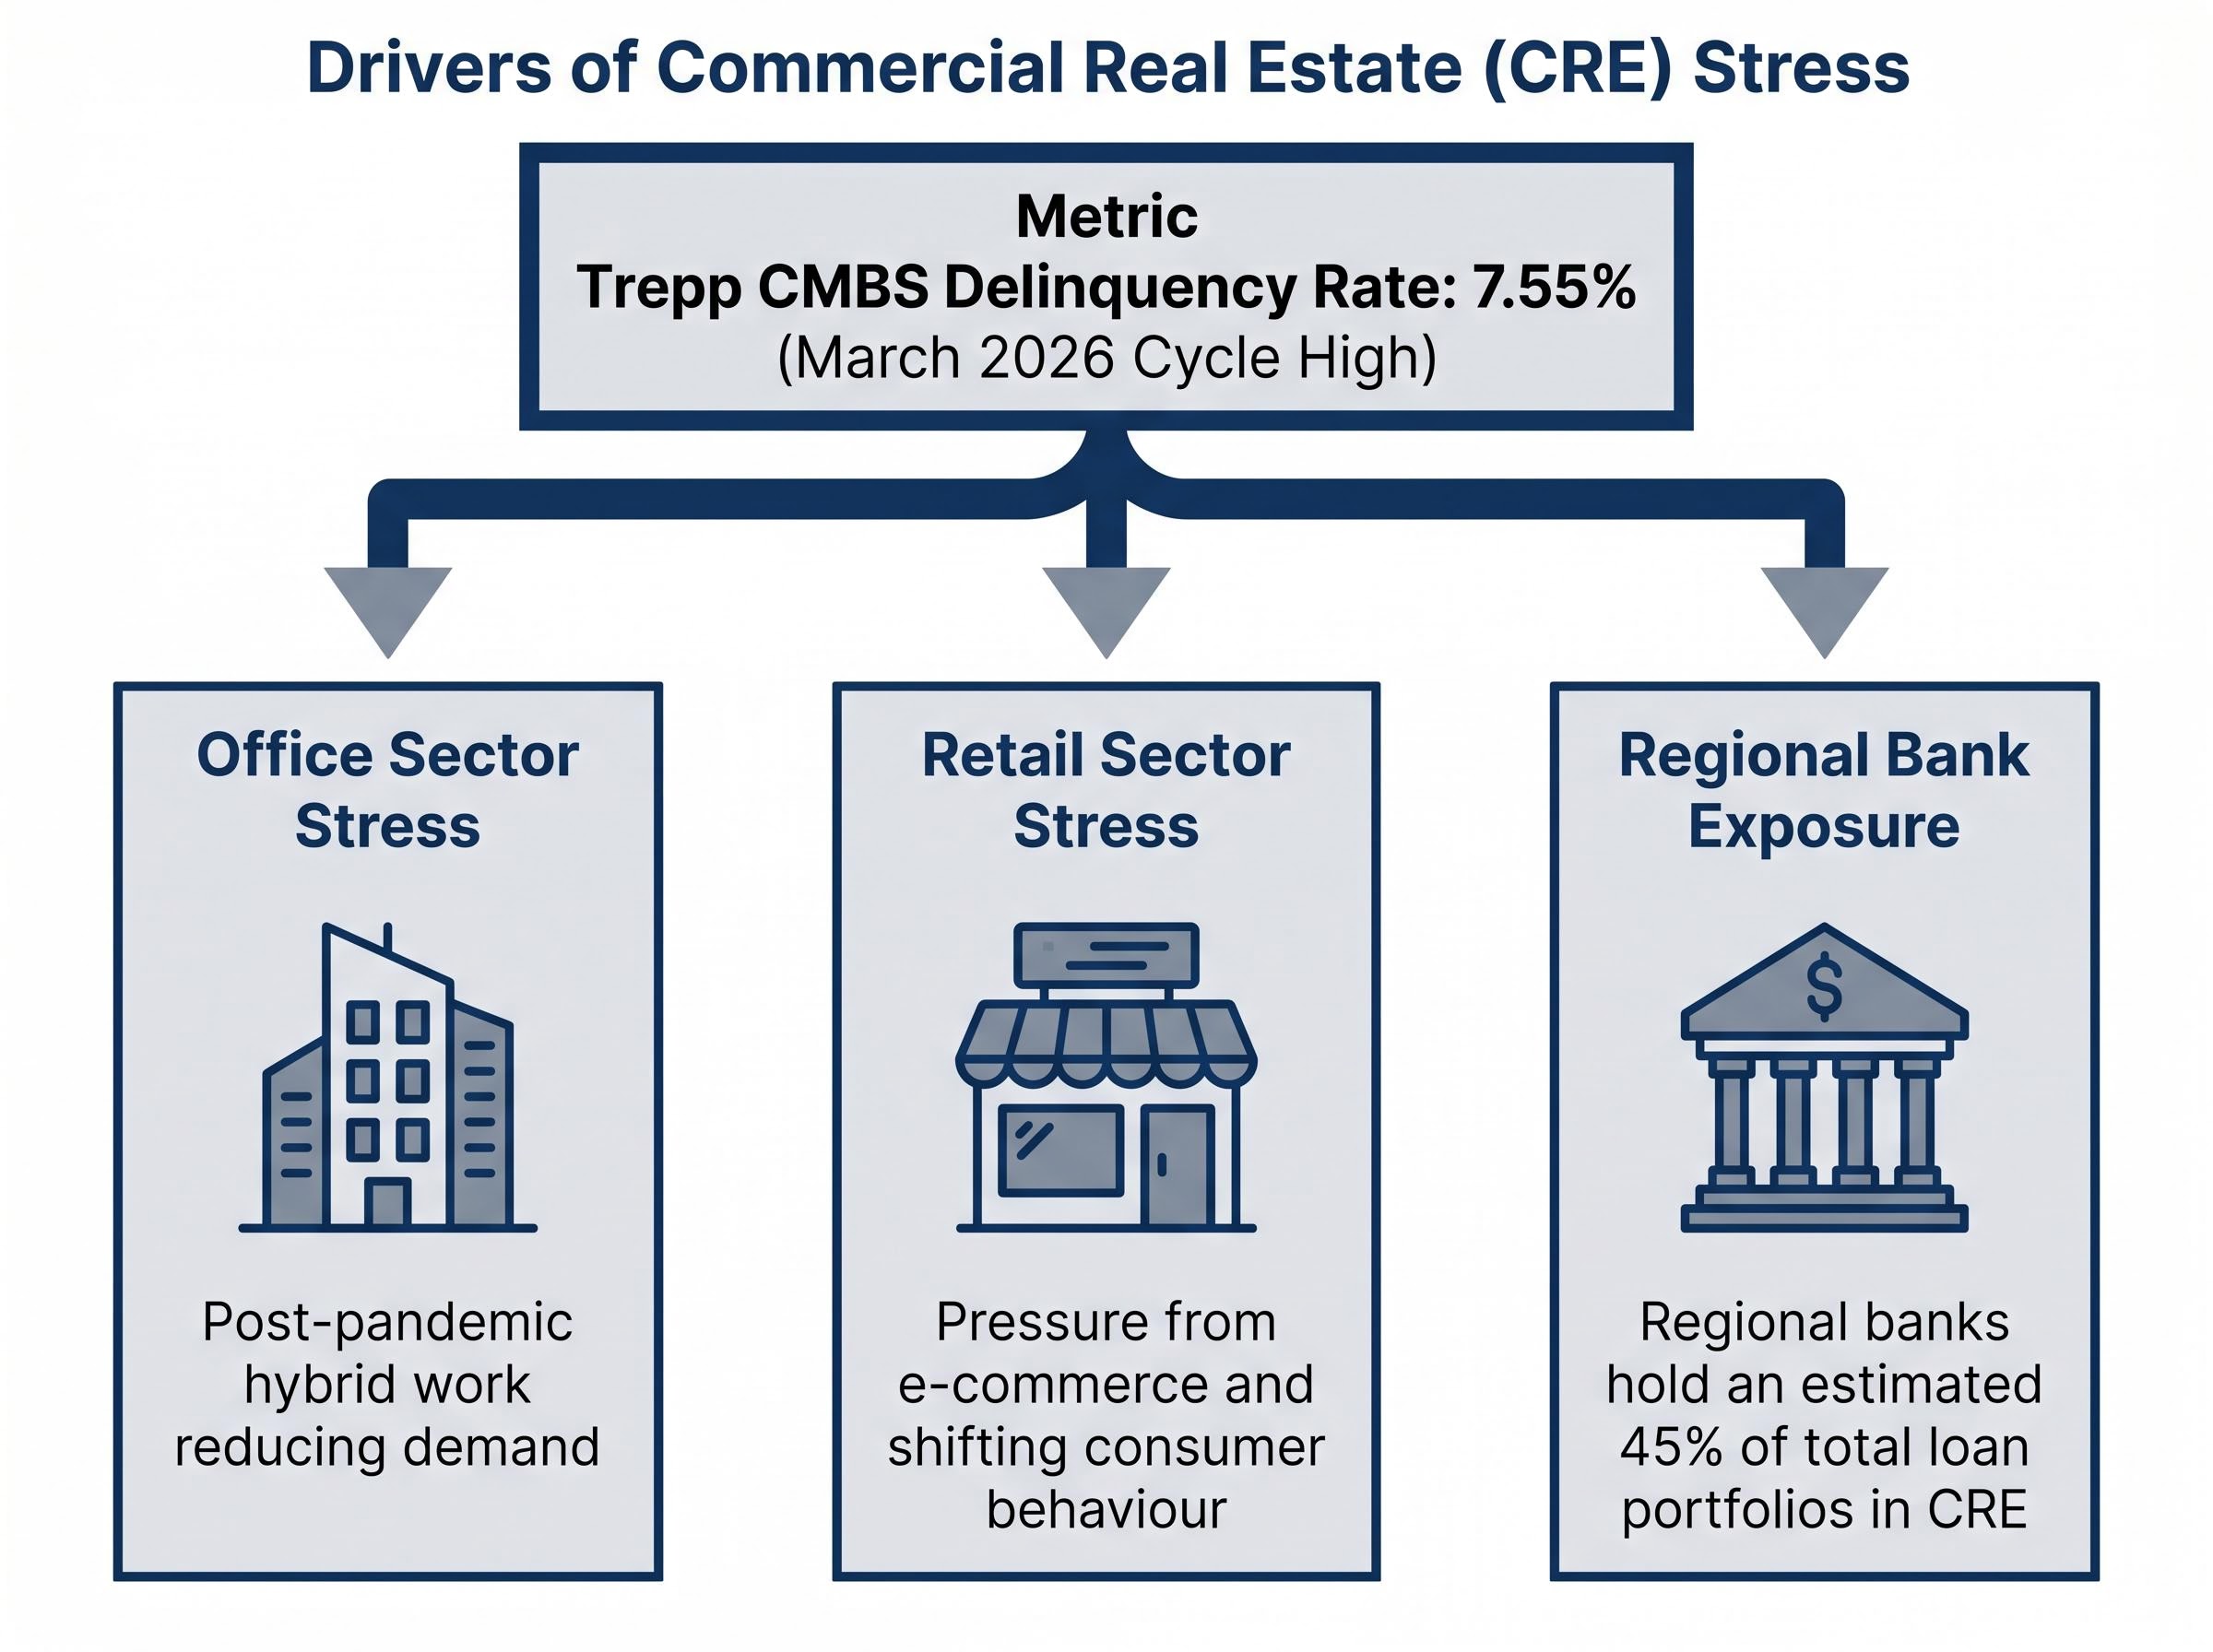
CRE stress adds a credit market dimension. Trepp reported a CMBS delinquency rate of 7.55% in March 2026, a cycle high driven by three overlapping pressures:
Regional bank CRE concentration risk is amplified by a regulatory tripwire that most equity investors do not routinely track: any bank where commercial real estate loans exceed 300% of total equity capital faces heightened supervisory scrutiny, a threshold that a material number of community and regional lenders are already approaching.
| Indicator | Reading | Date | Signal |
|---|---|---|---|
| S&P 500 / Nasdaq | Record closing highs | 24 April 2026 | Bullish |
| JPMorgan S&P 500 year-end target | 7,600 | 21 April 2026 | Bullish |
| Q1 2026 blended earnings growth | 13-15% YoY | 24 April 2026 | Bullish |
| Conference Board Consumer Confidence | 91.8 | March 2026 | Bearish |
| Univ. of Michigan Consumer Sentiment | 49.8 | April 2026 | Bearish |
| NFIB Small Business Optimism | 95.8 | March 2026 | Subdued |
| Trepp CMBS delinquency rate | 7.55% (cycle high) | March 2026 | Bearish |
When consumer sentiment, small business confidence, and credit market stress all deteriorate simultaneously, and independently of equity market performance, the risk of eventual convergence increases materially. These are not three expressions of the same concern; they are three separate indicators, measured by different organisations, capturing different dimensions of economic health, and arriving at the same broad conclusion.
The honest analytical position is that both sides of this divergence are real. Q1 2026 earnings growth of 13-15% is not manufactured, and JPMorgan’s target of 7,600 reflects a genuine reading of AI-driven profit potential. At the same time, a University of Michigan reading of 49.8, a CMBS delinquency rate at a cycle high, and small business optimism below its long-run average are not survey quirks. They are independent measurements of economic stress that have historically carried forward-looking significance.
The 1999 Federal Reserve study established that sentiment declines have often preceded market corrections, but the lead time is variable. The 2022 academic research documented how monetary policy can extend the divergence by reducing investor fear during low-sentiment phases. Together, these findings suggest the gap can persist for longer than expected, but they do not suggest it can persist indefinitely.
The case is not for exiting equities. It is for scenario-weighted thinking that gives both data sets appropriate analytical weight.
Federal Reserve stagflation constraints in this cycle add a layer the forward-pricing argument does not fully account for: March 2026 CPI at 3.3% has shifted market expectations from rate cuts to rate holds through year-end, meaning the monetary policy accommodation that the 2022 academic research identified as a divergence-sustaining mechanism is no longer reliably available.
These are not sell signals. They are calibration inputs that would update the probability weighting between the bullish and bearish scenarios as new data arrives.
Record equity highs and deteriorating grassroots economic indicators are not mutually exclusive, but they do represent a tension that history suggests does not persist indefinitely. The current divergence is real, recognised by institutions including Goldman Sachs, Morgan Stanley, and the Brookings Institution, and historically associated with elevated correction risk if sentiment weakness persists or deepens.
The value of tracking both the top-down market narrative and the bottom-up economic signals is practical: it prepares investors to update their positions based on evidence rather than reacting to whichever data point captures the most attention on a given day. Earnings growth is real. Consumer and credit stress is also real. The resolution will come from the data, and investors who monitor both sides will be better positioned when it does.
International equity diversification when US valuations are stretched offers a portfolio response that sector diversification cannot replicate: geographic allocation hedges risks specific to US fiscal policy, Federal Reserve rate sensitivity, and dollar trajectory, which are precisely the variables the current divergence signals are most directly implicating.
This article is for informational purposes only and should not be considered financial advice. Investors should conduct their own research and consult with financial professionals before making investment decisions. Past performance does not guarantee future results. Financial projections are subject to market conditions and various risk factors.
The stock market vs economy divergence occurs when equity indices hit record highs while real-economy indicators like consumer sentiment and small business confidence deteriorate simultaneously. It happens because equity markets are forward-looking instruments that price expected future earnings, not current conditions, and because index concentration in a handful of mega-cap stocks can lift headline numbers even when the broader economy is under stress.
A University of Michigan Consumer Sentiment reading below 50 has historically clustered tightly around recession periods, including 1980, 1990-1991, 2008-2009, and 2022, making the April 2026 print of 49.8 a historically grounded warning signal. The fact that it coincides with record equity highs makes the divergence unusually wide by modern standards.
The article recommends scenario-weighted thinking rather than exiting equities, monitoring three specific indicators: earnings breadth beyond technology, monthly consumer spending releases, and Trepp CMBS delinquency trends. It also highlights international equity diversification as a portfolio response that can hedge US-specific risks such as Federal Reserve rate sensitivity and dollar trajectory.
Trepp reported a CMBS delinquency rate of 7.55% in March 2026, a cycle high driven by office sector weakness, retail pressure, and the fact that regional banks hold an estimated 45% of their loan portfolios in CRE. If delinquencies continue rising and begin affecting regional bank lending conditions, this could add a credit tightening dimension that equity markets have not yet priced.
Investors should track whether Q2-Q3 2026 earnings growth broadens beyond mega-cap technology, whether retail sales and personal consumption data begin reflecting the pessimism already captured in sentiment surveys, and whether the Trepp CMBS delinquency rate stabilises or continues deteriorating. Movement in any of these would update the probability balance between the bullish and bearish scenarios.


