
What Domino’s Q1 Results Reveal About the Consumer Spending Slowdown
15 hrs ago

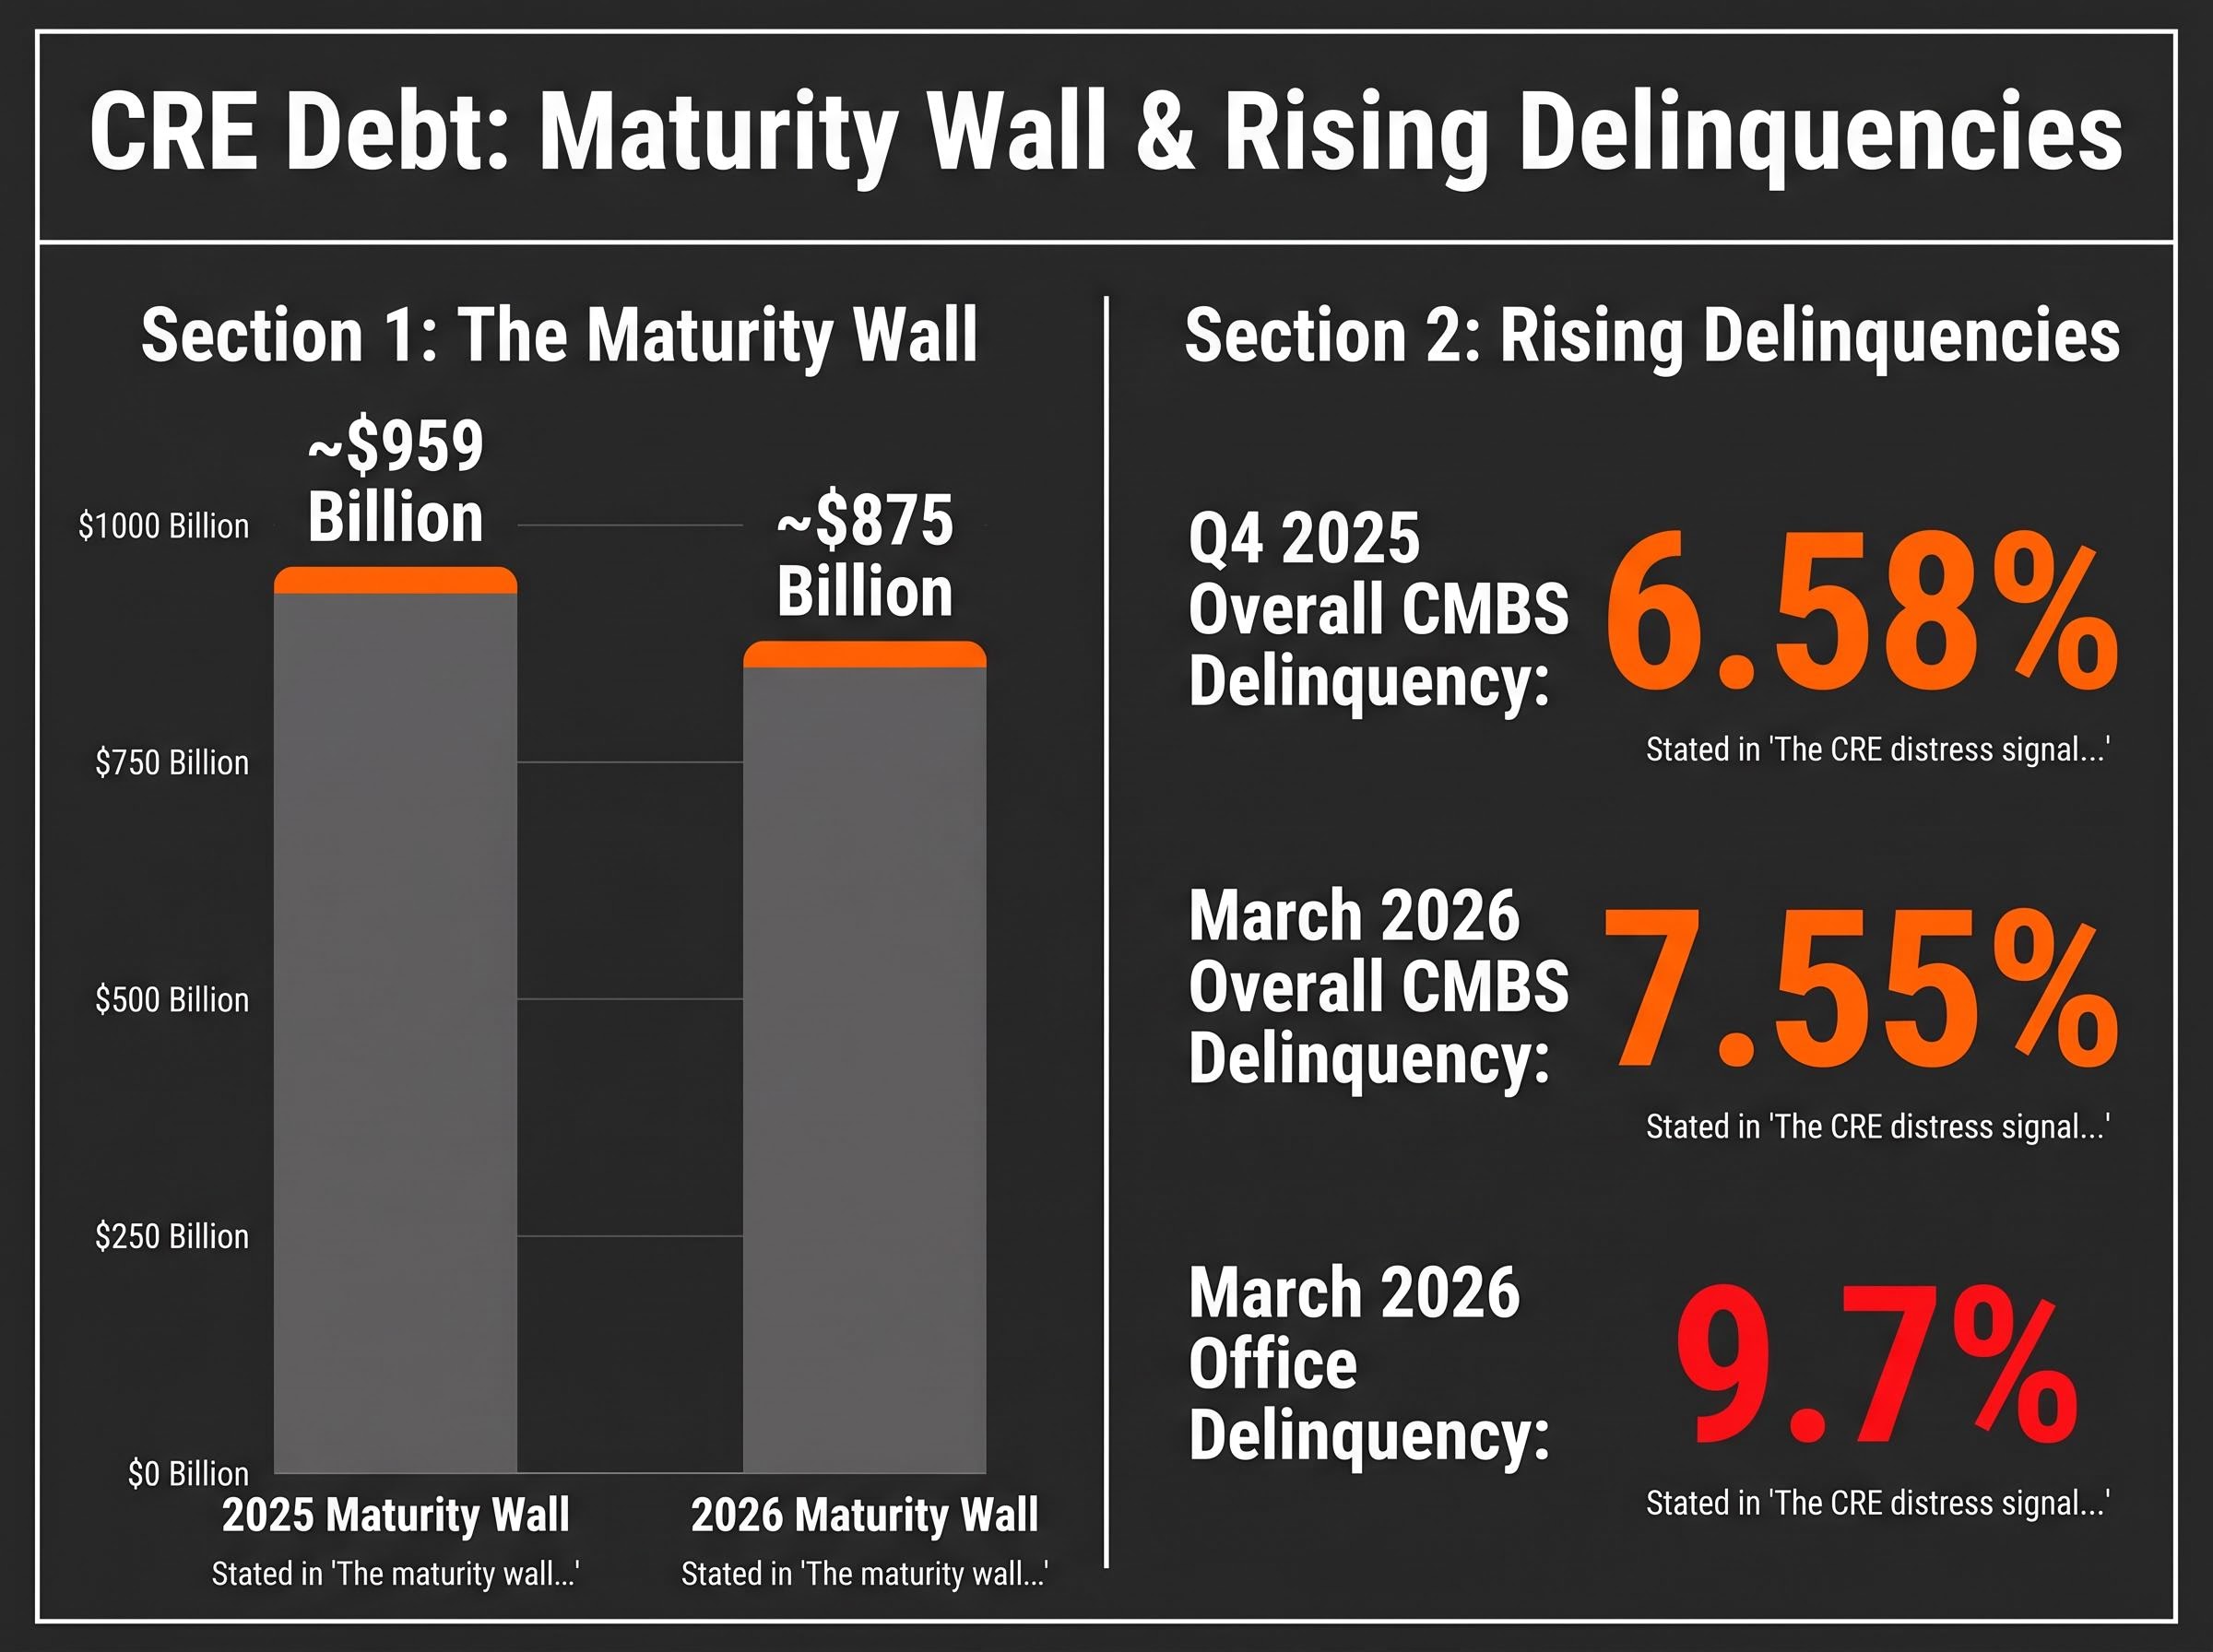
The overall CMBS delinquency rate reached 7.55% in March 2026, with office loans pushing above 9.7%. These are not abstract market statistics. They are the early tremors of a credit stress cycle running directly into the loan books of America’s regional banks.
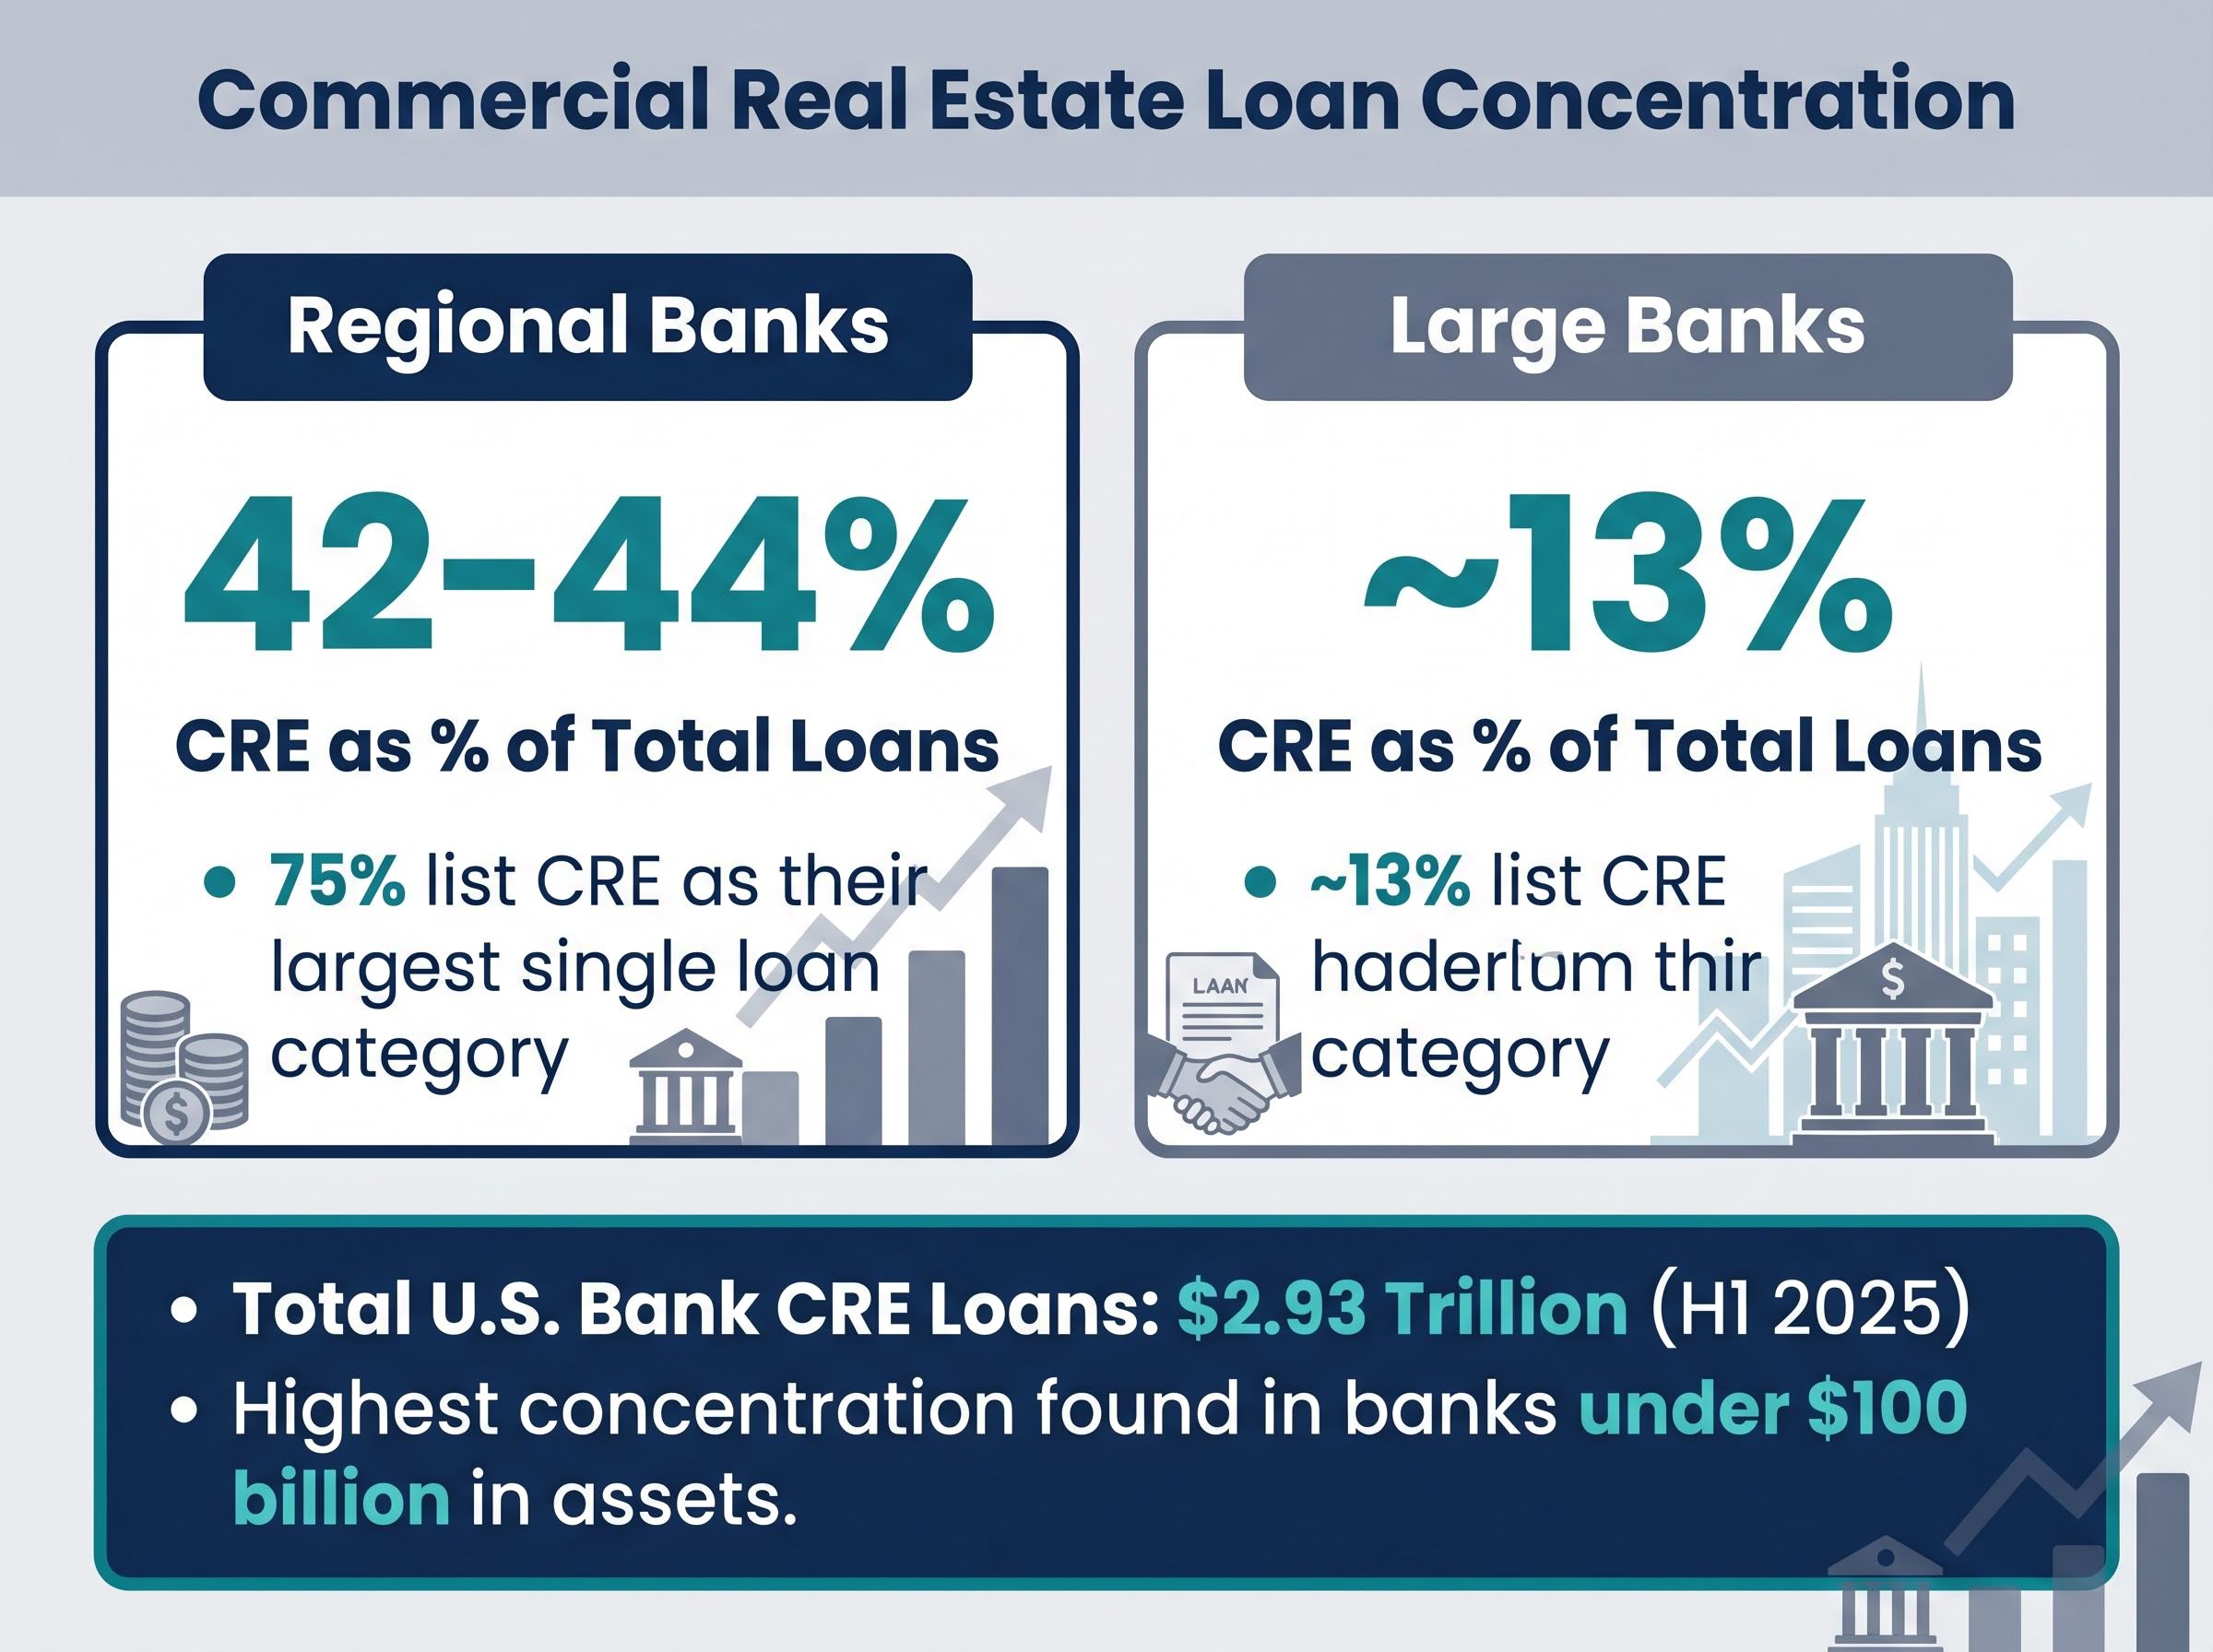
Regional banks carry 42-44% of their total loan portfolios in commercial real estate (CRE), compared with roughly 13% at the largest institutions. Three-quarters of regional banks list CRE as their single largest loan category. With approximately $875 billion in CRE debt set to mature in 2026, the pressure is not easing.
What follows breaks down how CRE debt stress transmits through the banking system, why regional banks are structurally more exposed than money-centre banks, what the regulatory thresholds and early-warning signals look like, and what investors evaluating financial sector exposure should be monitoring right now.
The stress is not projected. It is already showing up in the data.
Office CMBS delinquency rate: 9.7% as of March 2026 (Trepp), up from approximately 9.2% the prior month and climbing. Office loans remain the most distressed segment in the commercial mortgage-backed securities market.
Three figures frame the scale of what is unfolding:
The delinquency trajectory matters because it is accelerating into a year where hundreds of billions of dollars in CRE debt must be addressed. Total U.S. bank CRE loans stood at $2.93 trillion as of H1 2025, according to Risk.net, a record level. The 2025 maturity wall, which totalled approximately $959 billion, was resolved largely through loan extensions rather than refinancings or defaults. That bought time. It did not eliminate the underlying credit pressure.
The question is not whether CRE stress exists. It is how that stress moves through the banking system, and which institutions absorb the most damage.
Investors wanting the full picture on how securitised CRE stress is tracking against equity market complacency will find our full explainer on office CMBS delinquency and the 2026 maturity wall, which covers the January 2026 record delinquency rate of 12.34%, the Q1 2026 payoff rate collapse to 60%, and S&P Global projections placing peak CRE maturities at $1.26 trillion in 2027.
The concentration gap between regional banks and large banks is not a coincidence. It reflects how these institutions are built.
Money-centre banks, the largest U.S. financial institutions, operate diversified business models spanning investment banking, trading, wealth management, and global lending across multiple asset classes and geographies. CRE lending is one line among many. At regional banks, the business model is fundamentally different. Their lending mandates centre on local and regional economies, where commercial property is often the dominant collateral class. Revenue diversification is limited, and CRE loans represent the core of the portfolio.
Federal Reserve data makes the structural gap visible.
| Institution Type | CRE as % of Total Loans | Notes |
|---|---|---|
| Regional banks | 42-44% | 75% of regional banks list CRE as their largest single loan category |
| Large banks | ~13% | CRE lending diversified across broader asset mix and geographies |
The FDIC’s 2025 Risk Review confirms the pattern: the highest CRE concentration exposure is found in banks with assets below $100 billion, precisely the regional and community bank segment.
The primary regulatory benchmark for CRE concentration is the CRE-to-equity ratio, a measure of how much commercial real estate lending a bank carries relative to its capital base. Under interagency guidance originally issued in 2006 by the Federal Financial Institutions Examination Council (FFIEC) and reaffirmed in subsequent supervisory cycles, a ratio above 300% signals excessive concentration.
The interagency guidance on commercial real estate concentration risk, issued jointly by the FDIC, Federal Reserve, and OCC, established the 300% CRE-to-equity threshold as the primary supervisory benchmark and requires banks above that level to demonstrate robust stress-testing and capital planning disciplines.
Exceeding that threshold does not trigger automatic regulatory action. It does trigger heightened supervisory scrutiny, including expectations for more rigorous stress testing and capital planning. The FDIC issued an advisory in 2024 reaffirming these stress-testing expectations for concentrated banks, particularly those with significant office loan portfolios.
The 300% line is not a ceiling. It is a tripwire. Banks above it face closer examination of whether their capital can absorb losses if the CRE cycle turns further.
Understanding the risk requires tracing the causal chain from deteriorating commercial property markets to a bank’s capital position. The sequence unfolds in stages:
Two dynamics make this chain harder to read in real time than it appears.
Official delinquency figures may understate true stress by a factor of approximately four for undercollateralised loans, according to structural analysis of bank portfolios.
That underreporting means the visible delinquency numbers, already elevated, likely represent only a fraction of the actual credit deterioration embedded in bank books.
The second complication is loan extensions. The dominant resolution mechanism throughout 2025 was to extend maturing CRE loans rather than force refinancings at punitive rates or accept defaults. Extensions keep loans technically current, preventing them from appearing in delinquency statistics. They do not eliminate the underlying loss. They defer it. The St. Louis Fed reported a record uptick in unfunded CRE commitments among regional banks in January 2026, indicating pipeline exposure beyond current loan balances that has yet to appear in headline figures.
The loan extension mechanism in CRE banking has a structural parallel in private credit markets, where private credit valuation gaps of 25-35% between reported NAV and secondary market pricing raise analogous questions about whether book values reflect economic reality or simply defer loss recognition until maturity events force price discovery.
Aggregate banking profitability offers some reassurance at the systemic level. FDIC-supervised institutions reported full-year 2025 net income of $295.6 billion, up 10.2% from 2024. Community banks posted a 22.5% increase in net income. But aggregate profitability does not rule out concentrated stress in individual sub-$100 billion institutions with heavy CRE books, any more than a healthy national employment figure rules out a city with 15% unemployment.
The 2025 CRE maturity wall was widely anticipated as a potential breaking point. What actually happened was more nuanced. The approximately $959 billion in maturities produced four observable outcomes:
The resolution was, in effect, a controlled deferral. Banks and borrowers agreed to buy time rather than crystallise losses.
The refinancing arithmetic facing CRE borrowers is not just a function of property-level cash flows; it is shaped by the broader liquidity environment, where Fed balance sheet reduction has withdrawn $2.4 trillion since the peak, with a Fed research paper published in April 2026 signalling a potential further $2.1 trillion in cuts that would compress reserve availability and sustain pressure on credit spreads through the resolution period.
The 2026 maturity wall stands at approximately $875 billion, roughly 9% below the 2025 peak. A lower total, however, does not necessarily translate to lower risk for banks already holding extended loans from the prior year. Those extensions added duration to existing stress without resolving the underlying collateral weakness.
Office and concentrated multifamily markets remain the primary pressure points. Regional banks have begun reviving CRE lending in Q1 2026, particularly in multifamily (up 4.9%), according to CRE Daily. New lending alongside unresolved legacy stress creates layered exposure.
The current dynamic differs from the 2008-2010 cycle in an important respect: the stress is more sector-concentrated rather than system-wide. But that concentration is landing precisely where regional bank balance sheets are most exposed, making the narrower scope of the stress a poor basis for dismissing the risk.
The analysis above has limited value unless it translates into something an investor can do with a specific bank holding. What follows is a practical monitoring framework organised by signal type.
St. Louis Fed analysis of unfunded CRE commitments among regional banks documented a record uptick as of January 2026, reversing a nine-quarter decline and signalling that regional lenders are adding pipeline exposure even as legacy extended loans from the 2025 maturity wave remain unresolved on their books.
Underappreciated signal: The St. Louis Fed reported a record uptick in unfunded CRE commitments among regional banks in January 2026. This indicates regional banks have committed to future CRE lending that will increase their exposure even beyond current levels.
The structural asymmetry at the centre of this risk is not subtle. Regional banks hold 42-44% of their loan portfolios in CRE. Large banks hold approximately 13%. That is not a marginal difference. It is a fundamentally different risk profile that determines how each category of institution responds to a CRE credit cycle.
The 2025 maturity wave did not produce a systemic crisis, and aggregate banking profitability improved through the year. These are relevant data points. They are not, however, proof that the risk has passed. Aggregate figures can mask concentrated stress in individual institutions, particularly those below $100 billion in assets where CRE concentration is highest.
This is not a 2008-style system-wide collapse scenario. It is a credit stress cycle concentrated in a specific segment of the banking system, in specific property types, where specific banks may face material capital pressure. Investors holding regional bank positions would benefit from applying the monitoring framework above directly to those holdings, sourcing CRE concentration, provisioning, and capital data from primary regulatory filings (FDIC call reports, 10-Q disclosures) rather than relying solely on aggregated third-party data.
This article is for informational purposes only and should not be considered financial advice. Investors should conduct their own research and consult with financial professionals before making investment decisions. Past performance does not guarantee future results. Financial projections are subject to market conditions and various risk factors.
Regional bank CRE exposure refers to the proportion of a regional bank's loan portfolio held in commercial real estate loans. It matters because regional banks hold 42-44% of their total loans in CRE, compared to roughly 13% at large banks, making them far more vulnerable when commercial property markets deteriorate.
The 300% CRE-to-equity rule is an interagency regulatory benchmark set by the FDIC, Federal Reserve, and OCC, under which a bank's total CRE lending exceeding 300% of its equity capital triggers heightened supervisory scrutiny, requiring more rigorous stress testing and capital planning from the institution.
Approximately $875 billion in CRE debt is set to mature in 2026, according to CRE Daily. This follows the 2025 maturity wall of roughly $959 billion, much of which was resolved through loan extensions rather than refinancings, meaning legacy stress remains unresolved on bank balance sheets.
Investors should monitor each bank's CRE-to-equity ratio (a figure above 300% signals excessive concentration), CRE-specific loan loss provisions in quarterly 10-Q filings, loan extension rates, office sector exposure within the CRE portfolio, and the CET1 capital ratio, all sourced directly from FDIC call reports and regulatory filings.
The overall CMBS delinquency rate reached 7.55% in March 2026, with office loans at 9.7%, and these figures serve as leading indicators of stress in bank loan portfolios holding similar commercial property collateral. Rising CMBS delinquencies typically precede increased non-performing loans, higher provisioning, and potential capital erosion at banks with concentrated CRE books.


