
Record Highs Are Not the Risk Most Investors Think They Are
6 hrs ago

On 17 April 2026, a single diplomatic announcement sent global oil prices plunging more than 10% in a single trading session. Two days later, prices had recovered almost entirely as the same situation reversed course. That is not stability. That is a market sitting on a hair trigger, and the Strait of Hormuz oil prices relationship is the mechanism driving it.
The Strait has been effectively closed since 28 February 2026, following Iran’s assertion of control in response to a U.S. naval blockade of Iranian ports. As of 27 April 2026, no ceasefire is in place, peace talks have stalled, and the strait remains blocked. For the past few trading days, oil prices have barely moved. That surface calm is exactly what retail investors should not mistake for resolution.
What follows explains what the Strait of Hormuz is and why its closure carries structural weight, how the extreme April price swings reflect a market driven by headlines rather than fundamentals, what U.S. and OPEC+ policy responses can and cannot absorb, and what investors should understand about their portfolio exposure before the next development lands.
The timeline tells the story faster than any summary can.
That sequence matters. In the span of 48 hours, the Strait went from “completely open” to re-closed, with a vessel seizure and confirmed military engagement. Markets priced in peace, then priced it back out. The Islamabad talks that were supposed to produce a framework had already collapsed nearly a week before the April 17 announcement.
Iran has signalled willingness to reopen if the U.S. lifts its naval blockade. As of 27 April, no resolution has been reached.
Iran’s Hormuz reopening proposal, submitted through Pakistani intermediaries on 27 April, introduced a sequencing condition the Trump administration has resisted: the U.S. would lift its naval blockade before nuclear talks begin, a structure that would leave Tehran’s physical capacity to re-close the Strait intact even after any announced opening.
The absence of new headlines this week is not evidence that the crisis is winding down. It is the sound of a stalemate with no active resolution mechanism.
The Strait of Hormuz is the narrow waterway between Iran and Oman connecting the Persian Gulf to the Arabian Sea. At its narrowest navigable point, it spans approximately 21 miles. There is no viable pipeline substitute for most of the volume that passes through it. When the Strait is blocked, the oil does not simply take another route. It stops.
The major oil-exporting nations whose supply routes run through the Strait include:
Every barrel these producers send to global markets by sea transits this single corridor. That concentration of supply through one geographic bottleneck is what makes the closure so consequential.
According to the International Energy Agency’s (IEA) April 2026 Oil Market Report, approximately 13 million barrels per day of global oil supply has been disrupted. Some estimates place the figure as high as 20 million bpd when all affected flows are counted.
For context, total U.S. daily oil consumption is approximately 20 million bpd. The disrupted volume represents a share comparable to what the entire U.S. economy uses in a day. Rerouting tankers around the Cape of Good Hope adds weeks of transit time and substantial cost, making the Strait not just geographically irreplaceable but economically irreplaceable in the short term.
The physical scale of the blockade is visible in tanker tracking data: with over 700 vessels stranded in the Gulf and daily transits through the Strait falling to just 2-3 per day, the gap between normal corridor traffic and current flows represents a near-total shutdown of a waterway designed to handle dozens of transits daily.
This is not a new vulnerability. During the 1980s Iran-Iraq Tanker War, attacks on tankers in this exact corridor produced significant oil price volatility, a reminder that the Strait has been the hinge point of global energy security for decades.
The three dates that define April’s price story are 17 April, 19 April, and 27 April. Read in sequence, they reveal a market reacting to diplomatic signals with the speed and magnitude of a fundamentals-driven shock, except the fundamentals did not change between any of them.
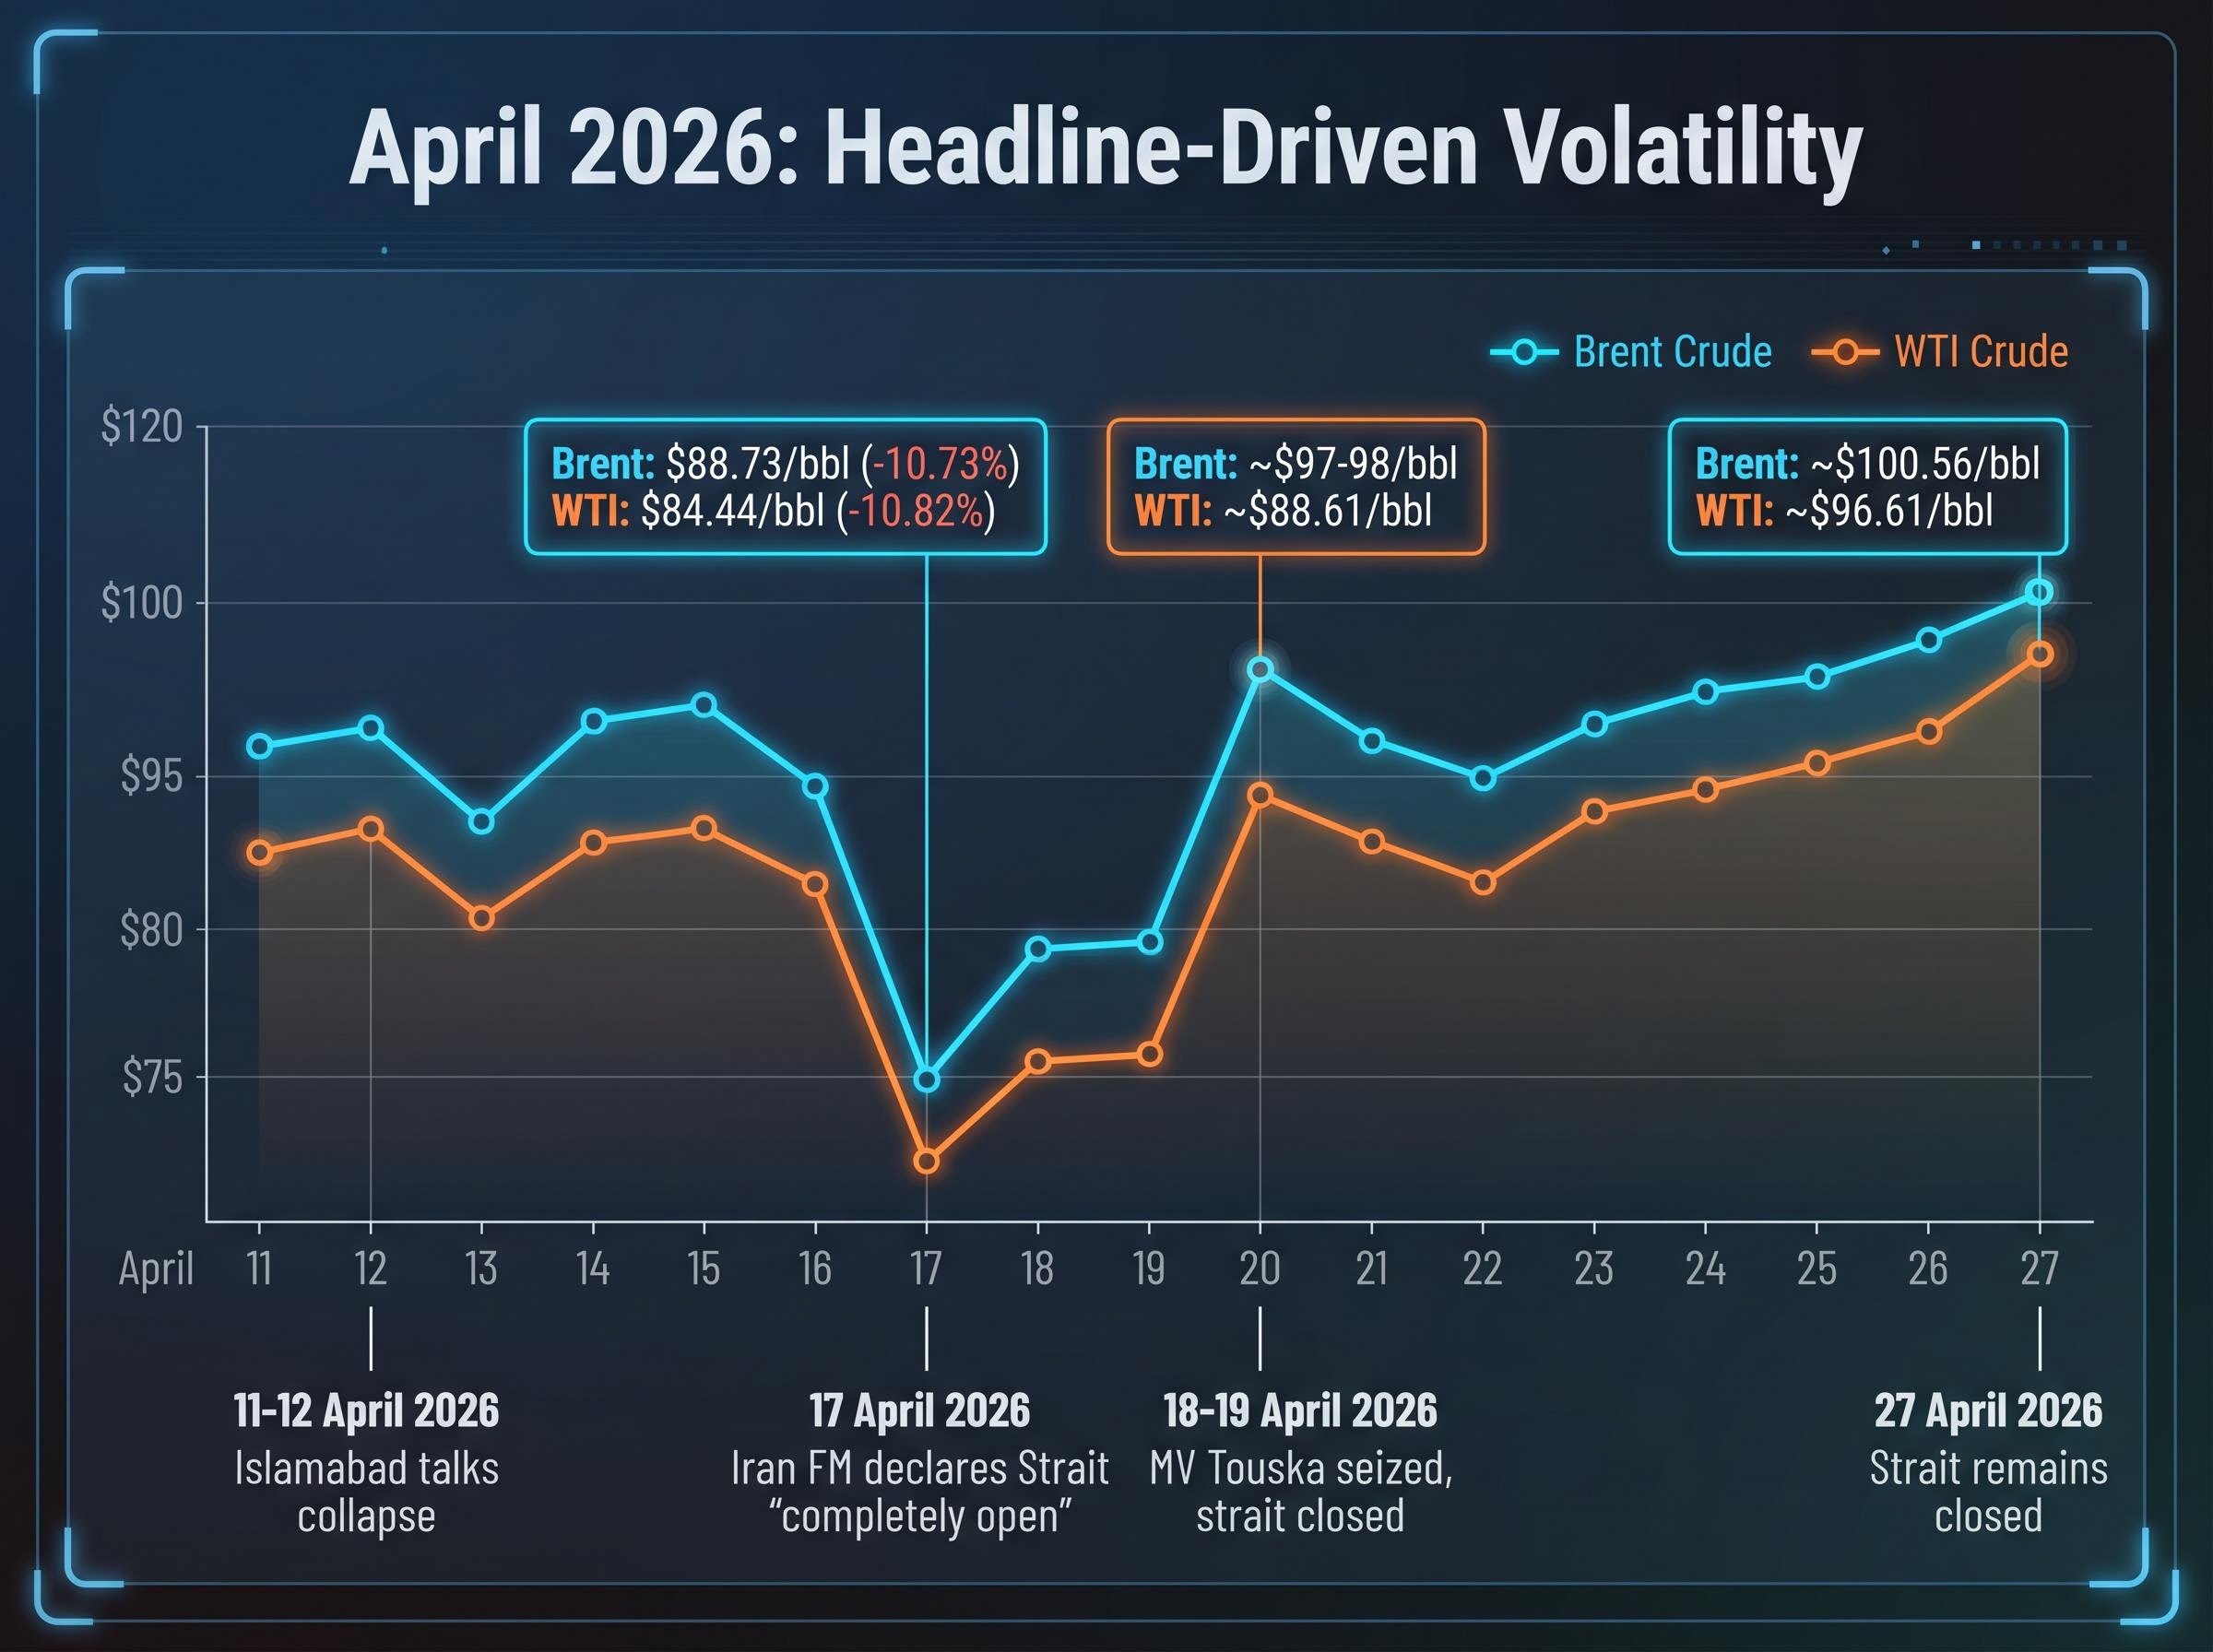
| Metric | 17 April 2026 | 19 April 2026 | 27 April 2026 |
|---|---|---|---|
| Brent Crude | $88.73/bbl (-10.73%) | ~$97-98/bbl | ~$100.56/bbl |
| WTI Crude | $84.44/bbl (-10.82%) | ~$88.61/bbl | ~$96.61/bbl |
| S&P 500 | 7,126.06 (+1.2%) | N/A | N/A |
| Nasdaq | 24,468.48 (+1.52%) | N/A | N/A |
| Dow Jones | 49,447.43 (+1.8%) | N/A | N/A |
On 17 April, Iran’s Foreign Minister declared the Strait “completely open.” Brent fell 10.73% in a single session. WTI dropped 10.82%. U.S. equities surged, with the S&P 500 gaining 1.2%, the Nasdaq 1.52%, and the Dow 1.8%. The entire market, not just the energy sector, repriced on a single diplomatic statement.
By 19 April, the Strait was closed again, the MV Touska had been seized, and oil had recovered nearly all of its losses. By 27 April, Brent had climbed to approximately $100.56/bbl and WTI to approximately $96.61/bbl, the highest levels of the crisis period.
Energy Secretary Chris Wright stated on 19 April that U.S. gasoline prices may not return below $3/gallon until 2027.
The U.S. national average gasoline price in mid-April stood at approximately $4.10-$4.11/gallon, according to AAA data. The equity market’s sharp rally on 17 April confirmed that the Strait crisis is functioning as a macro risk-on, risk-off lever across asset classes, not just an energy sector story. The quiet of late April reflects the absence of new headlines, not an underlying shift in supply conditions.
Two concrete measures have been deployed to address the disruption:
Both responses are genuine. Neither comes close to matching the scale of the problem.
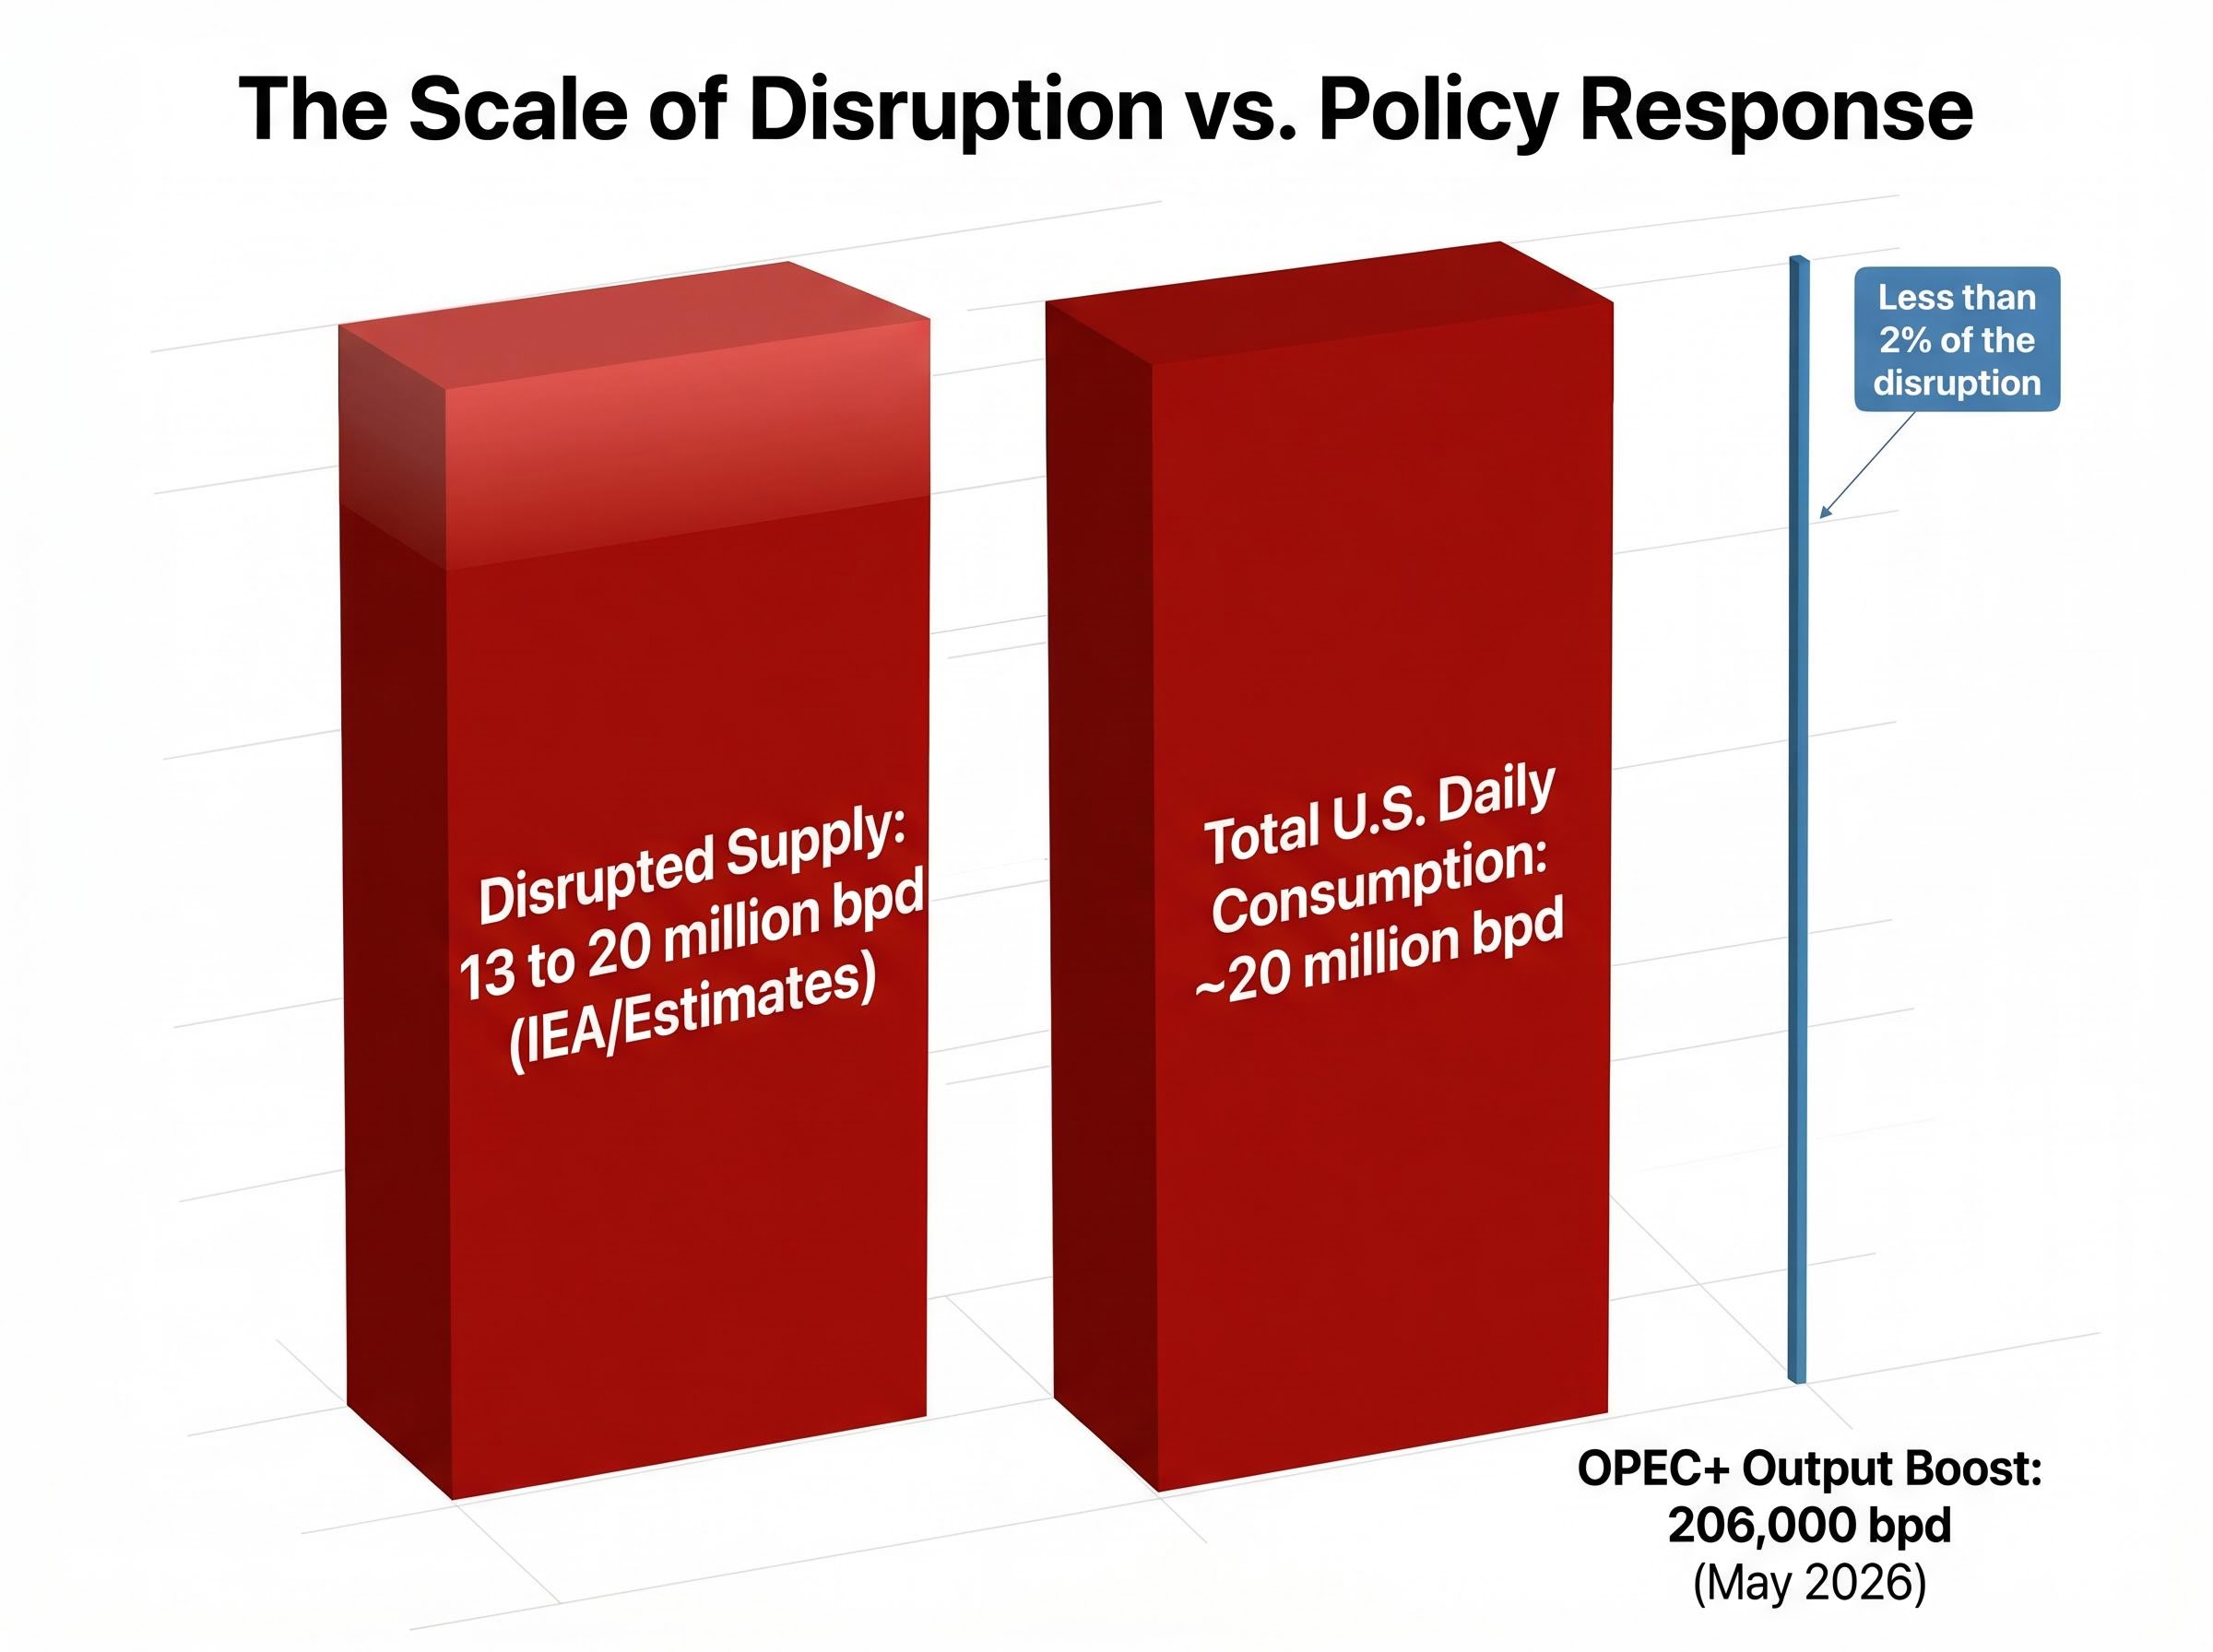
OPEC+’s 206,000 bpd boost represents less than 2% of the estimated 13-20 million bpd disruption. The gap between the policy response and the supply loss is not narrow. It is an order of magnitude.
The SPR release provides a finite buffer. It buys time, but it does not replace the ongoing daily flow loss from a closed Strait. The reserve itself has drawdown limits, and each barrel released is one fewer available for a future disruption.
SPR release limitations in a prolonged disruption are stark: the 50 million barrel tranche announced in response to the blockade represents approximately 12 hours of global supply, providing short-term price relief rather than a structural offset, which is why analysts tracking Polymarket resolution odds placed the probability of a U.S.-Iran meeting before April 30 at only 26%.
History offers a reference point for what happens when policy responses prove insufficient. The 1973 Arab oil embargo caused oil prices to rise nearly 300%, from approximately $3/bbl to $12/bbl, in an environment where governments similarly attempted to manage the crisis through reserves and diplomatic channels. The current disruption is larger in volume terms than any previous Strait-related event.
Past performance does not guarantee future results. Financial projections are subject to market conditions and various risk factors.
The outcome distribution from here is genuinely wide. Three broad scenario categories define the range:
Both the resolution and the escalation scenarios remain plausible. Neither is a tail risk. The current stalemate, with active military posturing, no ceasefire, and no negotiations, sits in the middle of that distribution.
The 1973 oil embargo demonstrated that sustained chokepoint disruption produces rapid, compound price shocks with broad macroeconomic consequences. The 1980s Tanker War showed that even partial or temporary disruptions in the Persian Gulf produce market reactions outsized relative to actual volume loss.
In both episodes, oil markets priced on expectation of future supply, not just current supply. That mechanism is visible again in April 2026: prices have risen to their crisis highs despite no change in the physical blockade status, because markets are pricing in the risk that the stalemate could worsen.
These statements are speculative and subject to change based on market developments and geopolitical conditions.
The Strait of Hormuz crisis touches more of a typical U.S. retail portfolio than the “energy sector” label suggests. The specific asset classes and sectors carrying direct or indirect exposure include:
Rather than reacting to each headline, investors can track a short list of indicators that provide earlier, more reliable signals:
These are monitoring signals, not trading recommendations. The value is in knowing what to watch so that the next headline lands with context rather than surprise.
For investors who want a structured framework for managing their broader portfolio through this period, our comprehensive guide to investing during market volatility in 2026 covers disciplined rebalancing approaches, the case for energy and safe-haven exposure, and why panic selling during geopolitical headline cycles consistently underperforms holding through the volatility.
This article is for informational purposes only and should not be considered financial advice. Investors should conduct their own research and consult with financial professionals before making investment decisions.
The surface calm of late April 2026 is not resolution. It is stalemate, and stalemate with active military posturing and stalled diplomacy is not a stable resting point for energy markets.
Three things are now clearer than they were before this crisis entered its current phase. The Strait’s closure carries structural weight that SPR releases and OPEC+ output boosts cannot offset at the current disruption scale; the policy responses cover less than 2% of the gap. The 17-27 April price arc shows that markets are being driven by diplomatic signals, meaning the next credible announcement, in either direction, is likely to produce another outsized move. And the exposure runs deeper into a typical U.S. retail portfolio than energy sector holdings alone, touching airlines, consumer discretionary names, and broad index positions.
Understanding the mechanism is what separates reactive portfolio decisions from informed ones. The data points are current. The signals to watch are specific. Investors reviewing their energy sector exposure with those reference points in hand, and tracking the diplomatic and tanker-movement indicators identified above, are better positioned for whatever development comes next.
The Strait of Hormuz is a narrow waterway connecting the Persian Gulf to the Arabian Sea, through which approximately 13-20 million barrels of oil per day flow from major producers including Saudi Arabia, the UAE, Kuwait, and Iraq. When it is blocked, that supply cannot easily be rerouted, which is why a closure sends global oil prices sharply higher.
As of 27 April 2026, the Strait of Hormuz remains closed following Iran's assertion of control on 28 February 2026. No ceasefire has been verified and no active negotiations are underway, meaning the blockade continues to disrupt an estimated 13-20 million barrels per day of global oil supply.
On 17 April 2026, Iran's Foreign Minister declared the Strait 'completely open,' causing Brent crude to fall 10.73% in a single session. Within 48 hours, Iran re-imposed the closure and the MV Touska was seized by U.S. forces, so markets reversed course and oil prices recovered nearly all losses, illustrating how headline-driven rather than fundamentals-driven the market currently is.
The 172 million barrel SPR release announced around 11 March 2026 provides only short-term price relief. The OPEC+ output boost of 206,000 barrels per day represents less than 2% of the estimated 13-20 million bpd disruption, meaning neither policy response comes close to replacing the volume lost from the blocked Strait.
Direct exposure sits in energy stocks and ETFs, but the crisis also weighs on airlines through higher fuel costs, consumer discretionary names through elevated gasoline prices near $4.10-$4.11 per gallon, and broad index funds such as the S&P 500, Nasdaq, and Dow Jones, all of which moved more than 1% on a single Strait-related announcement on 17 April 2026.


