
How Dual-Class Shares Put $24 Billion in Gulf Capital at Arm’s Length
23 hrs ago

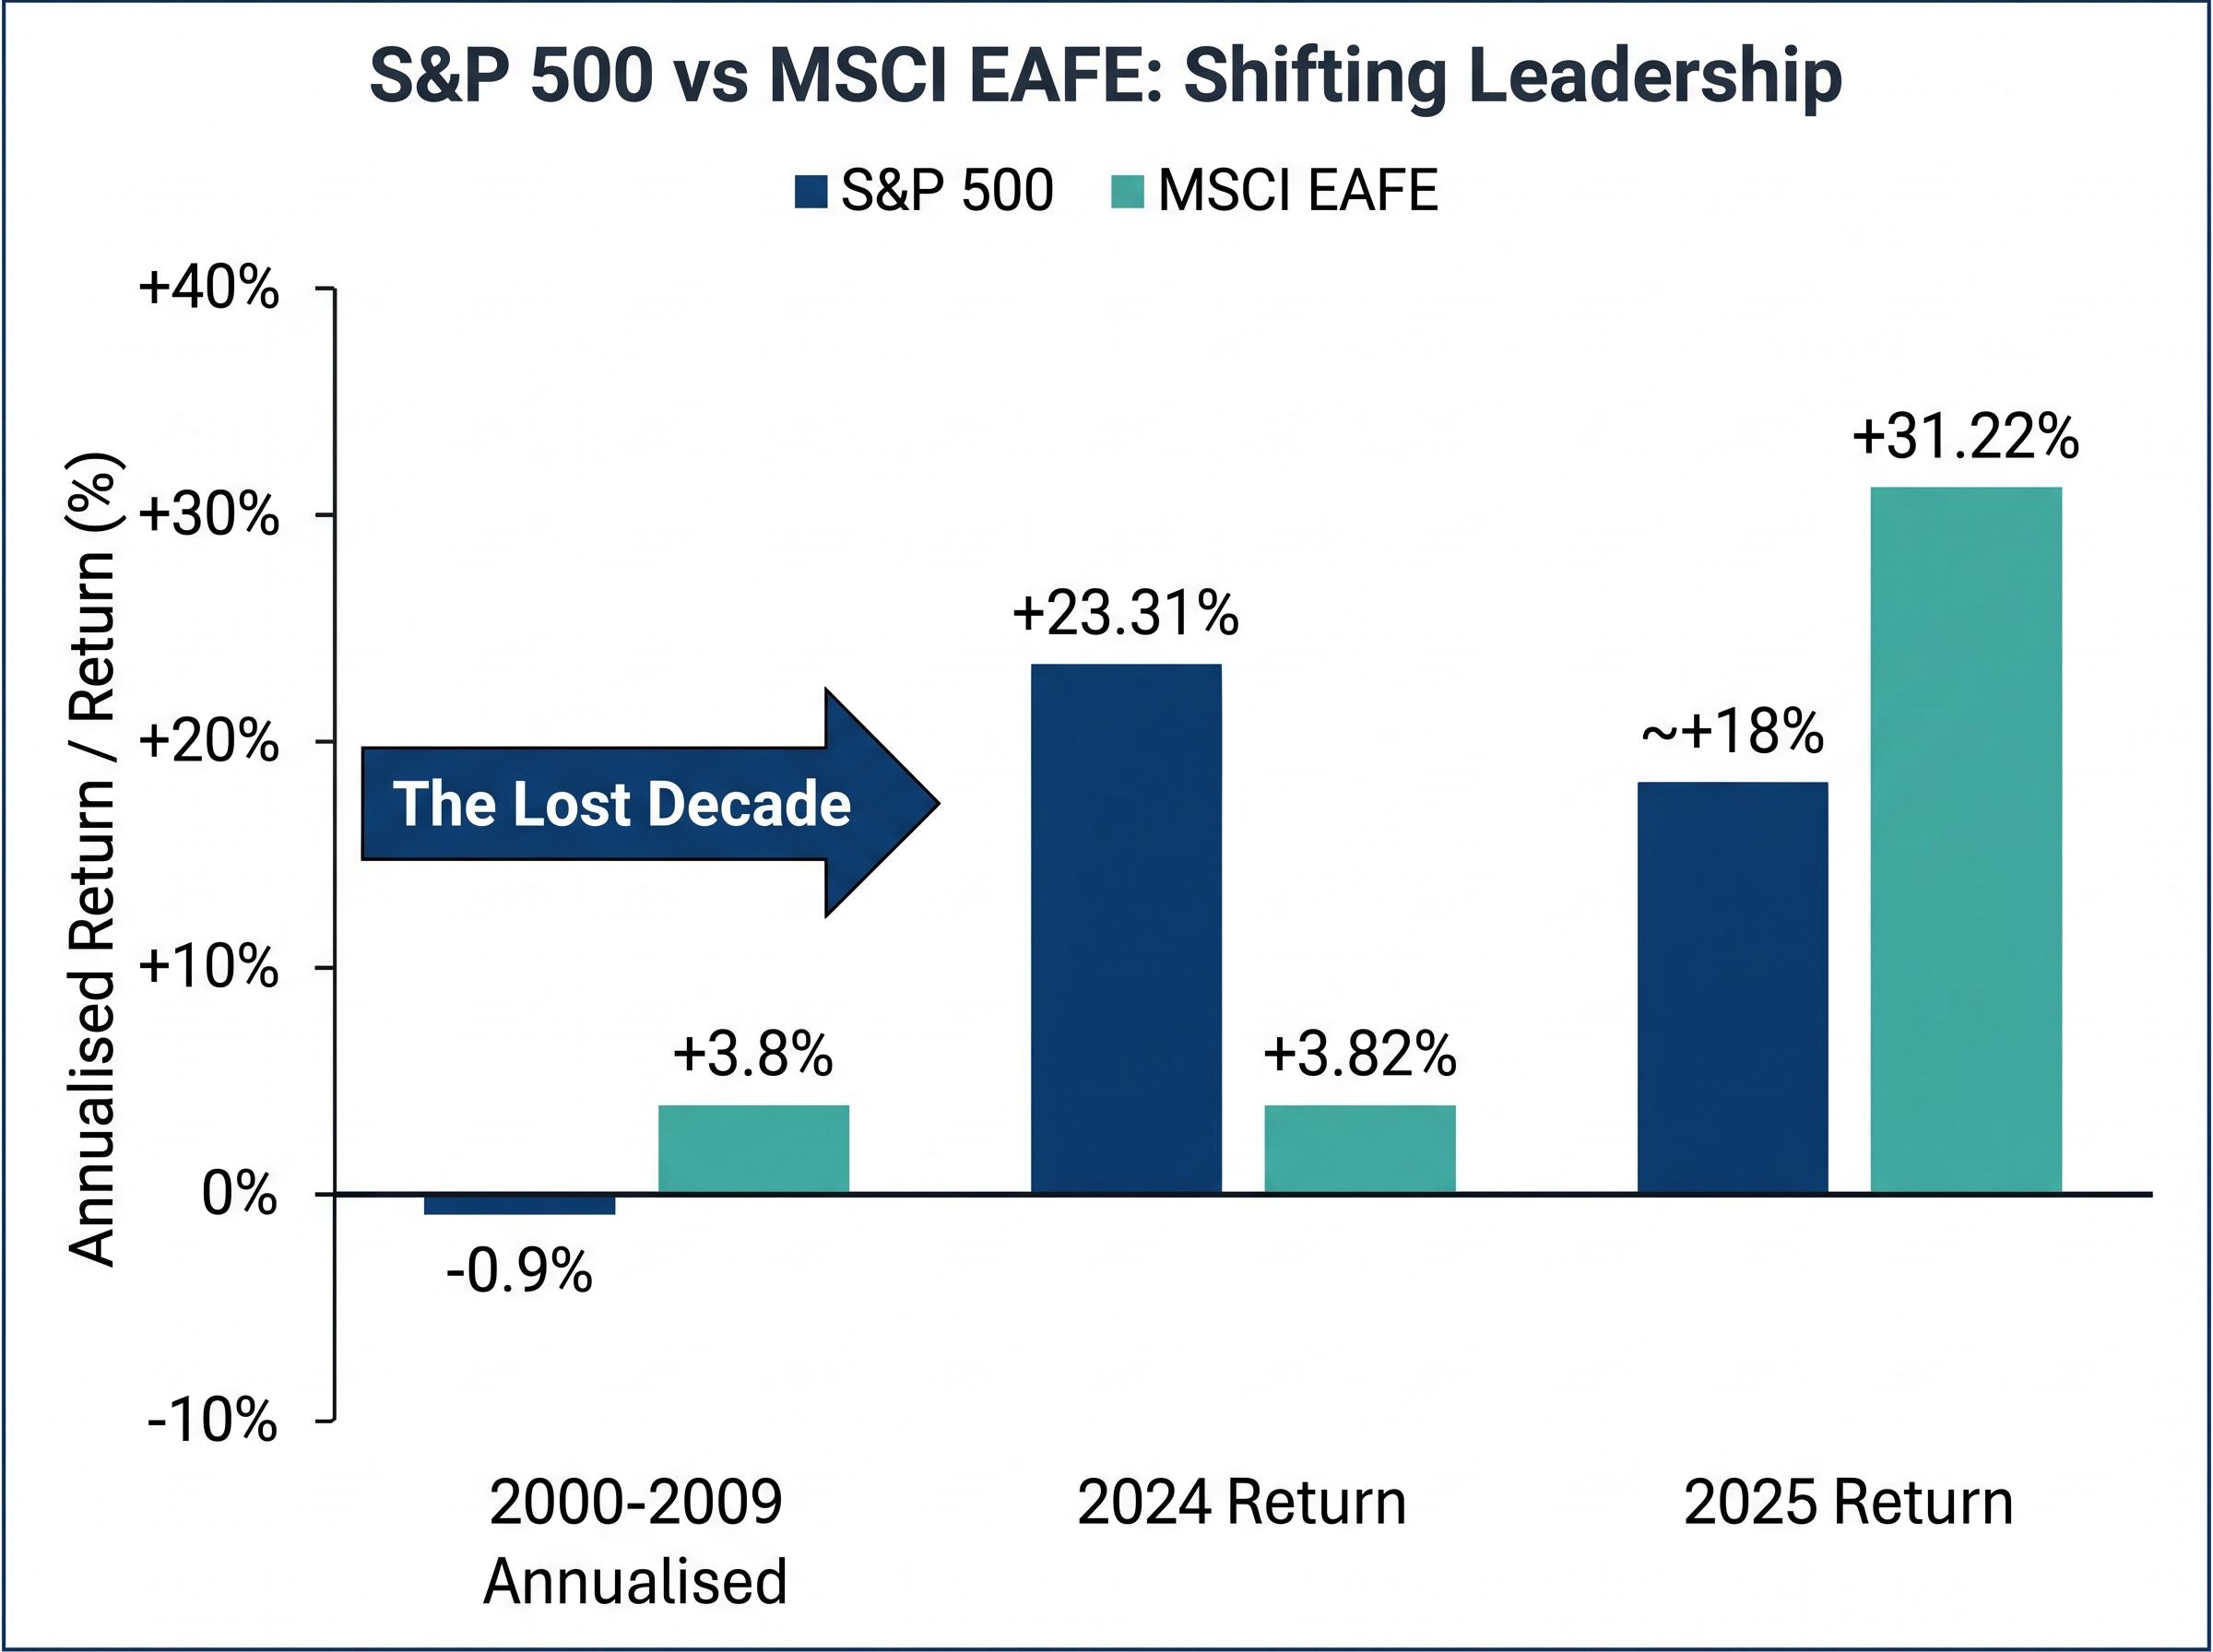
Warren Buffett has spent decades telling investors to “never bet against America,” and for most of that time the numbers have vindicated the advice. The S&P 500 delivered a cumulative total return of 305% over the ten years ending 23 April 2026, a record that few global indices can match. Yet in 2025 alone, the MSCI EAFE index of developed international markets returned +31.22%, comfortably outpacing the S&P 500’s roughly +18%. Both numbers are real. Both describe the same global equity market. The question is which one tells investors more about what comes next.
The debate over US vs international stocks sits at the intersection of long-term structural evidence and present-day valuation reality. For American investors evaluating portfolio construction in 2026, both sides of the argument are supported by verifiable data, making this one of the more consequential allocation decisions in personal finance. What follows explains why the U.S. became the world’s dominant equity market, what structural advantages sustain that position, and what the current data says about whether the next decade will look like the last one, or more like the one before it.
The 305% cumulative total return the S&P 500 posted over the decade ending 23 April 2026 is not an outlier. It is the latest chapter in a longer story. Berkshire Hathaway, under Warren Buffett’s stewardship, compounded at approximately 20% annually over roughly six decades, turning a struggling textile mill into one of the most valuable companies on earth. That kind of sustained capital deployment is not a product of luck or timing. It is the output of an economic system designed, intentionally or not, to reward long-duration investment.
In his 2021 shareholder letter, Buffett wrote that investors should “never bet against America,” framing U.S. equity returns as the natural consequence of the country’s institutional and entrepreneurial architecture.
The structural conditions behind those returns fall into four categories, each reinforcing the others:
Understanding these pillars matters more than memorising the return figures. Without them, the numbers are just numbers. With them, short-term performance swings become easier to contextualise.
The pillars are not independent. Each one depends on the others to function, and removing any one of them would weaken the rest. That interlocking quality is what distinguishes the U.S. system from economies that share some but not all of these attributes.
Entrepreneurial culture and property rights are the prerequisites. They are the conditions that must exist before the other advantages can compound. Without enforceable contracts, venture capital cannot function. Without a culture that tolerates and even celebrates commercial risk, the pipeline of new companies thins. The U.S. economy holds the top position worldwide by size in part because these two conditions have been in place, relatively consistently, for over a century.
Deep capital markets and multi-sector dominance are the outputs of those foundational conditions. They are what convert structural advantage into investable returns. A strong legal system attracts capital. A large pool of capital funds a wider range of industries. A wider range of industries reduces concentration risk at the national level. The result is a self-reinforcing loop that has, over decades, widened the gap between U.S. equity returns and those of most other developed economies.
The ten-year return headline is compelling. It is also incomplete. The performance record of U.S. versus international equities reads less like a single verdict and more like a series of chapters, each with a different winner.
Between 2000 and 2009, the S&P 500 delivered an annualised return of approximately -0.9%. Over the same period, the MSCI EAFE returned approximately +3.8% annualised. For an entire decade, international stocks outperformed the U.S. by a wide margin, driven by the dot-com bust and the 2008-2009 financial crisis. The term “lost decade” exists because of those numbers.
The post-2010 period rebuilt the U.S. dominance narrative. Technology sector leadership and a prolonged valuation expansion drove the S&P 500 to sustained outperformance that lasted, with minor interruptions, through 2024. Then the cycle turned again.
| Index | 2000-2009 Annualised | 2024 Return | 2025 Return |
|---|---|---|---|
| S&P 500 | -0.9% | +23.31% | ~+18% |
| MSCI EAFE | +3.8% | +3.82% | +31.22% |
| MSCI Emerging Markets | N/A | +7.50% | +33.57% |
In 2025, the MSCI EAFE returned +31.22%, its strongest annual performance in years and a sharp reversal from the +3.82% it delivered in 2024.
The MSCI EAFE Index factsheet and methodology confirms the index covers 21 developed market countries excluding the U.S. and Canada, a construction detail that matters when evaluating whether the 2025 outperformance reflects broad international strength or is concentrated in a narrow subset of markets.
The contrast between 2024 and 2025 is particularly instructive. In 2024, the S&P 500 outperformed MSCI EAFE by nearly 20 percentage points. One year later, international developed markets led by a comparable margin. The direction can reverse within a single calendar year, and investors who anchor only to the most recent period risk building portfolios on assumptions that the data does not support over longer time horizons.
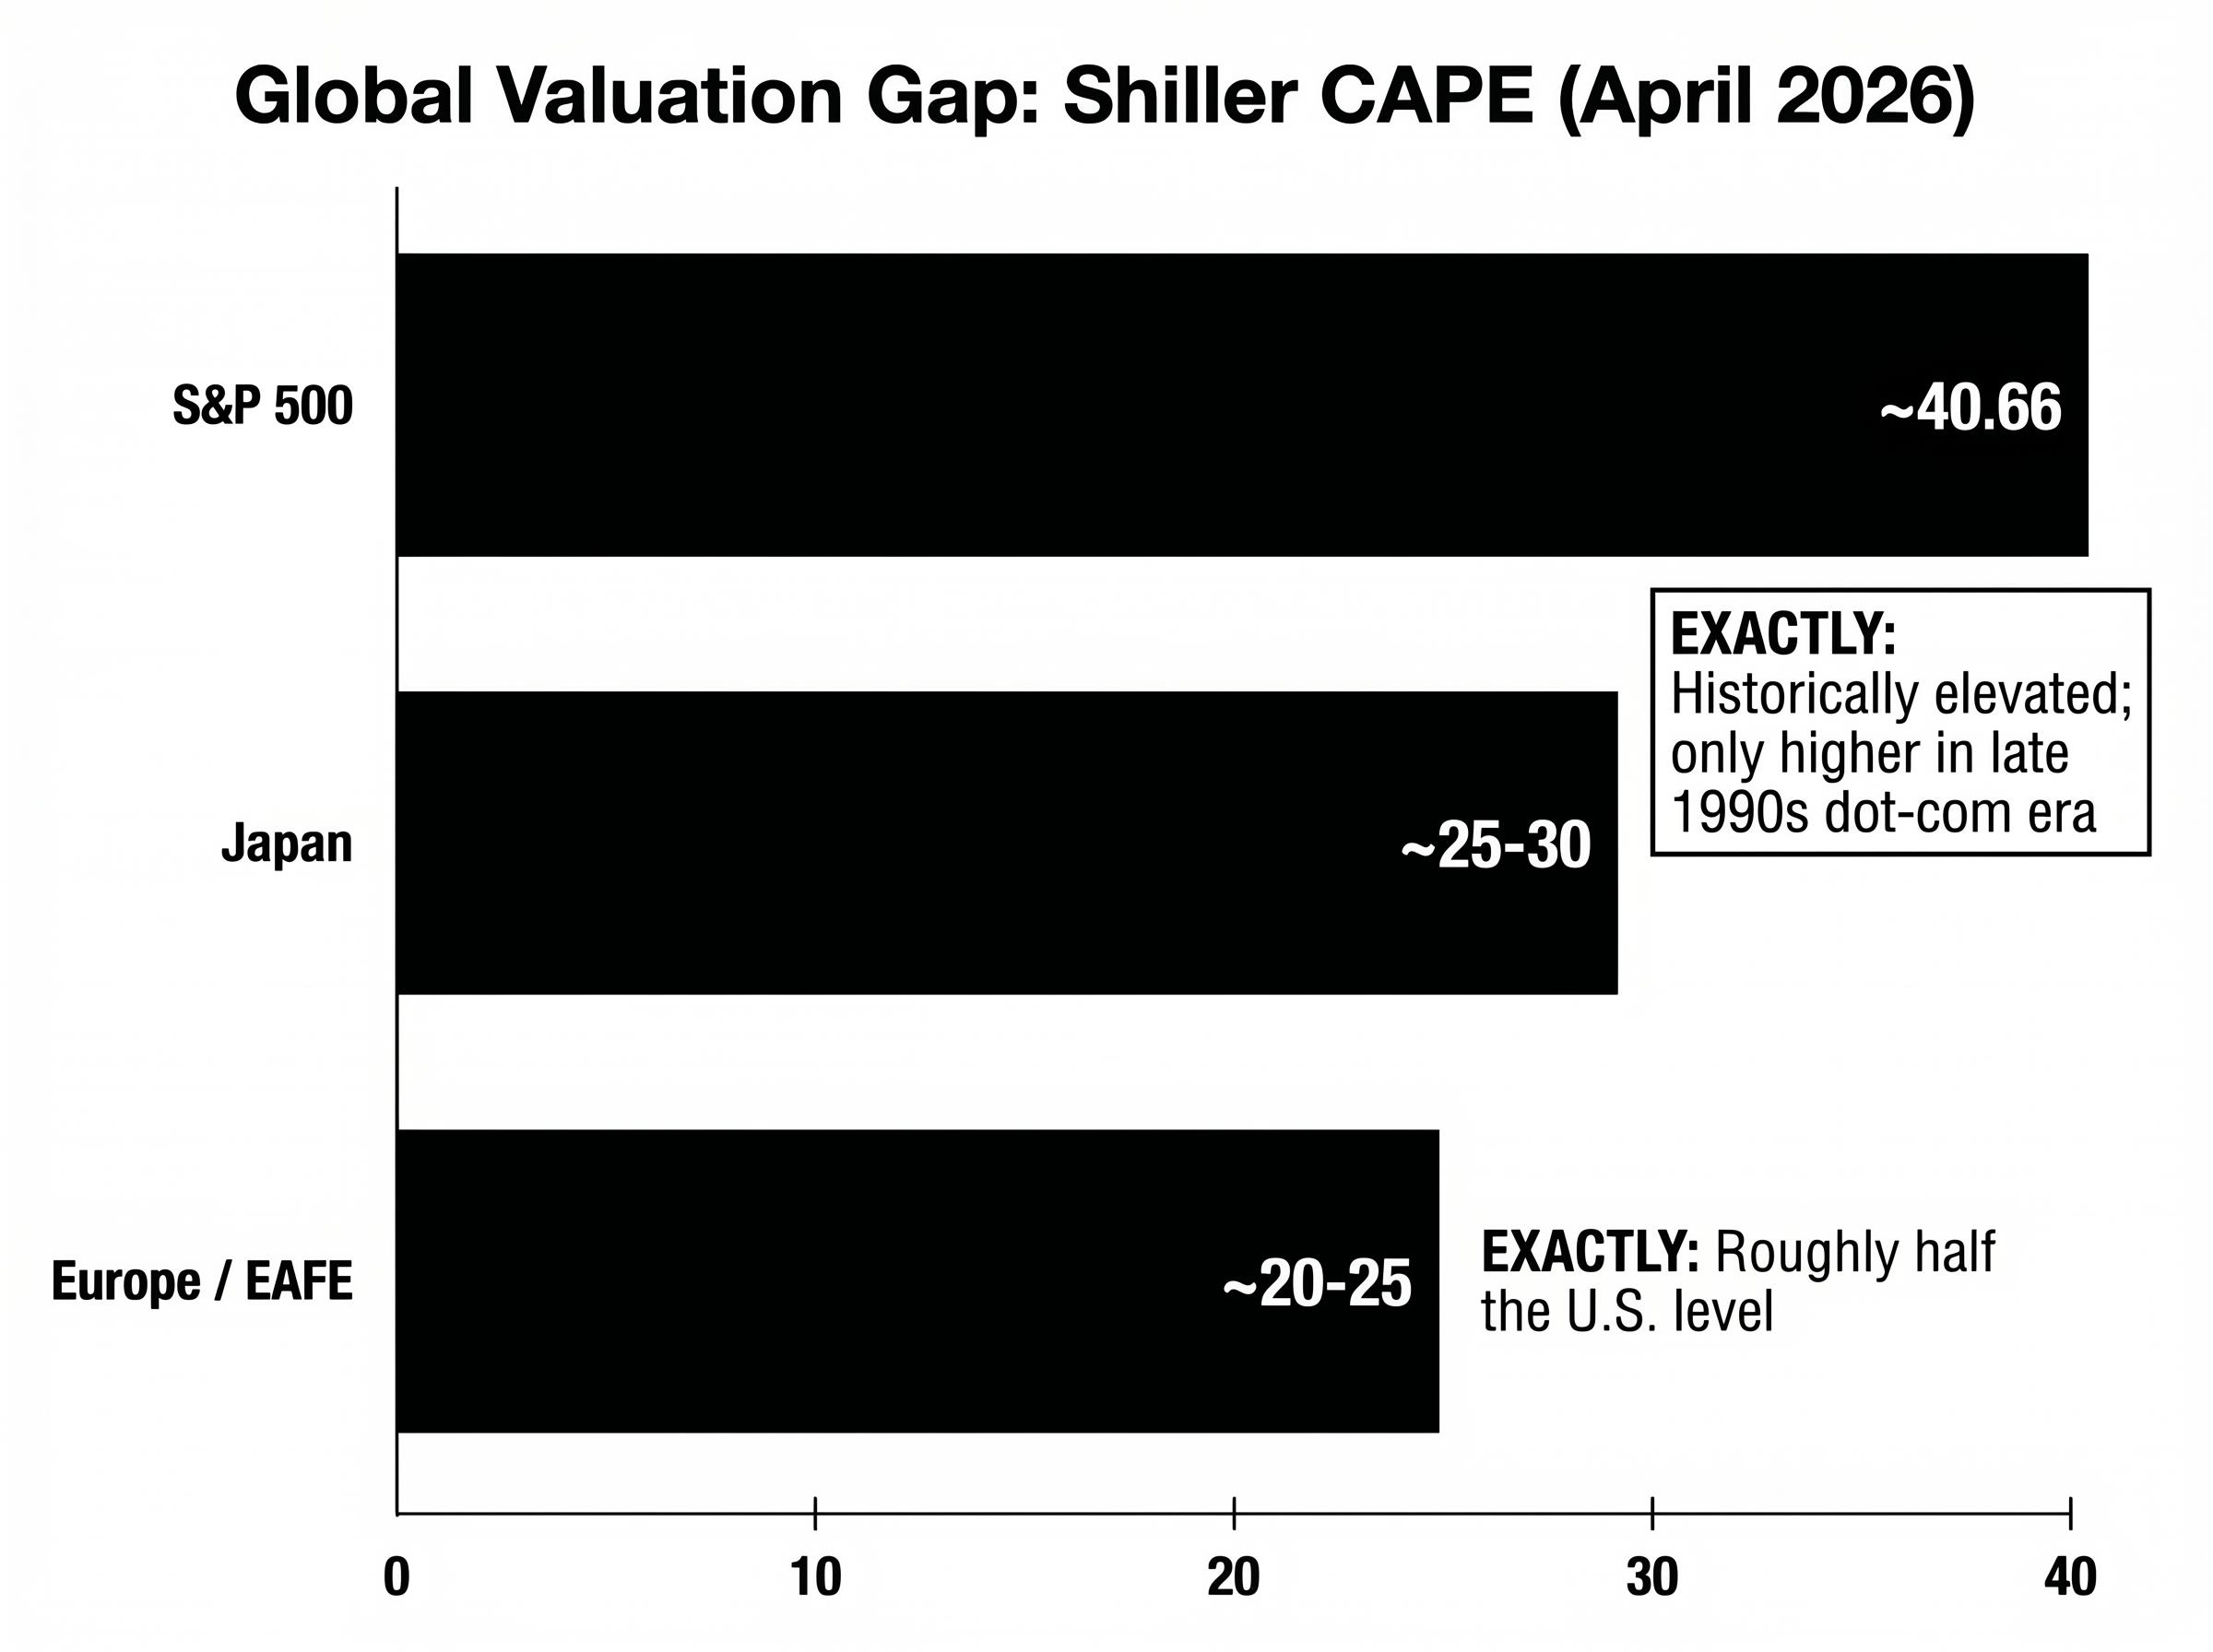
As of April 2026, the S&P 500’s Shiller cyclically adjusted price-to-earnings ratio (CAPE), a measure that smooths earnings over ten years to filter out short-term fluctuations, stands at approximately 40.66. The index itself sits near 7,165. The only period in which U.S. equities were more expensive by this measure was the late 1990s dot-com era.
The gap between U.S. and international valuations makes the number more striking.
| Market | Shiller CAPE (April 2026) | Interpretation |
|---|---|---|
| S&P 500 | ~40.66 | Historically elevated; only dot-com era higher |
| Europe / EAFE | ~20-25 | Roughly half the U.S. level |
| Japan | ~25-30 | Moderate discount to U.S. |
European markets trade at roughly half the U.S. multiple. Japan sits between the two. Robert Shiller, the economist who developed the CAPE ratio, has noted that such valuation disparities have historically favoured international markets over the subsequent decade.
Early 2026 data supports the relevance of that observation. Through April 2026, the MSCI EAFE has returned approximately +10% year-to-date, compared with roughly +5-6% for the S&P 500, extending the relative strength that began in 2025.
The historical relationship between starting CAPE and subsequent ten-year returns is inverse: markets that begin a decade at elevated valuations have tended to deliver lower forward returns than those starting from cheaper levels. The relationship is not deterministic. A high CAPE does not guarantee weak returns, and individual decades have produced exceptions in both directions. What it does is reduce the margin of safety. At a CAPE of 40, the market is priced for continued strong earnings growth, and any shortfall in that growth has a larger impact on returns than it would at a lower starting valuation.
Robert Shiller’s Yale CAPE dataset and methodology tracks the ratio back to 1871, providing the long-run historical context that makes the current reading of approximately 40.66 particularly striking relative to the full distribution of observed values.
This does not invalidate the structural case for U.S. equities. It does mean the structural advantages are already reflected in the price.
For investors who accept the long-term structural case for U.S. equities but recognise the valuation signal, a modest international allocation offers a way to hedge without wholesale reorientation. A starting point of around 5% of a portfolio allocated to international equities provides exposure to the valuation discount without abandoning the thesis that has worked for decades.
One widely used vehicle for that exposure is the Vanguard Total International Stock ETF (VXUS), which carries an annual expense ratio of 0.05% and held a share price of $82.36 at the time of recent reporting, with a 52-week range of $63.23 to $84.48. Its top three holdings, Taiwan Semiconductor Manufacturing, Samsung Electronics, and ASML Holding, illustrate what international diversification actually buys: exposure to global technology supply chains that are not fully represented in the S&P 500.
The 0.05% expense ratio on VXUS means the cost of gaining diversified international exposure has effectively been reduced to near zero, removing one of the historical objections to global allocation.
Before adding international exposure, investors should weigh several practical considerations:
Concentration risk is worth considering on the domestic side as well. Technology led S&P 500 sector returns in 2019, 2020, 2021, 2023, 2024, and 2025. In 2026, the leadership has rotated: the energy sector is up +26.59% year-to-date as of 24 April 2026, and utilities have gained +8.20%. That rotation is a reminder that diversification applies within domestic markets as well as across borders.
For investors ready to move from the allocation decision to implementation, our dedicated guide to international stock allocation for U.S. investors covers Japan’s corporate governance reform tailwind, the foreign tax credit available under IRS Publication 514 for dividends withheld by foreign governments, and how to assess whether an international ETF’s holdings genuinely diversify sector exposure or simply replicate domestic technology bets in different geographies.
The “never bet against America” thesis and the case for modest international diversification are not competing conclusions. They address different time horizons and different sources of portfolio risk. The structural advantages that made the U.S. the world’s dominant equity market, its entrepreneurial culture, legal framework, capital depth, and sector breadth, remain intact. The valuation premium those advantages now command is also real, and at a CAPE near 40.66, it is historically significant.
Investors in 2026 are navigating a moment where a decade of U.S. dominance is fully priced into the index. International markets have already begun to narrow the gap, returning over +31% in 2025 and continuing to outperform in early 2026. That context does not call for abandoning U.S. equity exposure. It does make asset allocation decisions more consequential than they were a decade ago, when the U.S. was winning by wide margins at lower valuations.
The counter-argument for sustained U.S. equity outperformance gained institutional weight in April 2026, when Morgan Stanley Investment Management reversed its European overweight position and $28 billion in net inflows returned to U.S. equity funds following the Iran ceasefire, a reminder that geopolitical catalysts can rapidly shift the relative return calculus that valuation multiples alone do not predict.
This article is for informational purposes only and should not be considered financial advice. Investors should conduct their own research and consult with financial professionals before making investment decisions. Past performance does not guarantee future results. Financial projections are subject to market conditions and various risk factors.
The CAPE ratio (Cyclically Adjusted Price-to-Earnings ratio) smooths earnings over ten years to filter out short-term fluctuations, giving a clearer picture of whether a market is cheap or expensive. As of April 2026, the S&P 500 CAPE stands near 40.66, roughly double the 20-25 range seen in European markets, suggesting international stocks offer a meaningful valuation discount.
Yes. The MSCI EAFE index of developed international markets returned +31.22% in 2025, comfortably ahead of the S&P 500's roughly +18% return for the same year. This reversed the pattern seen in 2024, when the S&P 500 outperformed MSCI EAFE by nearly 20 percentage points.
The article suggests a starting point of around 5% allocated to international equities, providing exposure to the valuation discount without abandoning the long-term structural case for US equities. A low-cost vehicle like the Vanguard Total International Stock ETF (VXUS) at a 0.05% expense ratio is cited as one practical implementation option.
The article identifies four interlocking pillars: an entrepreneurial culture that produces risk-tolerant founders at scale, strong property rights and rule of law, deep and liquid capital markets, and multi-sector dominance spanning technology, finance, defence, energy, and pharmaceuticals. These conditions have compounded over decades to produce sustained outperformance relative to most other developed markets.
The MSCI EAFE index tracks equity markets across 21 developed countries, excluding the US and Canada, covering regions such as Europe, Australasia, and the Far East. It is a widely used benchmark for international developed-market equity performance and returned +31.22% in 2025.


