
Neobo Fastigheter Hits Record 94% Occupancy in Q1 Results
14 hrs ago

United Airlines delivered quarterly results that beat Wall Street estimates, then watched its shares fall 6% to close near $91 on 22 April 2026. The paradox was immediate: $15.40 billion in Q1 revenue, up 8% year over year. Adjusted earnings per share of $3.10, clearing the $2.97 consensus. Passenger volume up 10%.
Then the guidance arrived.
Full-year 2026 EPS expectations fell from $12-$14 to $7-$11, a 35-40% cut at the midpoint. The revision reflected a single factor outside management control: jet fuel prices driven by the Iran war and the resulting Strait of Hormuz crisis. Trading volume surged to 10.78 million shares, nearly double the 30-day average of 7.19 million, as investors absorbed the reality that backward-looking earnings strength could not offset forward-looking cost pressure.
Full-year 2026 EPS guidance revised to $7-$11 from $12-$14
The market priced the future, not the past. United’s Q1 performance demonstrated operational execution and demand resilience. The guidance cut signalled that neither would be sufficient to preserve profitability if fuel remained elevated through year-end.
United’s 6% single-day decline on 22 April reflects the violent equity swings driven by Strait of Hormuz headlines that have produced a 500-point Dow whipsawing range over three days, with bank forecasts for Brent ranging from $60 to $150 per barrel depending on conflict duration and creating sector-wide divergence based on energy cost exposure.
—
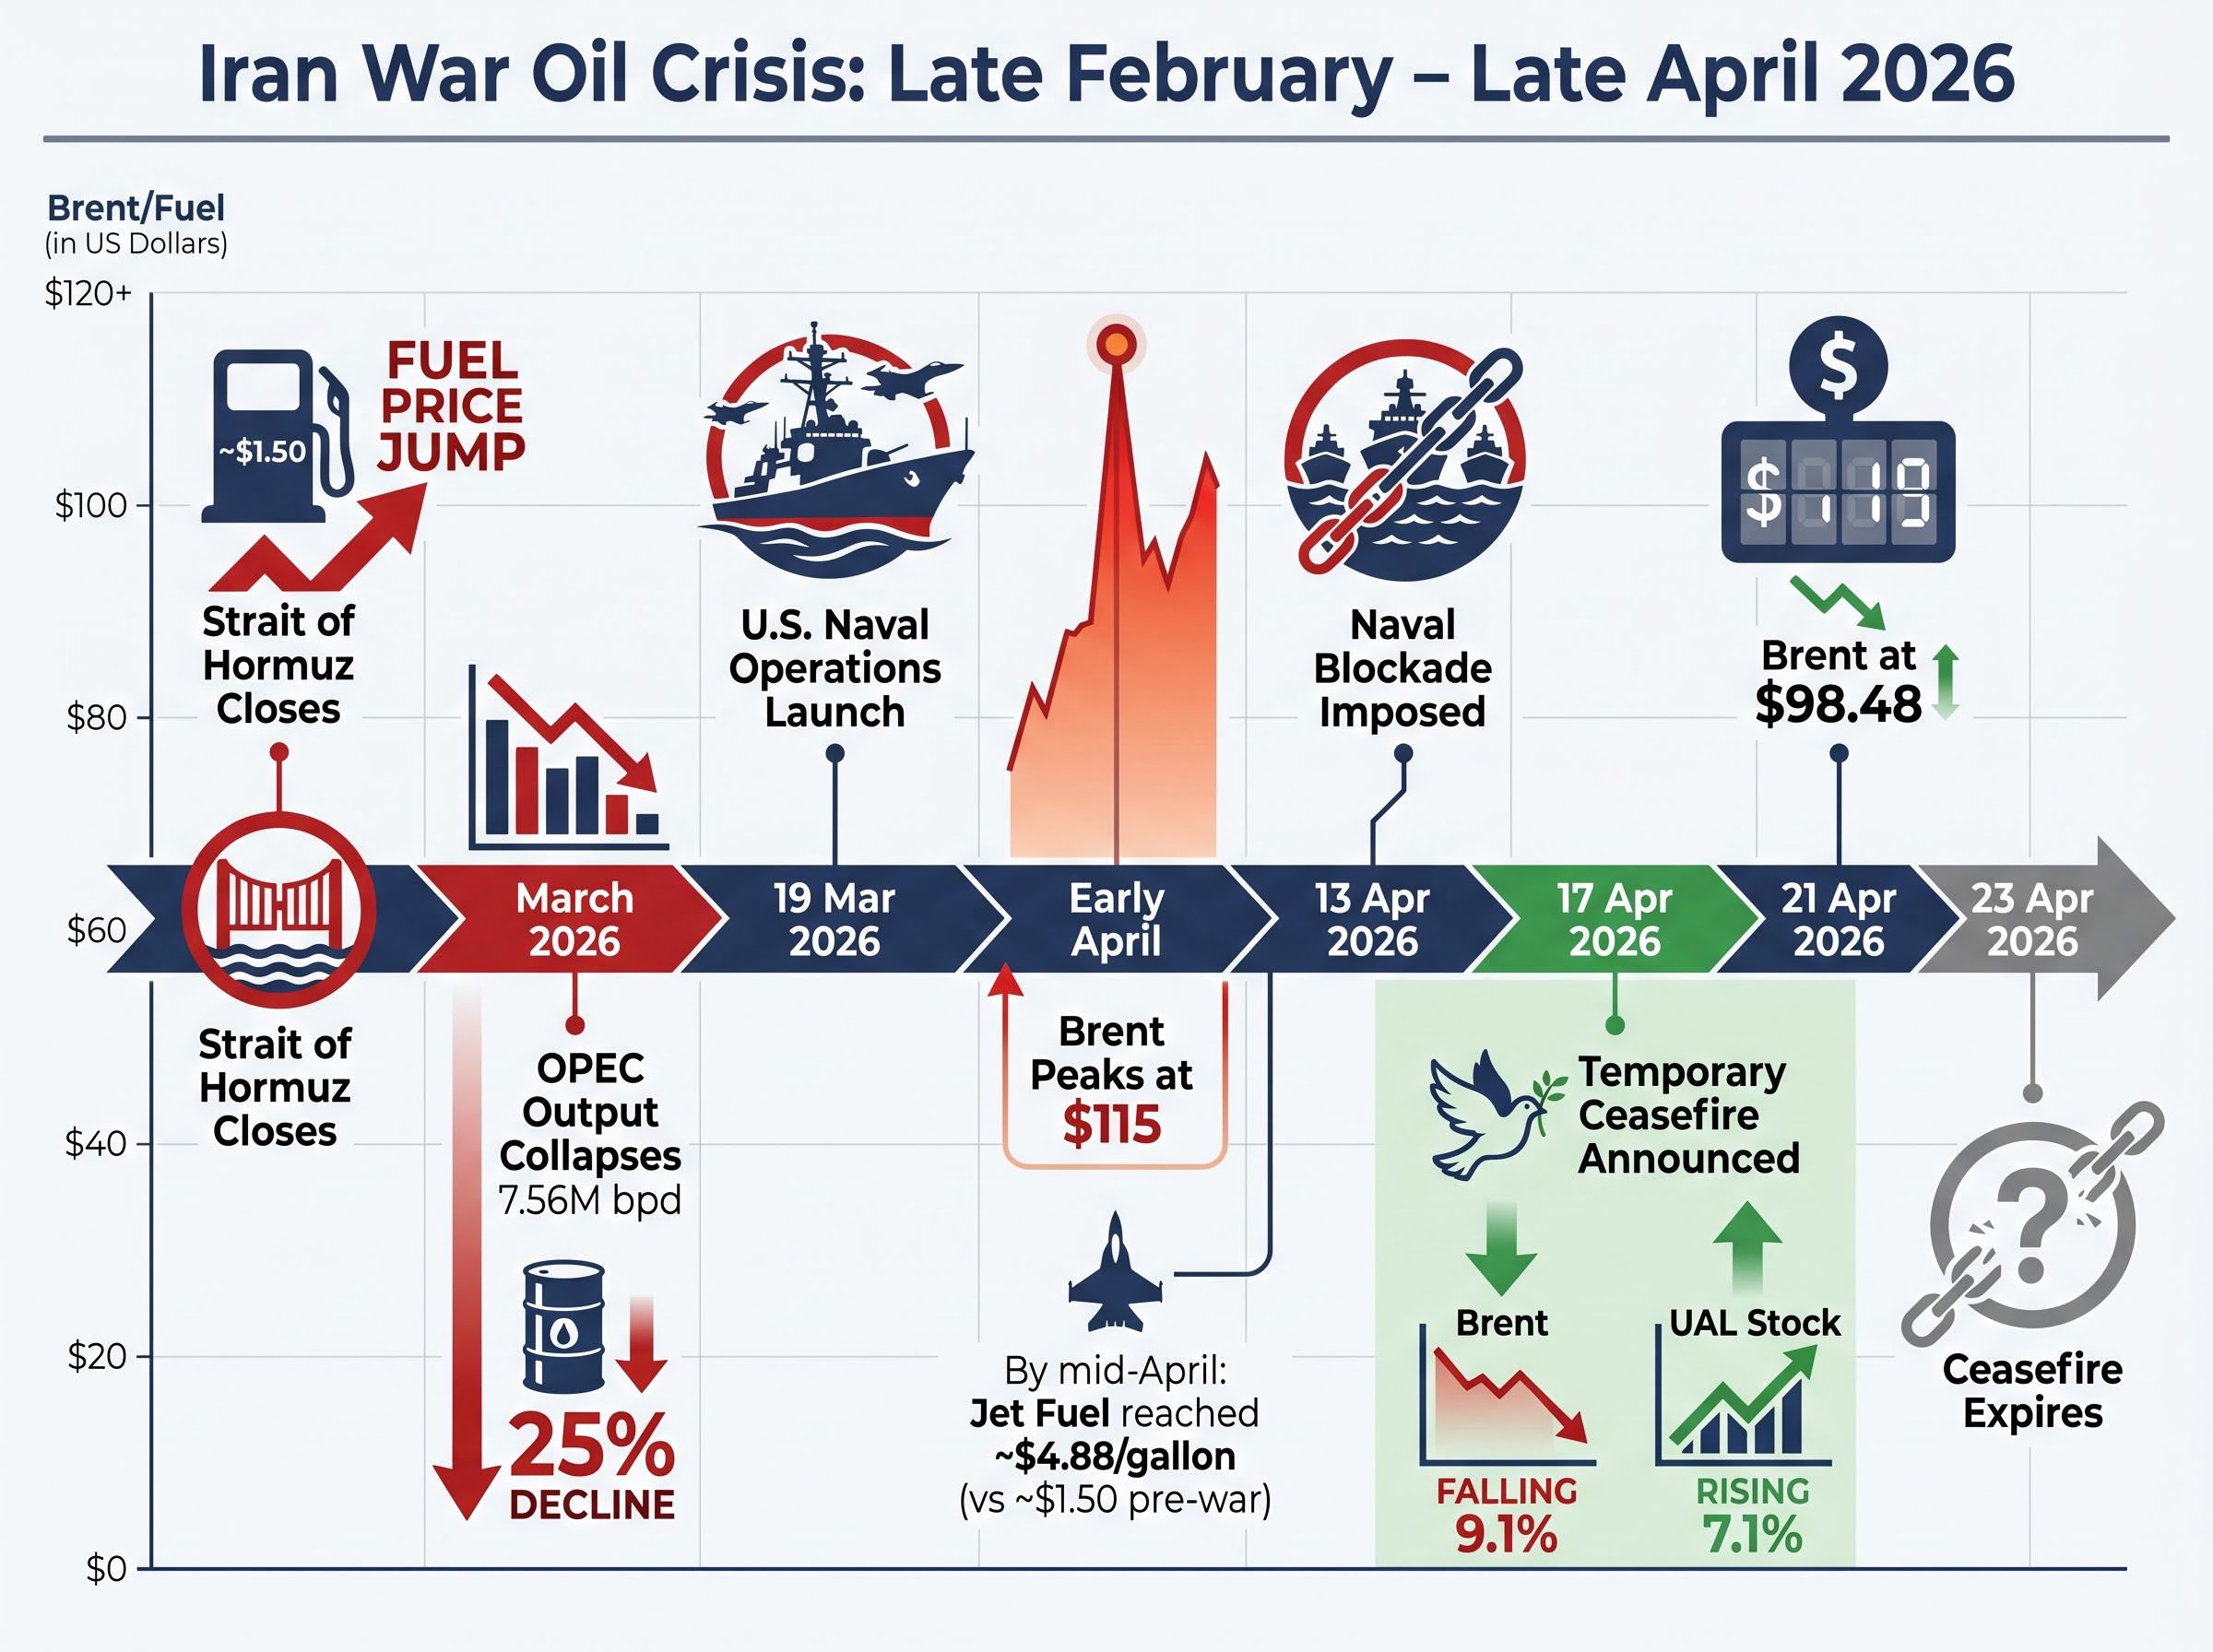
The Strait of Hormuz closed on 28 February 2026 when the Iran war erupted, severing the world’s most critical oil chokepoint and doubling jet fuel prices within weeks. U.S. Gulf Coast kerosene-type jet fuel spot prices reached approximately $4.88 per gallon by mid-April, up from $1.50 pre-war. United projects the crisis will add $1.5-2 billion in annual fuel expenses, with Q2 alone facing a $600 million headwind.
The Strait of Hormuz closure on 28 February 2026 severed the world’s most critical oil chokepoint, halting approximately 20 million barrels of petroleum liquids per day and triggering the largest oil supply disruption in modern history.
The supply disruption was historic. OPEC crude output collapsed by 7.56 million barrels per day in March 2026, a 25% decline that surpassed the 1973 Arab oil embargo in absolute production terms. The International Energy Agency characterised it as the largest supply disruption in the history of global oil markets. Iraq saw production fall 2.76 million barrels per day, Saudi Arabia 2.07 million, UAE 1.44 million. Brent crude climbed to $115 in early April before moderating to $98.48 by 21 April.
U.S. naval operations launched on 19 March 2026 to reopen the strait, followed by a naval blockade on 13 April after ceasefire negotiations in Islamabad collapsed. A temporary ceasefire announced on 17 April brought brief relief. Brent fell 9.1%, United’s stock rallied 7.1%. The optimism lasted 48 hours. The ceasefire was set to expire 23 April, and President Trump indicated an extension was “highly unlikely”.
Jet fuel prices reached $2.73-$4.88 per gallon versus approximately $1.50 pre-war. United projects $1.5-2 billion in annual fuel expense increases.
Fuel now represents 30-35% of United’s operating expenses, up from the historical 20-25%. The arithmetic is straightforward: every additional dollar per gallon translates to hundreds of millions in annual costs for a carrier consuming billions of gallons. The geopolitical resolution timeline determines whether United hits the lower or upper end of its guidance range.
The refining margin component not covered by Brent Crude hedges, known as crack spread movements, widened by up to 423% from approximately US$22 to US$115 per barrel for carriers like Air New Zealand despite 83% crude oil hedging, illustrating why United’s 20-25% hedging coverage provides only partial protection against total fuel cost exposure.
—
Fuel costs flow through to earnings in a sequence airlines attempt to compress: absorb the initial shock, raise fares to recapture costs, reduce capacity to defend margins. United’s Q1 fuel expenses of $3.15 billion, up 25% year over year, consumed approximately $340 million of profitability. That represented nearly 70% of Q1 pre-tax earnings, meaning the company’s strong operational performance barely offset the fuel headwind.
The recovery mechanism is pricing power. United expects to recoup 40-50% of incremental Q2 fuel costs through higher fares, rising to 85-100% cost offset by year-end through pricing and operational efficiencies. The timeline matters: the 50-60% of Q2 fuel increases not recovered flows directly to pre-tax earnings as lost profit. The company reduced capacity by approximately 5 percentage points for the remainder of 2026, cutting Q3-Q4 capacity growth to flat or 2% versus original higher growth plans.
This reflects management’s assessment that demand elasticity, particularly in leisure segments, is sufficiently high that maintaining planned capacity whilst raising fares 15-20% would destroy profitability through load factor deterioration. Supply restraint is preferable to margin-destroying revenue growth when the cost shock is this severe.
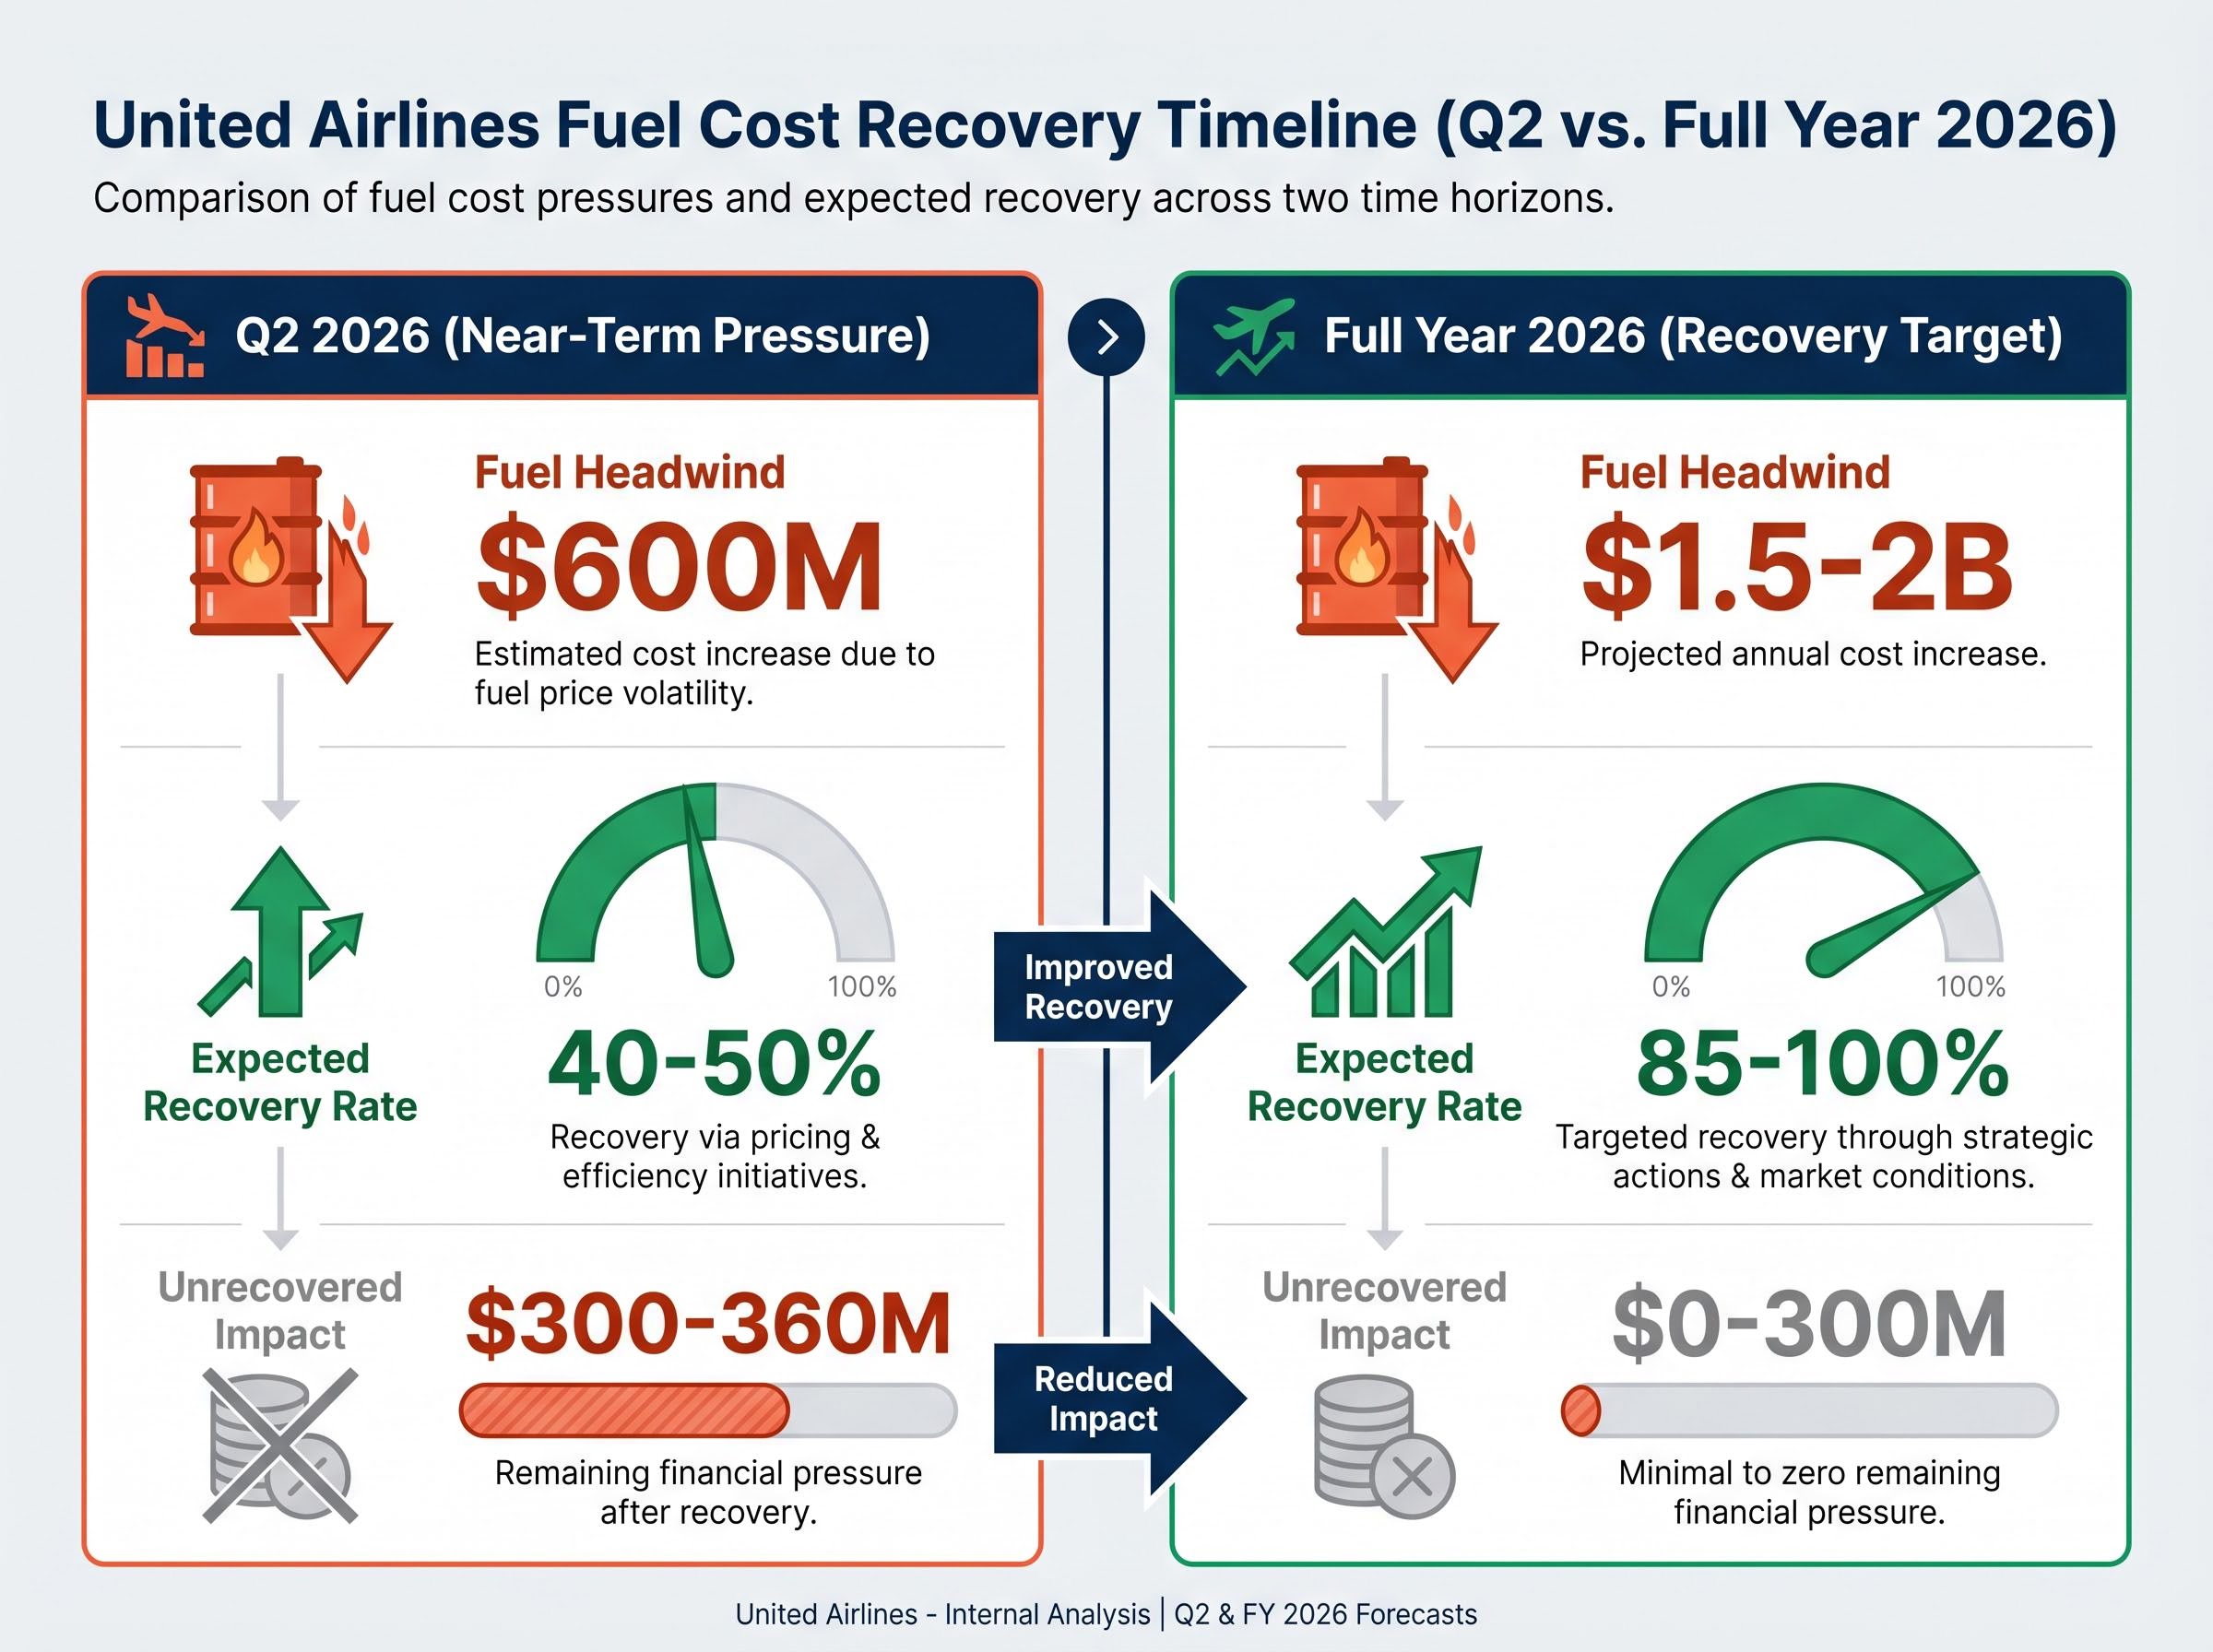
| Period | Fuel Headwind | Expected Recovery Rate | Unrecovered Impact |
|---|---|---|---|
| Q2 2026 | $600 million | 40-50% | $300-360 million |
| Full Year 2026 Target | $1.5-2 billion | 85-100% | $0-300 million |
The Q2 EPS guidance of $1-$2 sits below the $1.96 consensus, signalling that near-term profit compression is unavoidable. The wide range reflects the single dominant variable: where fuel prices settle. If oil moderates toward $80-90 per barrel by Q3, results approach the upper end. If oil remains above $100 through summer, results fall toward the lower bound.
—
United occupies the competitive middle ground, neither as protected as Delta nor as exposed as American. Delta maintained its 2026 guidance at $6.50-$7.50 per share despite disclosing more than $2 billion in incremental fuel expenses. The differential is structural: Delta’s refinery ownership allows it to capture downstream margins rather than purchasing refined jet fuel on the open market, providing a cost advantage of potentially hundreds of millions of dollars annually.
American faces acute vulnerability. Debt of $36.5 billion versus United’s $28 billion limits financial flexibility, whilst complete absence of fuel hedging leaves the carrier fully exposed to spot price movements. UBS slashed American’s 2026 EPS estimate from over $2.00 to merely $0.43 per share, reflecting the compounding effect of high leverage and zero cost protection. American is scheduled to report Q1 2026 results on 23 April.
For investors exploring how other international carriers are navigating the fuel shock, our coverage of Qantas’s response to the Middle East fuel crisis examines jet refining margin movements from US$20 to US$120 per barrel, fare increase strategies, domestic capacity cuts, and the decision to pause share buybacks while defending dividends.
Southwest navigates transformation initiatives amid the same fuel pressures. Q1 2026 EPS of $0.45 versus $1.19 consensus represented a major miss, with Q2 guidance of $0.35-$0.65 (midpoint $0.50) sitting below the $0.60 consensus. The carrier paid $2.73 per gallon for jet fuel in Q1 and withheld full-year outlook updates due to uncertainty. Transformation initiatives including assigned seating and premium cabin offerings delivered 8.1 percentage points of margin expansion year over year, but structural improvements were insufficient to offset fuel cost magnitude.
United hedged 20-25% of Q3 consumption at locked-in rates below $2.50 per gallon, providing partial buffer. The company accelerated debt paydown, retiring more than $3.1 billion in Q1 alone and successfully refinancing at coupons below 5%, the first high-yield issuance at that level since Ford in 2018.
| Carrier | Debt Load | Fuel Hedging | 2026 Guidance Status |
|---|---|---|---|
| United | $28 billion | 20-25% Q3 hedged | Revised to $7-11 |
| Delta | Lower than United | Refinery advantage | Maintained at $6.50-7.50 |
| American | $36.5 billion | Zero hedging | Expected major cut |
| Southwest | Lower leverage | Limited hedging | Withheld full-year |
—
The public market sold, but professional analysts held. 16 of 17 analysts rate UAL as Buy or Strong Buy, with an average price target of $131-$133 implying 35-40% upside from post-announcement levels near $91-97. The divergence reflects differing time horizons: the market priced near-term earnings visibility concerns, whilst analysts maintained conviction that the guidance cut represents cyclical headwinds rather than structural impairment.
Barclays maintained its $150 price target, representing approximately 54% upside, on the view that fuel assumptions may prove conservative and the company’s pricing power will enable cost recovery. TD Cowen reduced its target to $120 from $140 but upgraded to Strong Buy, noting that Q2 fuel recovery expectations of 40-50% appear achievable and year-end targets of 85-100% offset align with historical patterns. Morgan Stanley maintained its $150 target, ranking Delta top amongst carriers due to refinery advantage but positioning United as a near-peer meeting all fundamental benchmarks.
Consensus price target of $131-$133 implies 35-40% upside from current levels. 16 of 17 analysts maintain Buy or Strong Buy ratings.
Analyst 2027 recovery projections of $14-16 EPS assume fuel normalisation within 12-18 months. The consensus 2026 EPS estimate of $7.95 sits slightly above the company’s guidance midpoint of $9, suggesting professional forecasters view management assumptions as appropriately conservative rather than aggressive. Wells Fargo, Jefferies, and Susquehanna all reduced price targets to reflect revised earnings expectations whilst maintaining Overweight or Buy ratings, signalling that valuation compression from the guidance cut creates opportunity rather than signalling avoidance.
—
Three variables determine whether United approaches the $7 lower end or $11 upper end of guidance. The ceasefire expires 23 April. President Trump indicated an extension is “highly unlikely”, setting up the immediate catalyst. If diplomatic efforts collapse and hostilities resume, oil tests new highs and United trends toward the lower guidance bound. If negotiations produce a durable ceasefire, Brent moderates toward $80-90 and the company approaches the upper end.
Goldman Sachs Asset Management’s base case projects Brent peaking at $115 before recovering to $80 by year-end 2026. Under this scenario, United could achieve profitability near the $9-10 guidance midpoint. The downside scenario holds oil above $100 through summer travel season, compressing margins and pushing results toward $7-8. The upside case sees rapid Middle East resolution and oil falling to $80-90 by Q3, enabling results to exceed $11 and potentially supporting a rally to $130-150 analyst targets within 12 months.
Q2 results provide the next fundamental checkpoint. Guidance of $1-$2 EPS versus consensus of $1.96 means modest beats or misses will meaningfully influence full-year trajectory confidence. Technical support sits at $85-88, with resistance at $100. The stock’s path depends overwhelmingly on geopolitical developments outside management control.
Key monitoring points:
—
United’s guidance revision reflects genuine fuel crisis driven by geopolitical events outside management control. The company beat Q1 estimates with $15.40 billion revenue and $3.10 adjusted EPS, demonstrating operational resilience and pricing power. The 35-40% guidance cut to $7-11 acknowledges that fuel costs consuming 30-35% of operating expenses cannot be fully offset in the near term, even with capacity reductions and fare increases recovering 40-50% of Q2 headwinds.
The competitive position is middle-tier: healthier balance sheet than American’s $36.5 billion debt load, partial hedging coverage at 20-25% of Q3 consumption, but lacking Delta’s refinery advantage. Analyst conviction remains strong, with 16 of 17 Buy or Strong Buy ratings and average price targets of $131-$133 implying 35-40% upside for investors with tolerance for volatility and confidence in eventual Middle East resolution.
Monitor the 23 April ceasefire deadline and oil price movements for the next directional signals on the stock. If Brent moderates toward $80-90 by Q3, United’s pricing power and capacity discipline position the company to approach the upper end of guidance and validate professional analyst targets. If oil remains elevated above $100 through year-end, results trend toward the lower bound and the stock tests $85-88 technical support.
This article is for informational purposes only and should not be considered financial advice. Investors should conduct their own research and consult with financial professionals before making investment decisions.
United Airlines shares fell 6% on 22 April 2026 because the company slashed its full-year 2026 EPS guidance by 35-40%, from $12-$14 to $7-$11, due to surging jet fuel costs caused by the Iran war and Strait of Hormuz closure. Investors focused on the forward-looking earnings risk rather than the strong Q1 results.
The Strait of Hormuz is the world's most critical oil chokepoint, and its closure on 28 February 2026 following the Iran war halted roughly 20 million barrels of petroleum per day, driving jet fuel prices from approximately $1.50 per gallon to as high as $4.88 per gallon. For airlines like United, this translates to $1.5-2 billion in additional annual fuel expenses and major earnings pressure.
Delta holds a structural advantage through refinery ownership, allowing it to capture downstream margins and maintain 2026 guidance at $6.50-$7.50 EPS, while American faces the greatest risk with $36.5 billion in debt and zero fuel hedging, resulting in an EPS estimate cut to just $0.43. United sits in the middle, with $28 billion in debt and 20-25% of Q3 consumption hedged below $2.50 per gallon.
16 of 17 Wall Street analysts maintain Buy or Strong Buy ratings on United Airlines, with an average price target of $131-$133, implying 35-40% upside from post-announcement levels near $91-$97. Key targets include $150 from Barclays and Morgan Stanley, and $120 from TD Cowen.
The three key variables are the ceasefire outcome on 23 April, Brent crude oil price trajectory (moderation to $80-$90 supports the upper end of guidance), and Q2 2026 earnings results where guidance of $1-$2 EPS sits below the $1.96 consensus. A durable ceasefire and oil price decline toward $80-$90 by Q3 would be the clearest positive catalysts.


