Why the S&P 500 PE Ratio Is Falling During a Bull Market

Key Takeaways
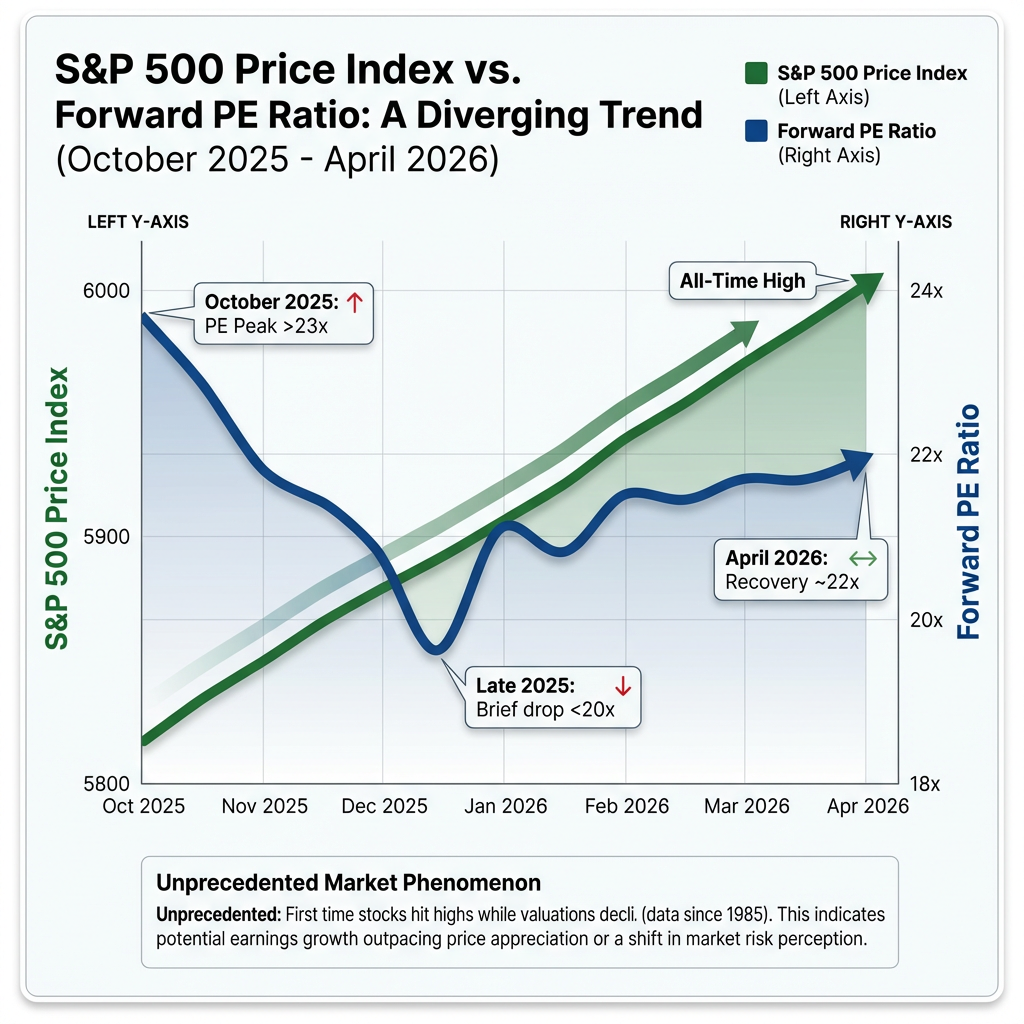
- The S&P 500 forward PE ratio has compressed from above 23x in October 2025 to approximately 22x in April 2026, even as the index reached all-time highs, a divergence unprecedented in data going back to 1985.
- Forward PE estimates currently range from 20.68 to 23.60 depending on methodology, while trailing PE ratios sit materially higher at 27.09 to 30.62, reflecting strong analyst expectations for future earnings growth.
- Artificial intelligence enthusiasm has driven earnings forecasts sharply higher, with annual data centre capital deployment estimated at approaching $600 billion, providing fundamental support for elevated valuations.
- Current valuations remain well above the long-run historical average of approximately 16x forward earnings, meaning meaningful execution risk persists if AI monetisation takes longer than markets anticipate.
- The healthiest path to valuation normalisation is earnings growth outpacing price gains, the pattern currently unfolding, rather than a sharp price correction.
The S&P 500 has delivered a puzzling signal to investors in recent months. Stock prices reached all-time highs, yet valuations measured by the price-to-earnings ratio declined, a divergence unprecedented in market data stretching back to 1985. This counterintuitive behaviour reflects a fundamental shift in how earnings expectations are reshaping market dynamics.
Understanding this valuation puzzle matters for anyone tracking equity markets in 2026. The forward PE ratio currently sits in a range of approximately 20.68 to 23.60, depending on methodology and data source. This represents a notable compression from the peak above 23x recorded in October 2025, even as the index gained roughly 3% from those highs. The mechanics behind this phenomenon and what it signals about market sustainability deserve close examination.
Current S&P 500 PE Ratio: April 2026 Snapshot
The S&P 500 valuation picture varies across data providers, reflecting differences in calculation methodology and earnings estimation windows. As of mid-April 2026, forward PE estimates range from a low of 20.68 to a high of 23.60.
YCharts reports a forward PE of 23.60 based on consensus earnings estimates for Q4 2026, down from 24.54 in the previous quarter. This quarter-on-quarter decline of nearly one full multiple point represents meaningful compression in valuations despite rising stock prices. MacroMicro, using a different estimation approach, shows a forward PE of 20.68 as of 17 April. The gap between these figures stems from variations in which forward earnings estimates are used and how aggregation is performed across the index.
| Source | PE Type | Value | Date |
|---|---|---|---|
| YCharts | Forward (Q4 2026) | 23.60 | Current |
| MacroMicro | Forward | 20.68 | 17 April 2026 |
| World PE Ratio | Trailing | 27.09 | 17 April 2026 |
| Multpl | Trailing | 30.62 | 17 April 2026 |
Trailing PE ratios, which measure current prices against actual past 12-month earnings, show significantly higher readings. World PE Ratio reports 27.09 whilst Multpl shows 30.62, both as of 17 April. This substantial spread between forward and trailing metrics contains important information about market expectations for earnings growth.
The YCharts decline from 24.54 to 23.60 over a single quarter captures the broader trend. Valuations are compressing not through falling stock prices but through rising earnings expectations that are outpacing price appreciation.
When big ASX news breaks, our subscribers know first
Understanding Forward vs. Trailing PE Ratios
The forward PE ratio divides the current share price by analyst consensus estimates of profits expected over the next 12 months. Investors focus on this metric because it incorporates expectations about future business conditions, growth trajectories, and earnings power. A forward PE of 22x means investors are paying $22 for every dollar of earnings the market expects companies to generate in the coming year.
The trailing PE ratio uses a different denominator. It divides current price by actual reported earnings from the past 12 months. This backward-looking measure reflects what companies have already achieved rather than what they might deliver ahead.
The significant gap between forward PE (around 20.68 to 23.60) and trailing PE (around 27.09 to 30.62) reveals market expectations in concrete terms. A spread of roughly 7 to 10 points suggests analysts anticipate substantial earnings growth ahead. If forward estimates materialise, companies will deliver enough profit growth to justify current stock prices and bring trailing PE ratios down to align with forward metrics over time.
The substantial spread between forward PE (around 22x) and trailing PE (around 29x) suggests analysts expect meaningful earnings growth ahead, which is supporting current stock prices despite elevated absolute valuation levels.
Why Valuations Fell While Stocks Hit Record Highs
Stock prices climbing to all-time highs whilst PE ratios simultaneously decline represents a pattern without precedent in market data extending back to 1985. Typically, when analysts raise profit forecasts, this optimism fuels additional buying that pushes stock prices higher faster than earnings estimates can rise, expanding valuation multiples. The current dynamic reverses this relationship.
The mechanism driving this divergence centres on the pace of change. Earnings forecasts surged so dramatically that even with the S&P 500 gaining approximately 3% from October 2025 highs, the denominator in the PE calculation grew faster than the numerator. When expected earnings per share rises faster than share prices, the resulting ratio compresses.
Key milestones in this valuation journey include:
- October 2025: Forward PE peaked above 23x
- Late 2025/Early 2026: Ratio dropped below 20x briefly
- April 2026: Recovery to approximately 22x range
These levels all sit materially above the historical long-run average of approximately 16x forward earnings, indicating valuations remain elevated even after compression. The Wall Street Journal analysis referenced in market commentary suggests two major factors behind surging earnings forecasts may prove temporary rather than sustainable, raising questions about whether this valuation normalisation path can continue.
The AI Factor: How Tech Enthusiasm Shapes Valuations
Artificial intelligence enthusiasm pushed S&P 500 valuations past the 2020 pandemic-era bubble peak to levels comparable with the dot-com era around 2000. This historical context frames the October 2025 forward PE peak above 23x as part of a technology-driven valuation expansion that echoes previous periods of transformative technological optimism.
The Wall Street Journal’s historical analysis comparing AI valuations to the dot-com bubble examines whether current earnings forecasts rest on sustainable business models or speculative assumptions, providing critical context for evaluating technology-driven valuation premiums.
Technology firms positioned to benefit from continued capital deployment into data centre infrastructure represent the primary beneficiaries. Companies like Nvidia, which supply the computational hardware and semiconductors powering AI model training and inference, saw earnings estimates rise sharply. The investment thesis driving these valuations centres on the belief that AI adoption will generate substantial revenue streams and productivity gains across the economy, justifying premium multiples for companies enabling this transition.
Understanding semiconductor sector valuation dynamics provides additional context for how AI-driven earnings expectations are playing out across different technology subsectors, with semiconductors showing particular resilience compared to software equities.
The scale of capital deployment into data centre infrastructure has reached unprecedented levels in 2026, with estimates approaching $600 billion annually, providing fundamental support for earnings growth projections that underpin current valuations.
The critical uncertainty facing investors involves distinguishing between durable earnings growth and temporary factors. Wall Street Journal framing characterises some drivers of recent earnings forecast increases as potentially transitory, suggesting current valuations may not fully account for execution risk or the possibility that AI monetisation takes longer than markets currently anticipate.
The critical question facing investors centers on execution risk and AI monetisation timeline uncertainty, factors that could require significant downward revisions to the earnings forecasts driving recent PE compression.
The next major ASX story will hit our subscribers first
Is the Market Overvalued? Historical Context
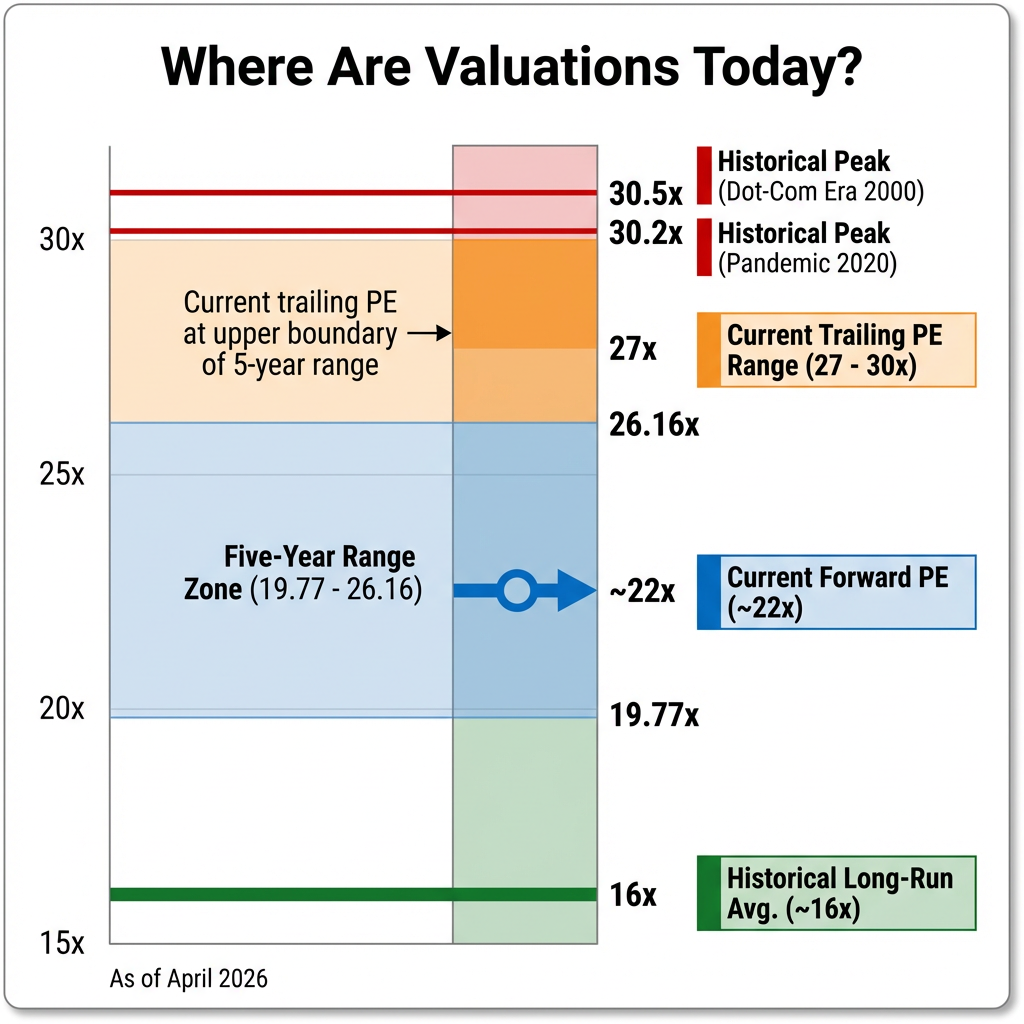
Historical benchmarks provide objective reference points for assessing current valuation levels. The trailing PE of 27.09 exceeds the five-year average range of 19.77 to 26.16, placing current readings at the upper boundary of recent norms. Forward PE estimates around 22x sit significantly above the long-run historical average of approximately 16x.
The historical 16x forward earnings benchmark is derived from Yardeni Research’s comprehensive S&P 500 valuation dataset tracking PE ratios since 1979, providing the authoritative multi-decade reference point for assessing current market conditions.
Earlier analysis from October 2025 showed PE expansion driven primarily by price gains rather than earnings growth, with a 7.1% rise in valuations during the period from April to October 2025. The recent compression suggests earnings expectations have caught up somewhat with prices, shifting the driver of high valuations from pure multiple expansion toward anticipated profit growth.
Two scenarios exist for how valuations might normalise from current elevated levels:
Investors seeking practical frameworks for navigating valuation normalization can examine both historical patterns and current market conditions, including strategies that have historically performed during periods of compressed risk premiums.
- Stock prices decline to align with earnings trajectories (market correction)
- Earnings growth continues and validates current price levels (soft landing through profit expansion)
The path forward depends entirely on whether earnings forecasts embedded in current analyst estimates materialise as projected. If companies deliver on expectations, trailing PE ratios will decline naturally as actual profits catch up to forward projections. If earnings disappoint, the market may need to adjust prices downward to restore valuation equilibrium.
What This Means for Investors in 2026
PE compression achieved through earnings growth rather than price declines represents the healthiest path to valuation normalisation. This pattern appears to be unfolding currently, with forward estimates rising faster than stock prices and bringing multiples down from October 2025 peaks. The sustainability of this dynamic depends on companies converting optimistic forecasts into actual results.
Investors should monitor several key factors through the remainder of 2026:
- Q1 2026 earnings results compared to analyst expectations
- Forward guidance from major technology companies regarding AI revenue trajectories
- Artificial intelligence capital expenditure trends and data centre investment sustainability
- Whether analysts continue raising earnings estimates or begin cutting forecasts
Current valuations remain elevated relative to historical averages of approximately 16x forward earnings, but the direction of change provides some reassurance. The market is working toward a more sustainable equilibrium by growing earnings expectations faster than prices rather than requiring a sharp correction. The key variable determining whether this path continues is execution, whether companies can deliver the profit growth currently embedded in analyst models.
This article is for informational purposes only and should not be considered financial advice. Investors should conduct their own research and consult with financial professionals before making investment decisions.
Frequently Asked Questions
What is the S&P 500 PE ratio right now in 2026?
As of mid-April 2026, the S&P 500 forward PE ratio ranges from approximately 20.68 to 23.60 depending on the data source and methodology, while trailing PE ratios sit higher, between 27.09 and 30.62.
Why did the S&P 500 PE ratio fall while stock prices hit record highs?
Earnings forecasts rose faster than stock prices, meaning the denominator in the PE calculation grew quicker than the numerator, compressing the ratio even as the index gained roughly 3% from its October 2025 highs.
What is the difference between forward and trailing PE ratios for the S&P 500?
The forward PE divides current prices by analyst estimates of future earnings over the next 12 months, while the trailing PE uses actual reported earnings from the past 12 months, making the forward measure more sensitive to growth expectations.
Is the S&P 500 overvalued compared to historical averages?
Current forward PE estimates around 22x sit significantly above the long-run historical average of approximately 16x, and the trailing PE of 27.09 exceeds the five-year average range of 19.77 to 26.16, indicating elevated valuations relative to historical norms.
What should investors watch to assess S&P 500 valuations through the rest of 2026?
Investors should monitor Q1 2026 earnings results versus analyst expectations, forward guidance from major technology companies on AI revenue, and whether analysts continue raising or begin cutting earnings estimates.