
The US dollar pushed to about 1.4120 Canadian dollars on Friday, 6 November 2026, a gain of roughly 0.78%, after two jobs reports released at the same moment pointed in opposite directions. US hiring blew past forecasts while Canada shed jobs for a third straight month, and the USD/CAD forecast tilted firmly towards a stronger greenback.
The timing sharpened the reaction. US payrolls beat expectations by about 100,000 jobs, and Canada posted an unexpected loss, little more than a week after both central banks made their 28 October policy decisions.
Those decisions set up very different starting points. The Federal Reserve held rates but showed hawkish dissent, while the Bank of Canada (BoC) raised rates for the first time in more than three years.
Here is what drove the move, why the two central banks now look further apart, and which chart levels decide whether the rally extends or fades.
Why did strong US payrolls push Fed hike odds toward 80%?
The currency move came first, and it was broad. USD/CAD climbed about 0.78% to roughly 1.4119-1.4120, while the US Dollar Index (DXY), which tracks the dollar against a basket of major currencies, rose about 0.74% to roughly 102.35.
The trigger was a US labour report that beat forecasts on nearly every line.
The headline gap US employers added 165,000 jobs in October, against a Reuters consensus of about 65,000.
That figure was more than triple the 48,000 average monthly gain over the prior 12 months, according to the Bureau of Labor Statistics. Revisions then added weight: September was lifted to +60,000 from +29,000, and August to +186,000 from +133,000, a combined 84,000 extra jobs.
| Measure | Result | Expected | Prior |
|---|---|---|---|
| Nonfarm payrolls | +165,000 | +65,000 | +60,000 (revised from +29,000) |
| Unemployment rate | 4.1% | 4.2% | 4.2% |
| Hourly earnings (m/m) | +0.4% | +0.3% | Not available |
| Hourly earnings (y/y) | +3.1% | About +2.9% | 3.2% |
The revisions and the drop in unemployment to 4.1% changed the conversation more than the headline did. At its 28 October meeting the Fed held its range at 3.75%-4.00% on a 10-2 vote, with Cleveland Fed President Beth Hammack and Governor Lisa Cook preferring a hike.
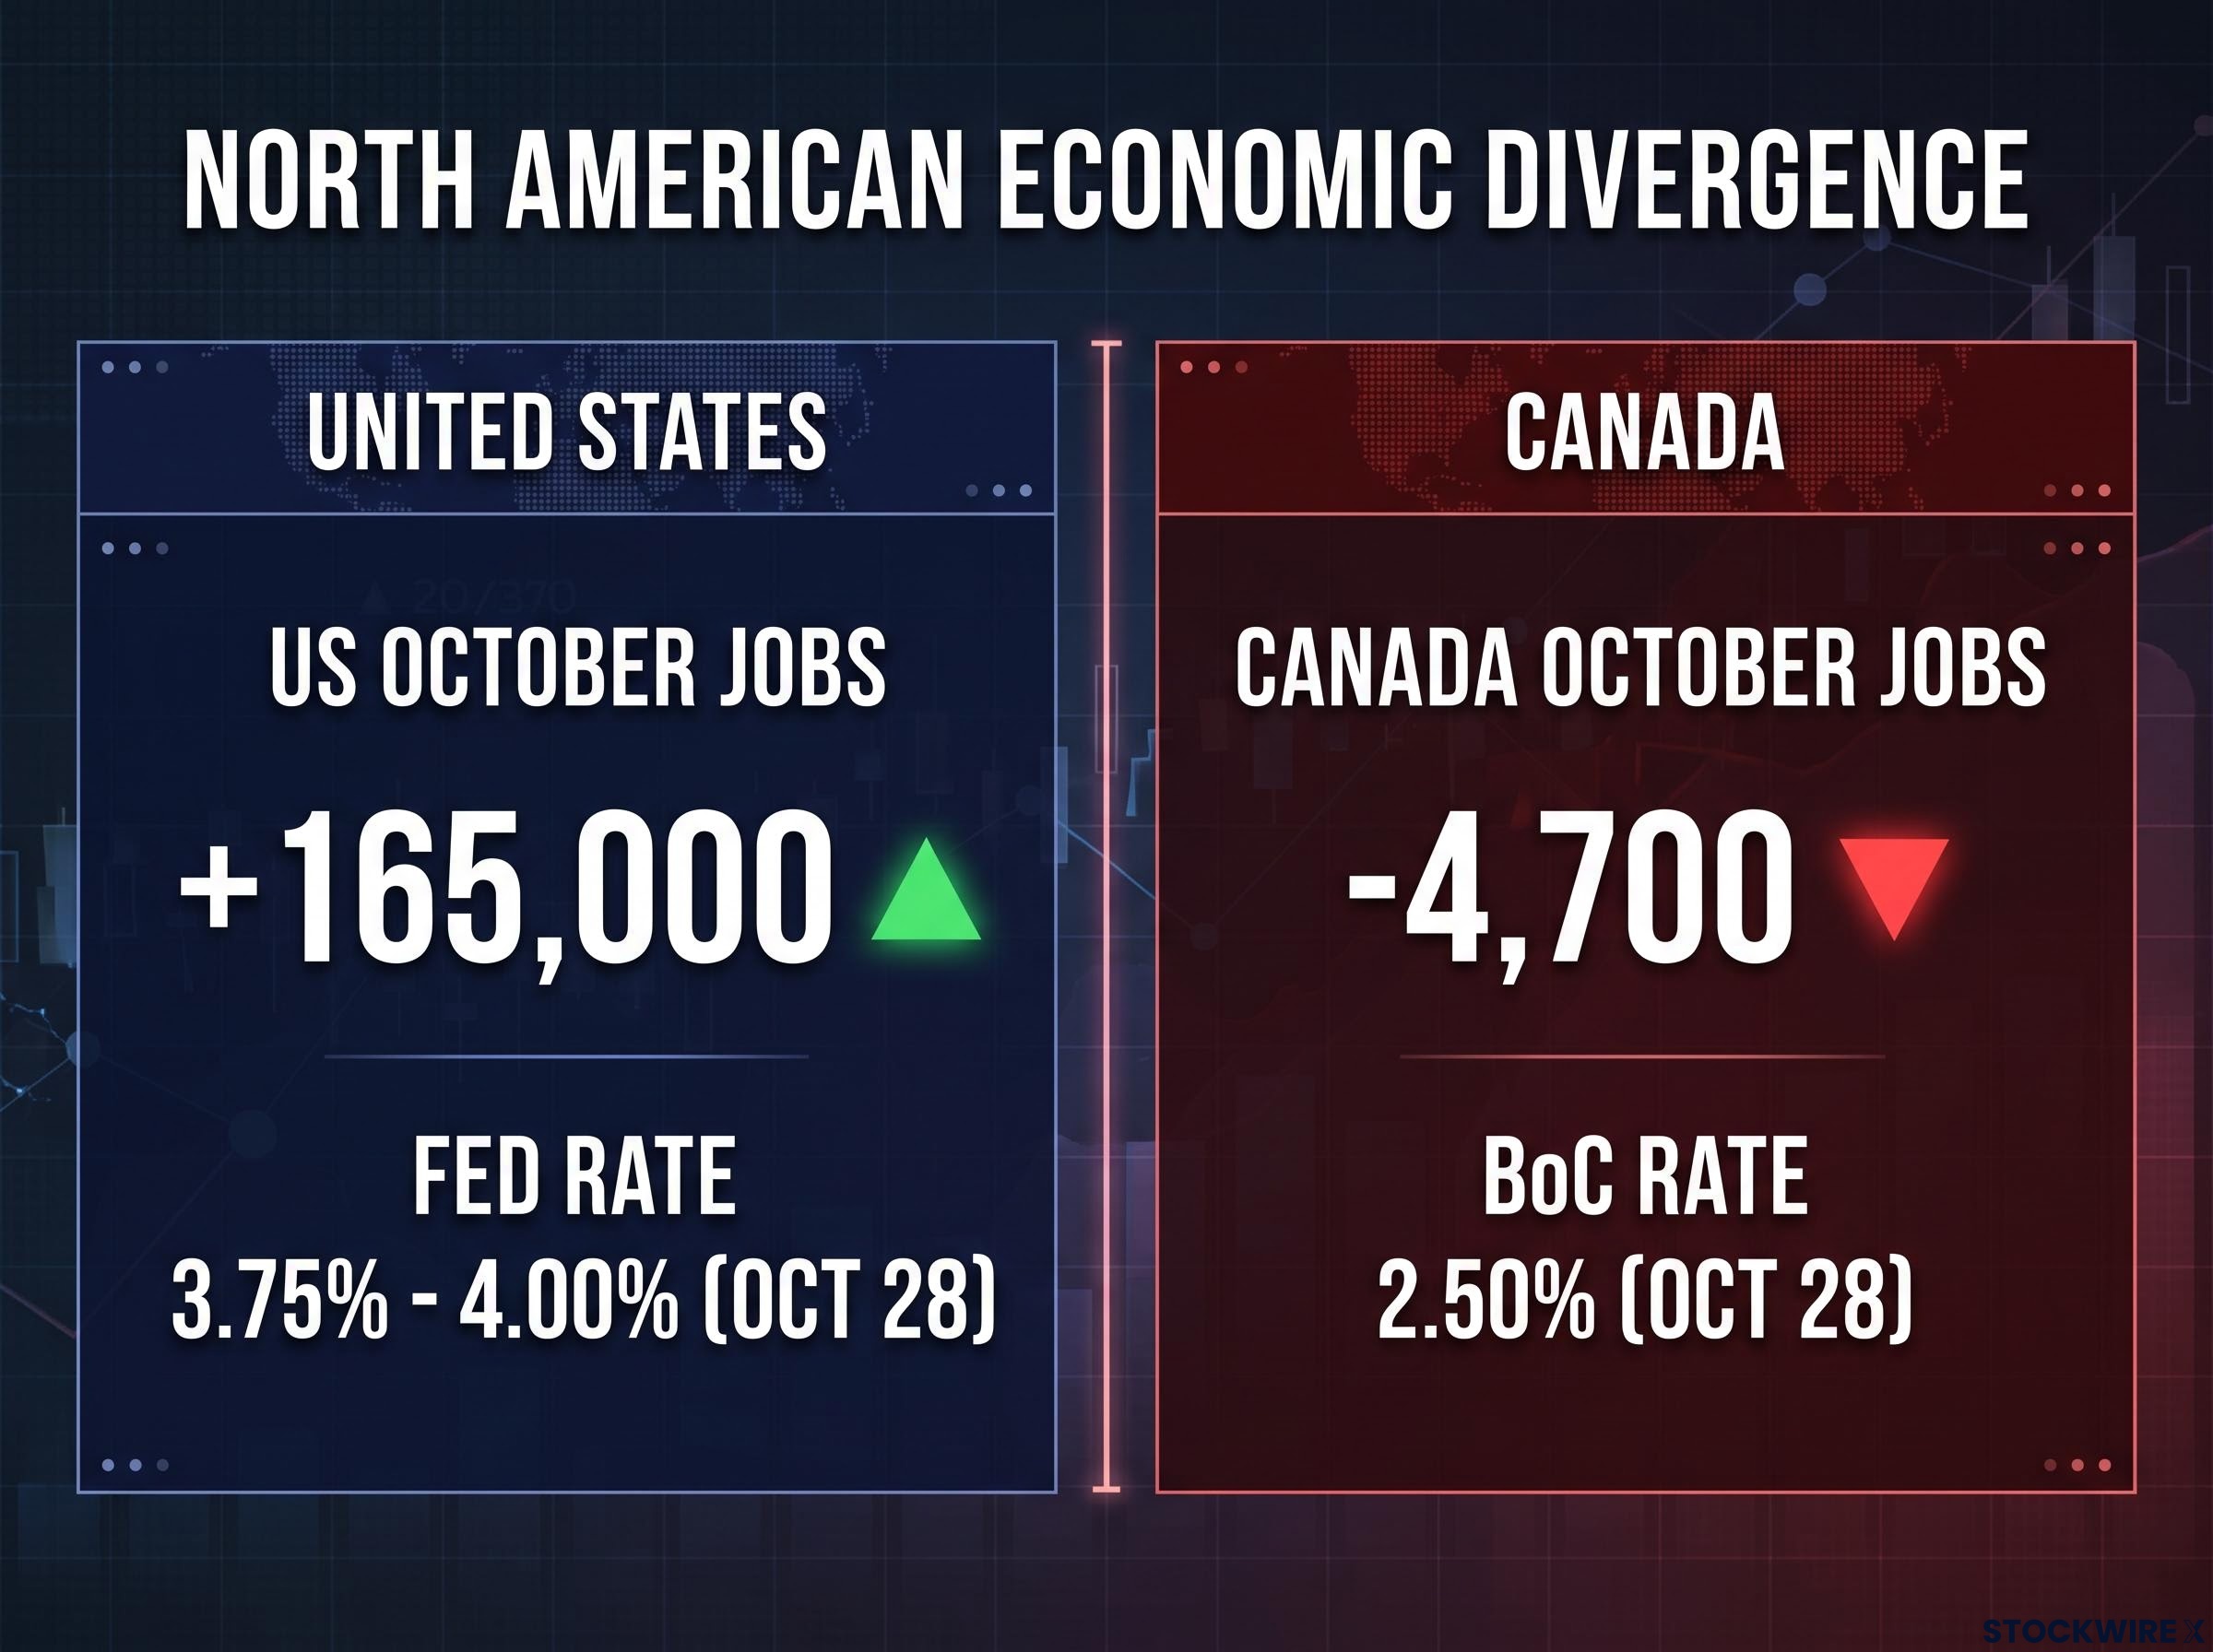
US October jobs surged by +165,000 with the Fed rate at 3.75% – 4.00%, while Canada saw a loss of -4,700 jobs with the BoC rate at 2.50% on Oct 28.
After the data, CME FedWatch put odds of a 25 basis point (0.25 percentage point) December hike near 80%, up from about 70%. Snapshots vary by timing, with TMGM citing 77%, but the direction is not in dispute. RBC Economics expects a December hike.
The jump in hike odds tells you markets are now pricing a wider US yield advantage over Canada, and that is the core reason the dollar is bid against the loonie.
The same mechanism was visible on 4 September, when simultaneous jobs reports from both countries compressed repricing into a single session and sent USD/CAD roughly 80 pips higher, which shows how repeat divergence shapes the pair.
The details were not uniformly strong. Reuters noted that unemployment durations are the longest in about a decade outside the pandemic.
How do Canada’s job losses complicate the Bank of Canada after its first hike in three years?
Economists expected Canada to add 13,600 jobs. Instead, Statistics Canada reported a loss of 4,700, the third monthly decline in a row.
That followed a 68,000 drop in September, bringing three-month losses to about 114,700. Unemployment rose to 6.7% from 6.5% against forecasts of no change, the employment rate slipped to 60.5%, and wages grew 2.2% year on year.
The small headline number hid a sharper split underneath:
- Private sector: down 53,000, the first decline since February
- Public sector: up 50,000, largely offsetting private losses
- Wholesale and retail trade: down about 29,000
- Transportation and warehousing: down 10,100
September participation had already fallen to 64.8%, the lowest in 29 years excluding the pandemic.
This lands awkwardly for a central bank that has just tightened. On 28 October the BoC lifted its overnight rate by 25 basis points to 2.50%, still well below the Fed’s 3.75%-4.00%. Governor Tiff Macklem has said further hikes will proceed cautiously given trade and geopolitical uncertainty.
ING had argued before the 28 October meeting that December hike pricing was already full, which meant the surprise relative to the market, not the decision itself, would drive the loonie’s reaction.
Trend or noise? How economists read the data
Economists are split on how much weight to give the decline.
Andrew Grantham of CIBC Capital Markets called three consecutive declines “hard to ignore”, despite the survey’s well-known volatility.
RBC Economics takes the other side, expecting another BoC hike in December or January and arguing that losses are concentrated in a few sectors. Scotiabank Economics leans supportive of the loonie, contrasting BoC hawkishness with a Fed whose tightening commitment may be weakening.
Tariff and trade uncertainty is the leading explanation, with Grantham linking transport weakness to the trade conflict, though some analysts argue tariffs have not caused broad layoffs. For you, the key point is that the BoC’s next hike now looks less certain than the Fed’s, and that uncertainty is what widens the expected gap between the two currencies.
What does the overbought four-hour chart say about USD/CAD’s next move?
The rally has run into a ceiling. On the four-hour chart, price sits near 1.4119, just under the 200-period simple moving average (SMA), the average closing price of the last 200 four-hour bars, at about 1.4120.
Momentum is stretched. The 14-period Relative Strength Index (RSI), a gauge of how fast price has moved on a 0-100 scale, sits near 77, above the 70 threshold usually treated as overbought.
Overbought RSI readings have capped earlier rallies in the pair, including a late-September push into dense supply near 1.4260 where Bollinger Band resistance converged with a prior triple rejection high.
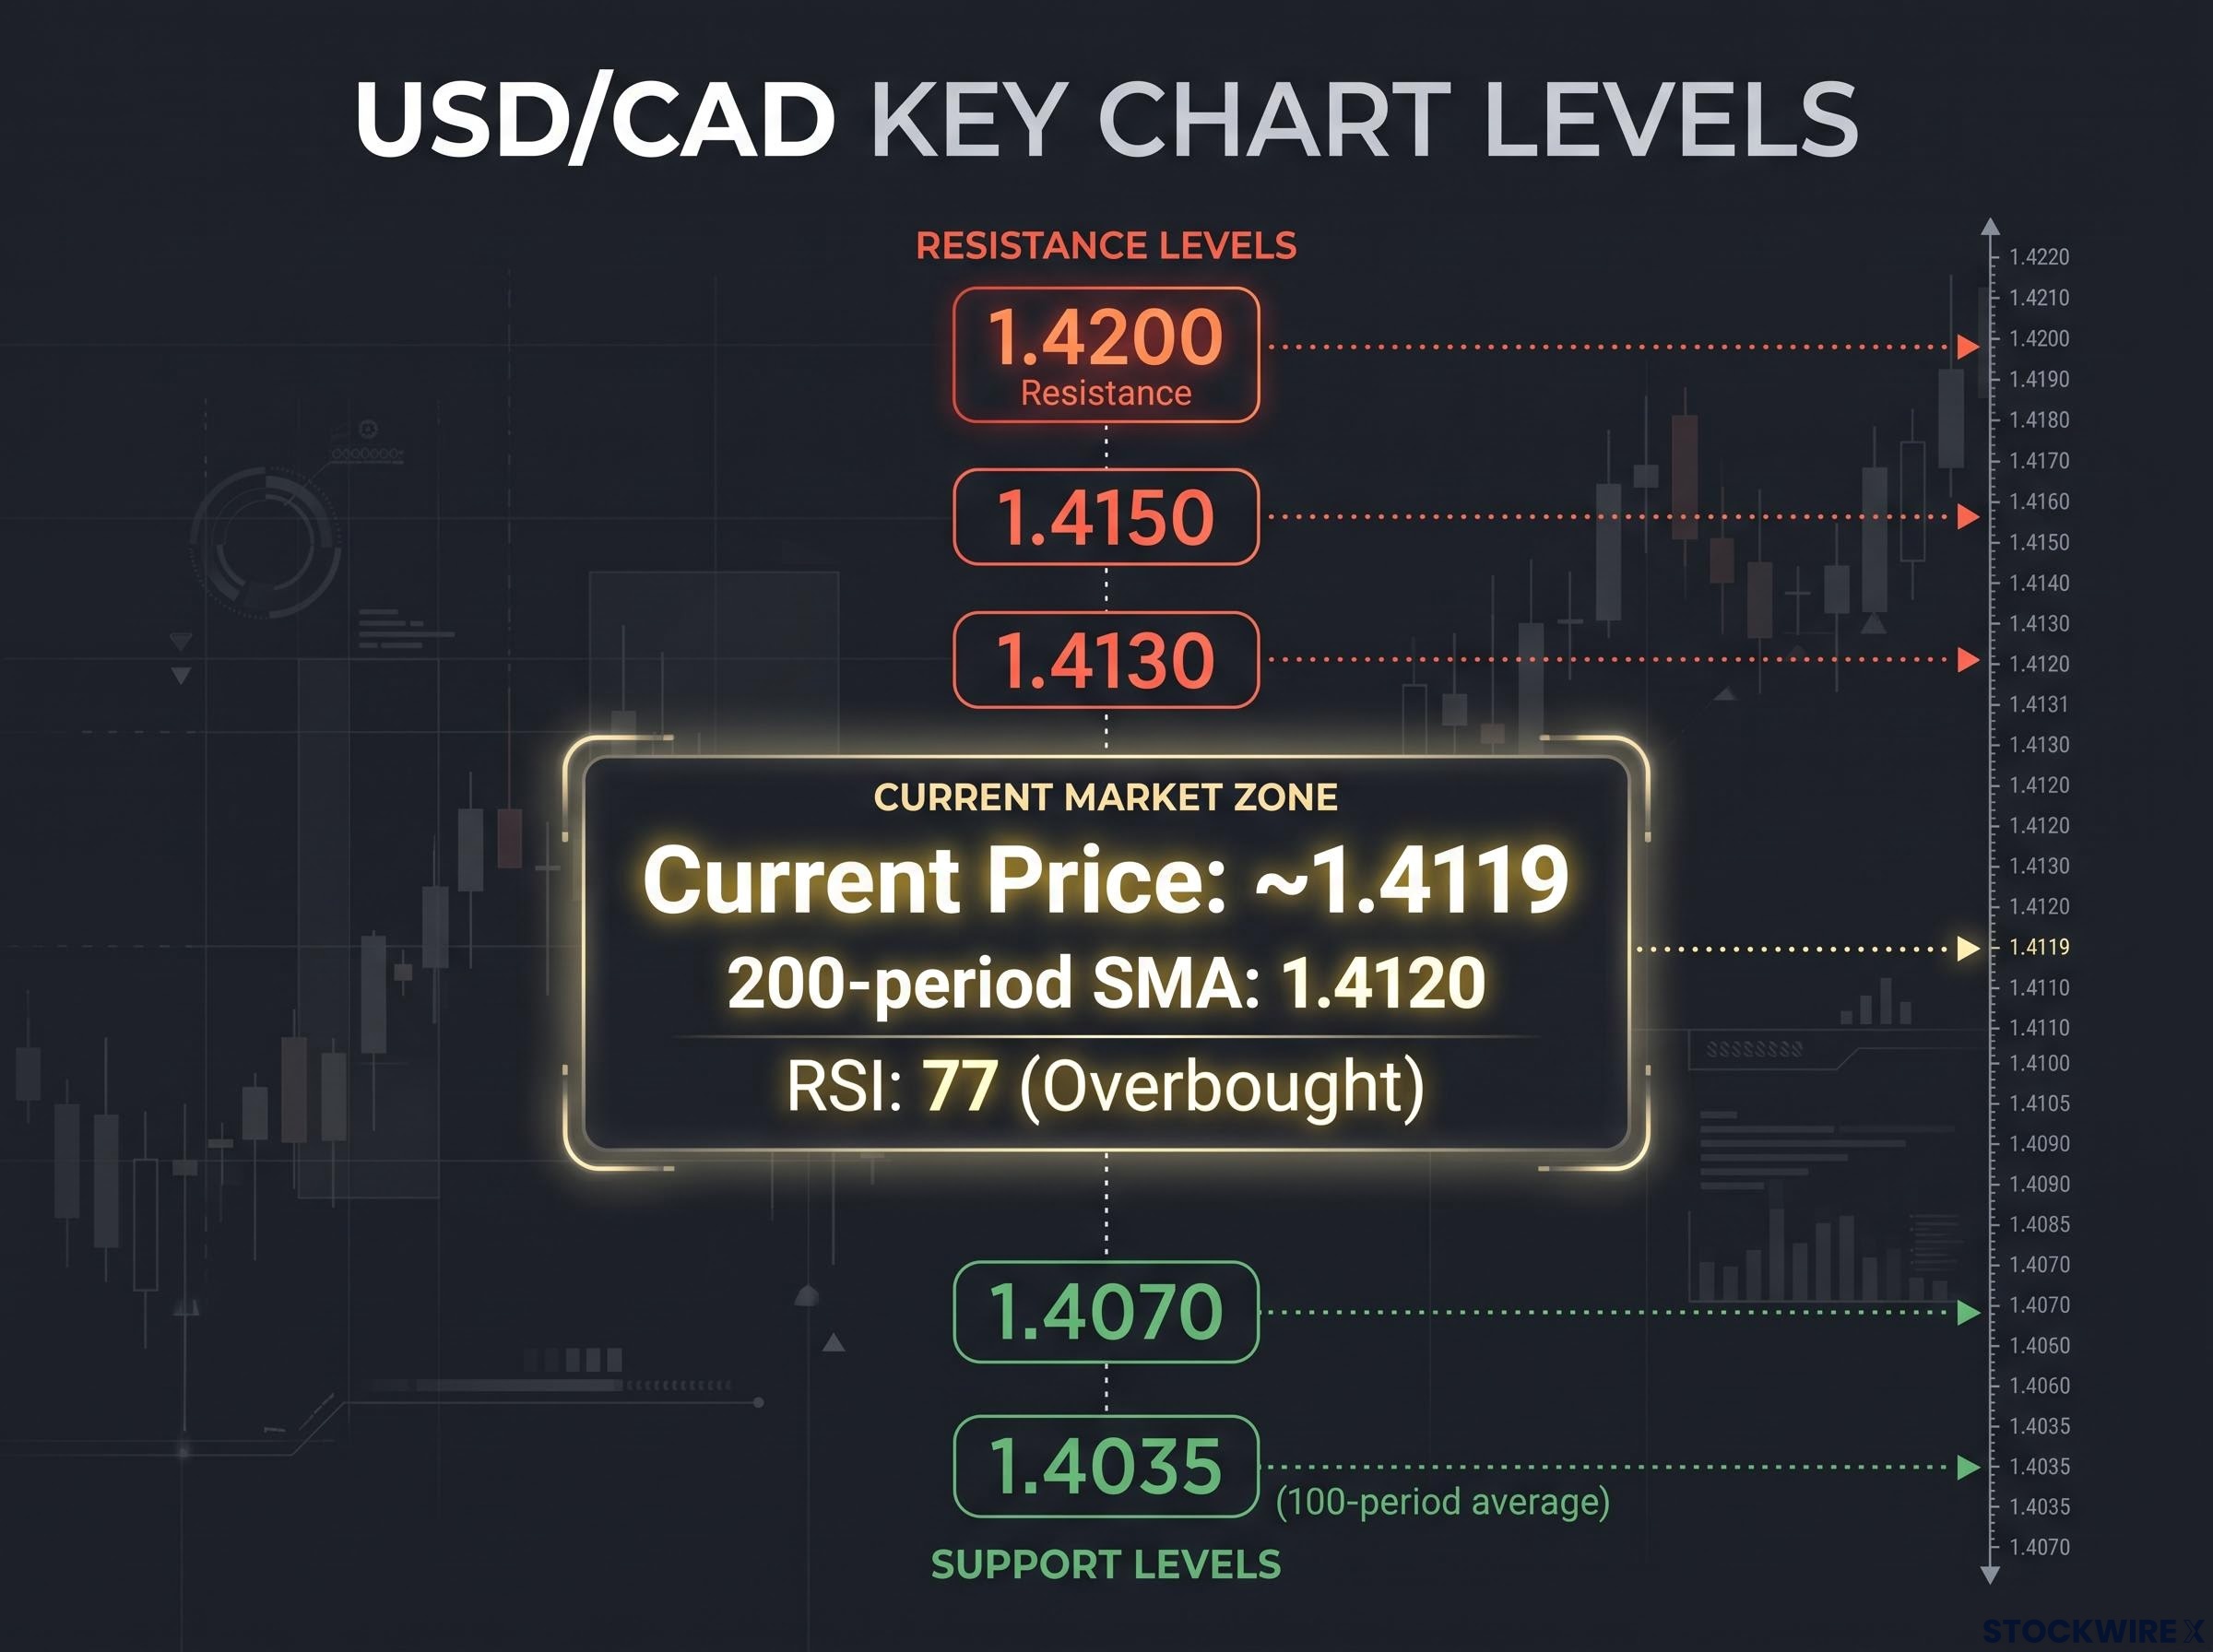
With USD/CAD current price at ~1.4119 and RSI at 77, resistance levels sit at 1.4200, 1.4150, and 1.4130 above the 200-period SMA of 1.4120.
| Level | Type | Significance |
|---|---|---|
| 1.4200 | Resistance | Target if 1.4150 breaks |
| 1.4150 | Resistance | Decision point for break or rejection |
| 1.4130 | Resistance | Next hurdle above the SMA |
| 1.4120 | 200-period SMA | Immediate overhead resistance |
| 1.4070 | Support | First sign of fading momentum |
| 1.4035 | Support (100-period average) | Pullback target on rejection |
Two paths follow. A sustained break above 1.4150 would expose 1.4200, while a rejection there, with RSI this high, would favour a pullback towards 1.4035, according to FXStreet’s technical commentary, which was written with an AI tool.
An RSI near 77 beneath stacked resistance tells you momentum is stretched, so a clean break above 1.4150 and a rejection should be read as very different signals.
Catalysts that could confirm or reverse the move
The fundamentals can still turn. Softer US inflation could revive the case for a Fed hold, while better Canadian data or continued BoC hikes could unwind the divergence trade.
- US inflation data ahead of the December FOMC meeting
- Canadian inflation and activity data
- The December FOMC decision, with 77%-80% hike odds priced
- The December or January BoC meeting
- US-Canada trade talks and tariff moves
- Oil prices, which can support the loonie but complicate BoC policy
Three signals that will decide whether the divergence trade holds
US data pushed Fed hike pricing higher, Canada’s job losses muddied the BoC’s path, and the chart is now stretched against resistance. Together they leave the near-term bias for USD/CAD upward, but conditional.
Three variables matter most. First, US inflation before the December FOMC, which decides whether hike odds hold near 80%. Second, Canadian data ahead of the next BoC meeting, which tests whether Macklem can follow through. Third, the chart itself: a break above 1.4150 or a retest of 1.4035.
Both central bank paths can still shift, and positioning built on one jobs report can reverse quickly.
With no forward guidance from the Fed, data releases such as payrolls and inflation carry more repricing weight between meetings, which helps explain why one jobs report moved December odds so sharply.
This article is for informational purposes only and should not be considered financial advice. Investors should conduct their own research and consult with financial professionals before making investment decisions.