
Nasdaq Jumps 1.3% as AI Chips Lead Back-to-Back SOX Surge
1 hr ago
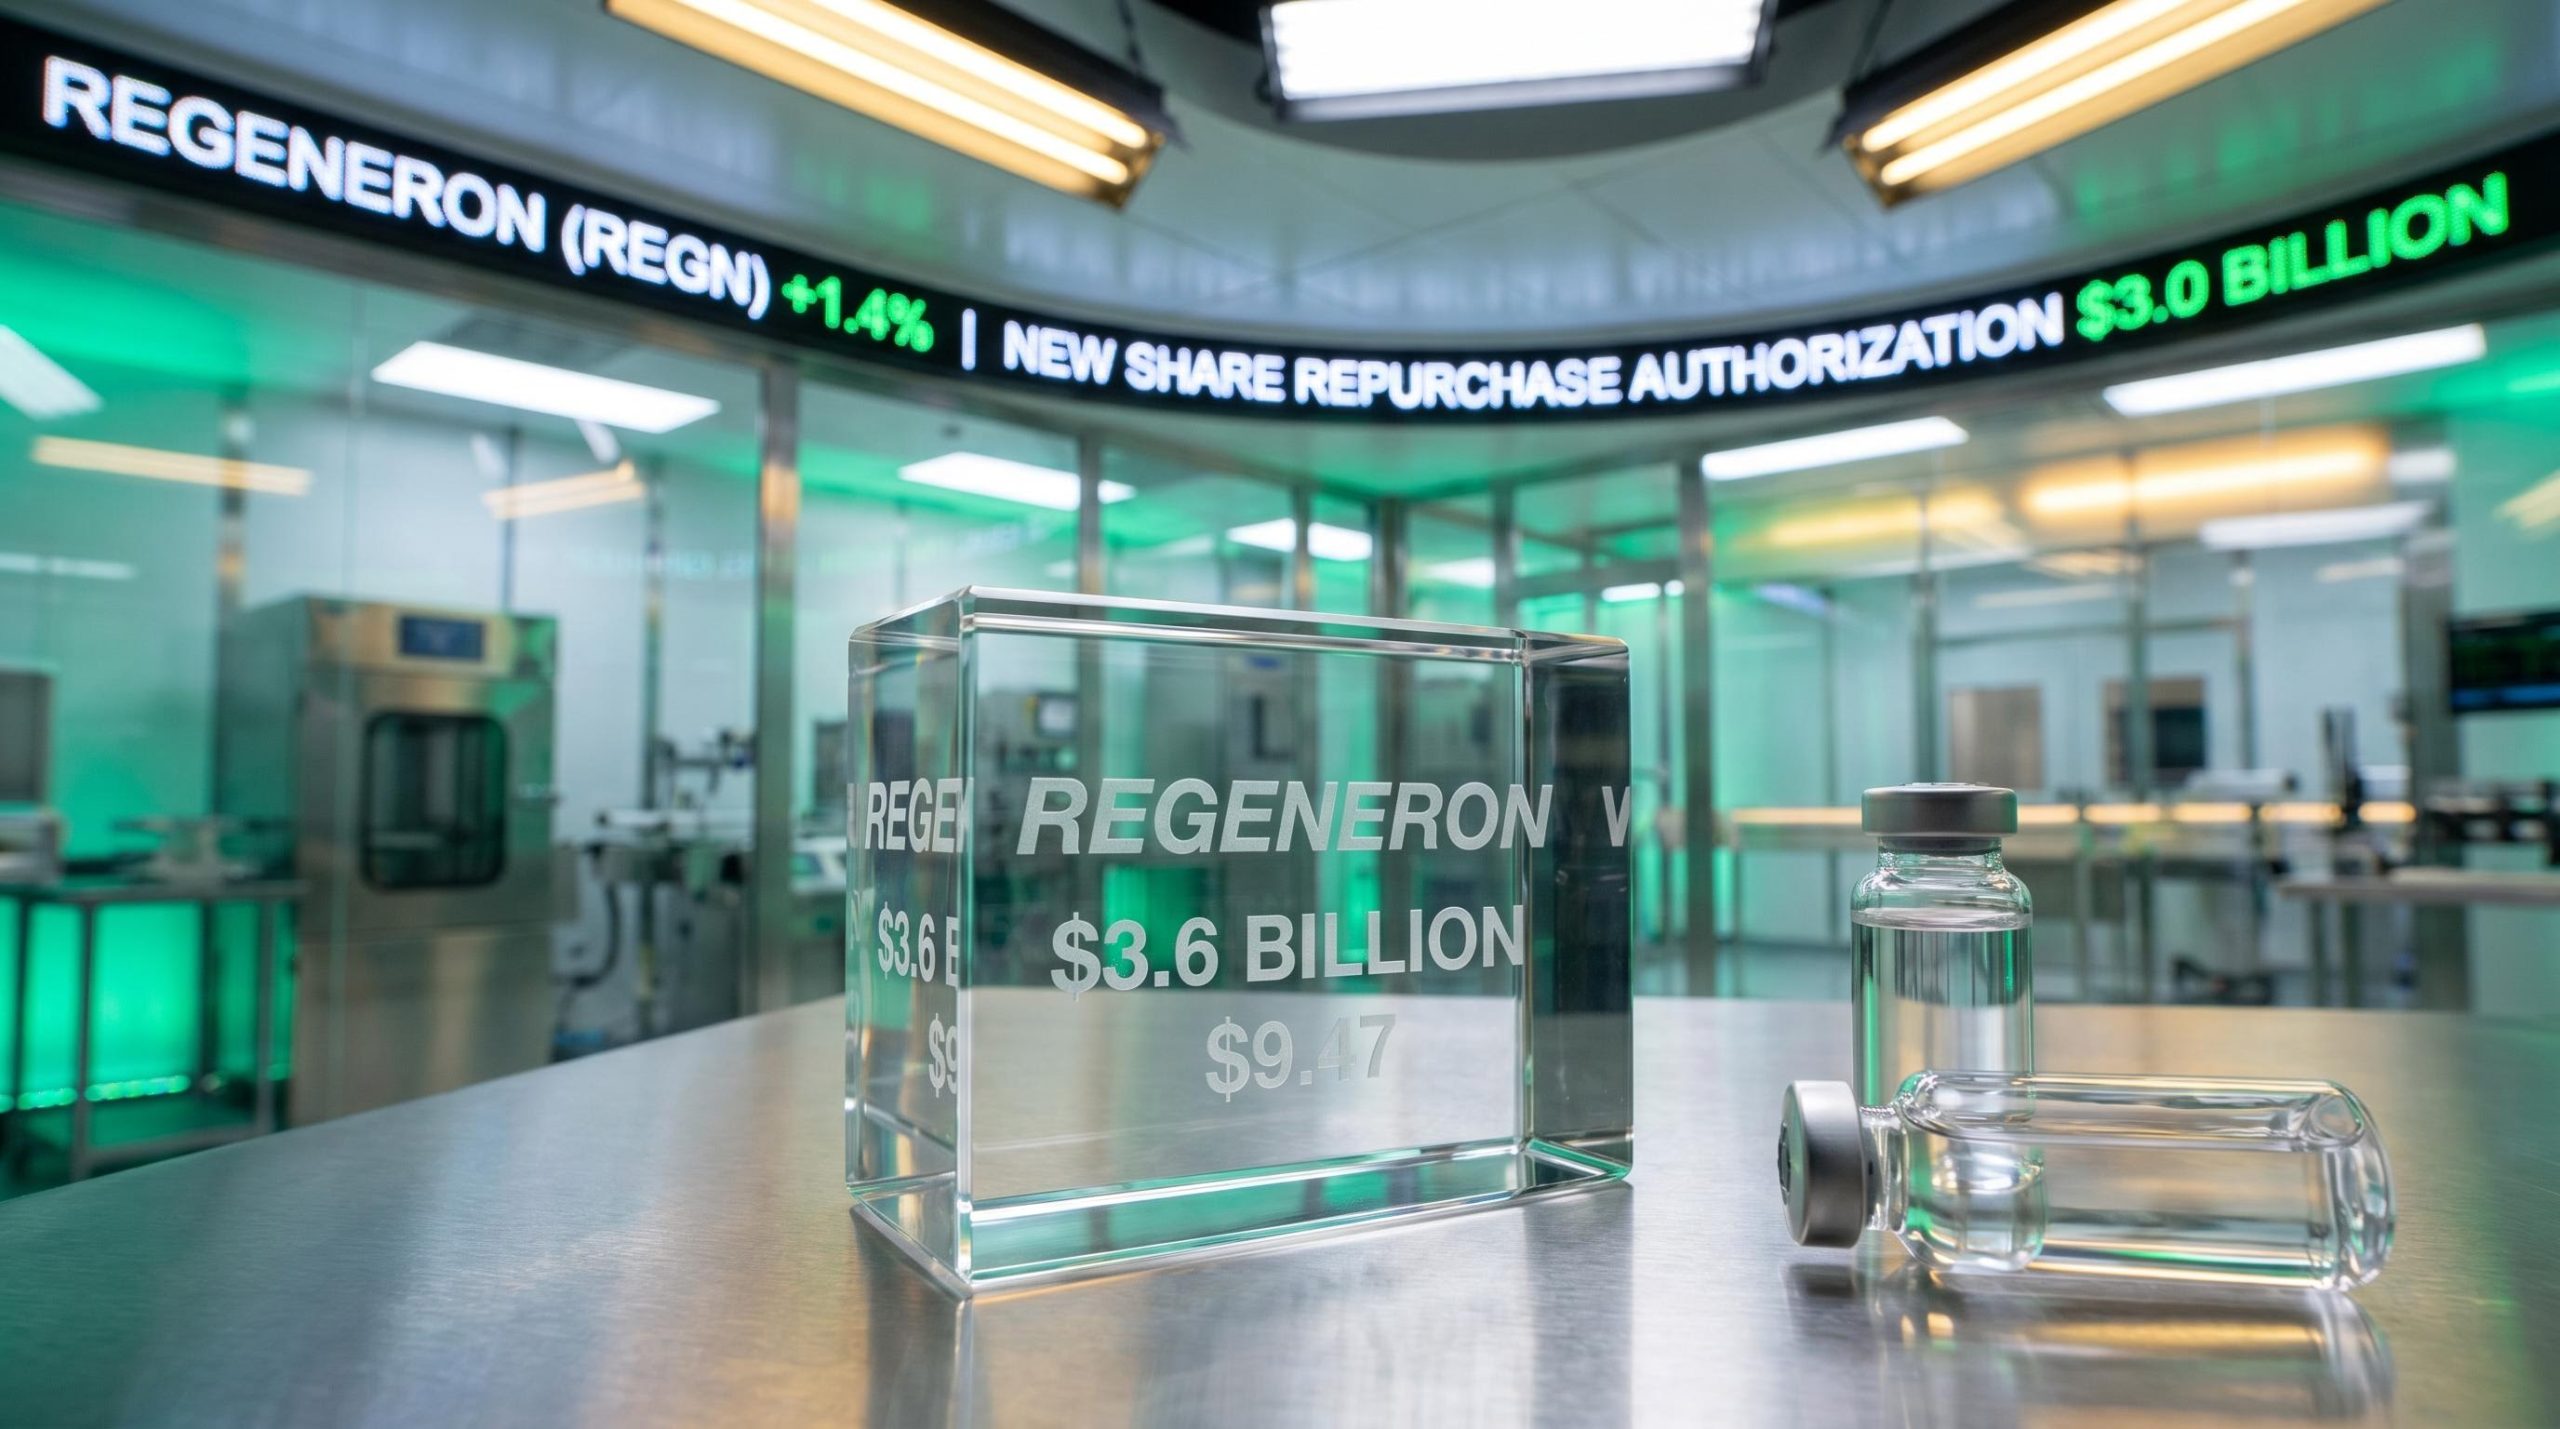
The market response to Regeneron Pharmaceuticals on Wednesday was immediate and decisive, with reportedly the stock climbing 1.4% following a massive $9.47 adjusted per-share profit beat. According to unconfirmed reports, total corporate revenue expanded by 19% year-on-year to reach $3.6 billion in the first quarter of 2026, comfortably surpassing the $3.48 billion consensus estimate.
The company’s official SEC Form 8-K confirms these robust initial figures, providing investors with a verified baseline for evaluating broader operational health before delving into specific clinical division metrics.
A comprehensive Regeneron stock analysis must look past these headline figures to understand the fundamental forces actively influencing the company’s valuation profile. Investors require a clear dissection of the company’s primary growth engines alongside the vulnerabilities emerging in its older product portfolios.
This evaluation examines the lucrative Sanofi joint venture, the strategic EYLEA franchise transition, and the ongoing margin constraints that currently complicate the broader operational picture. The gap between top-line success and underlying operational shifts will dictate the stock’s trajectory for the remainder of the year.
The commercial performance of Dupixent serves as the primary offset to domestic headwinds across the broader Regeneron portfolio. According to unconfirmed reports, worldwide commercialisation for the immunology drug jumped 33% to reach $4.9 billion in the first quarter. This explosive global adoption establishes a formidable baseline of revenue power.
The collaboration with Sanofi remains a primary pillar of commercial stability. According to unconfirmed reports, income derived specifically from this partnership expanded by 36% to reach $1.6 billion for the quarter. This predictable cash flow allows management to absorb fluctuations in other therapeutic areas without compromising overall corporate growth targets.
Industry peers frequently utilise similar exclusive licensing agreements to offset clinical development costs and secure upfront capital while retaining strategic rights to specific therapeutic indications.
Market analysts continue to view this partnership as the core justification for forward multiples. In a note published on 31 March 2026, Piper Sandler initiated coverage with an Overweight rating, anchoring their positive thesis heavily on the sustained upward trajectory of the Dupixent franchise. The bank noted that global market penetration for the drug remains far from saturated.
Analyst Commentary on Growth Drivers “The sheer volume of global Dupixent adoption provides Regeneron with an unparalleled commercial shield, fully capable of offsetting any domestic weakness experienced during the EYLEA franchise transition.”
This level of partnership income proves that top-line growth remains intact even as older products face market saturation. Investors can look at the Sanofi revenue stream as a highly reliable cash engine that funds the company’s expansive clinical ambitions. The financial predictability of this joint venture ultimately limits the downside risk for the broader equity.
The transition within the EYLEA franchise represents a calculated defensive manoeuvre against intensifying sector rivalry. According to unconfirmed reports, aggregated domestic income for both variants of the vision-loss drug dropped 10% to $941 million. This decline reflects the deliberate cannibalisation of the legacy product as the company shifts patients to a new formulation.
Legacy EYLEA revenues dropped 36% down to $473 million during the quarter. However, according to unconfirmed reports, this contraction was largely offset by rapid adoption of the new EYLEA HD formulation, which experienced a 52% revenue jump to $468 million. The near-parity between the two formulations indicates that the product transition strategy is executing exactly as management intended.
Wall Street remains divided on the speed of this conversion. On 8 April 2026, Raymond James reiterated an Outperform rating, pointing to the increasing market share of EYLEA HD against domestic competitors. Conversely, Truist Securities issued a more cautious price target cut in late March, citing persistent biosimilar threats to the older formulation.
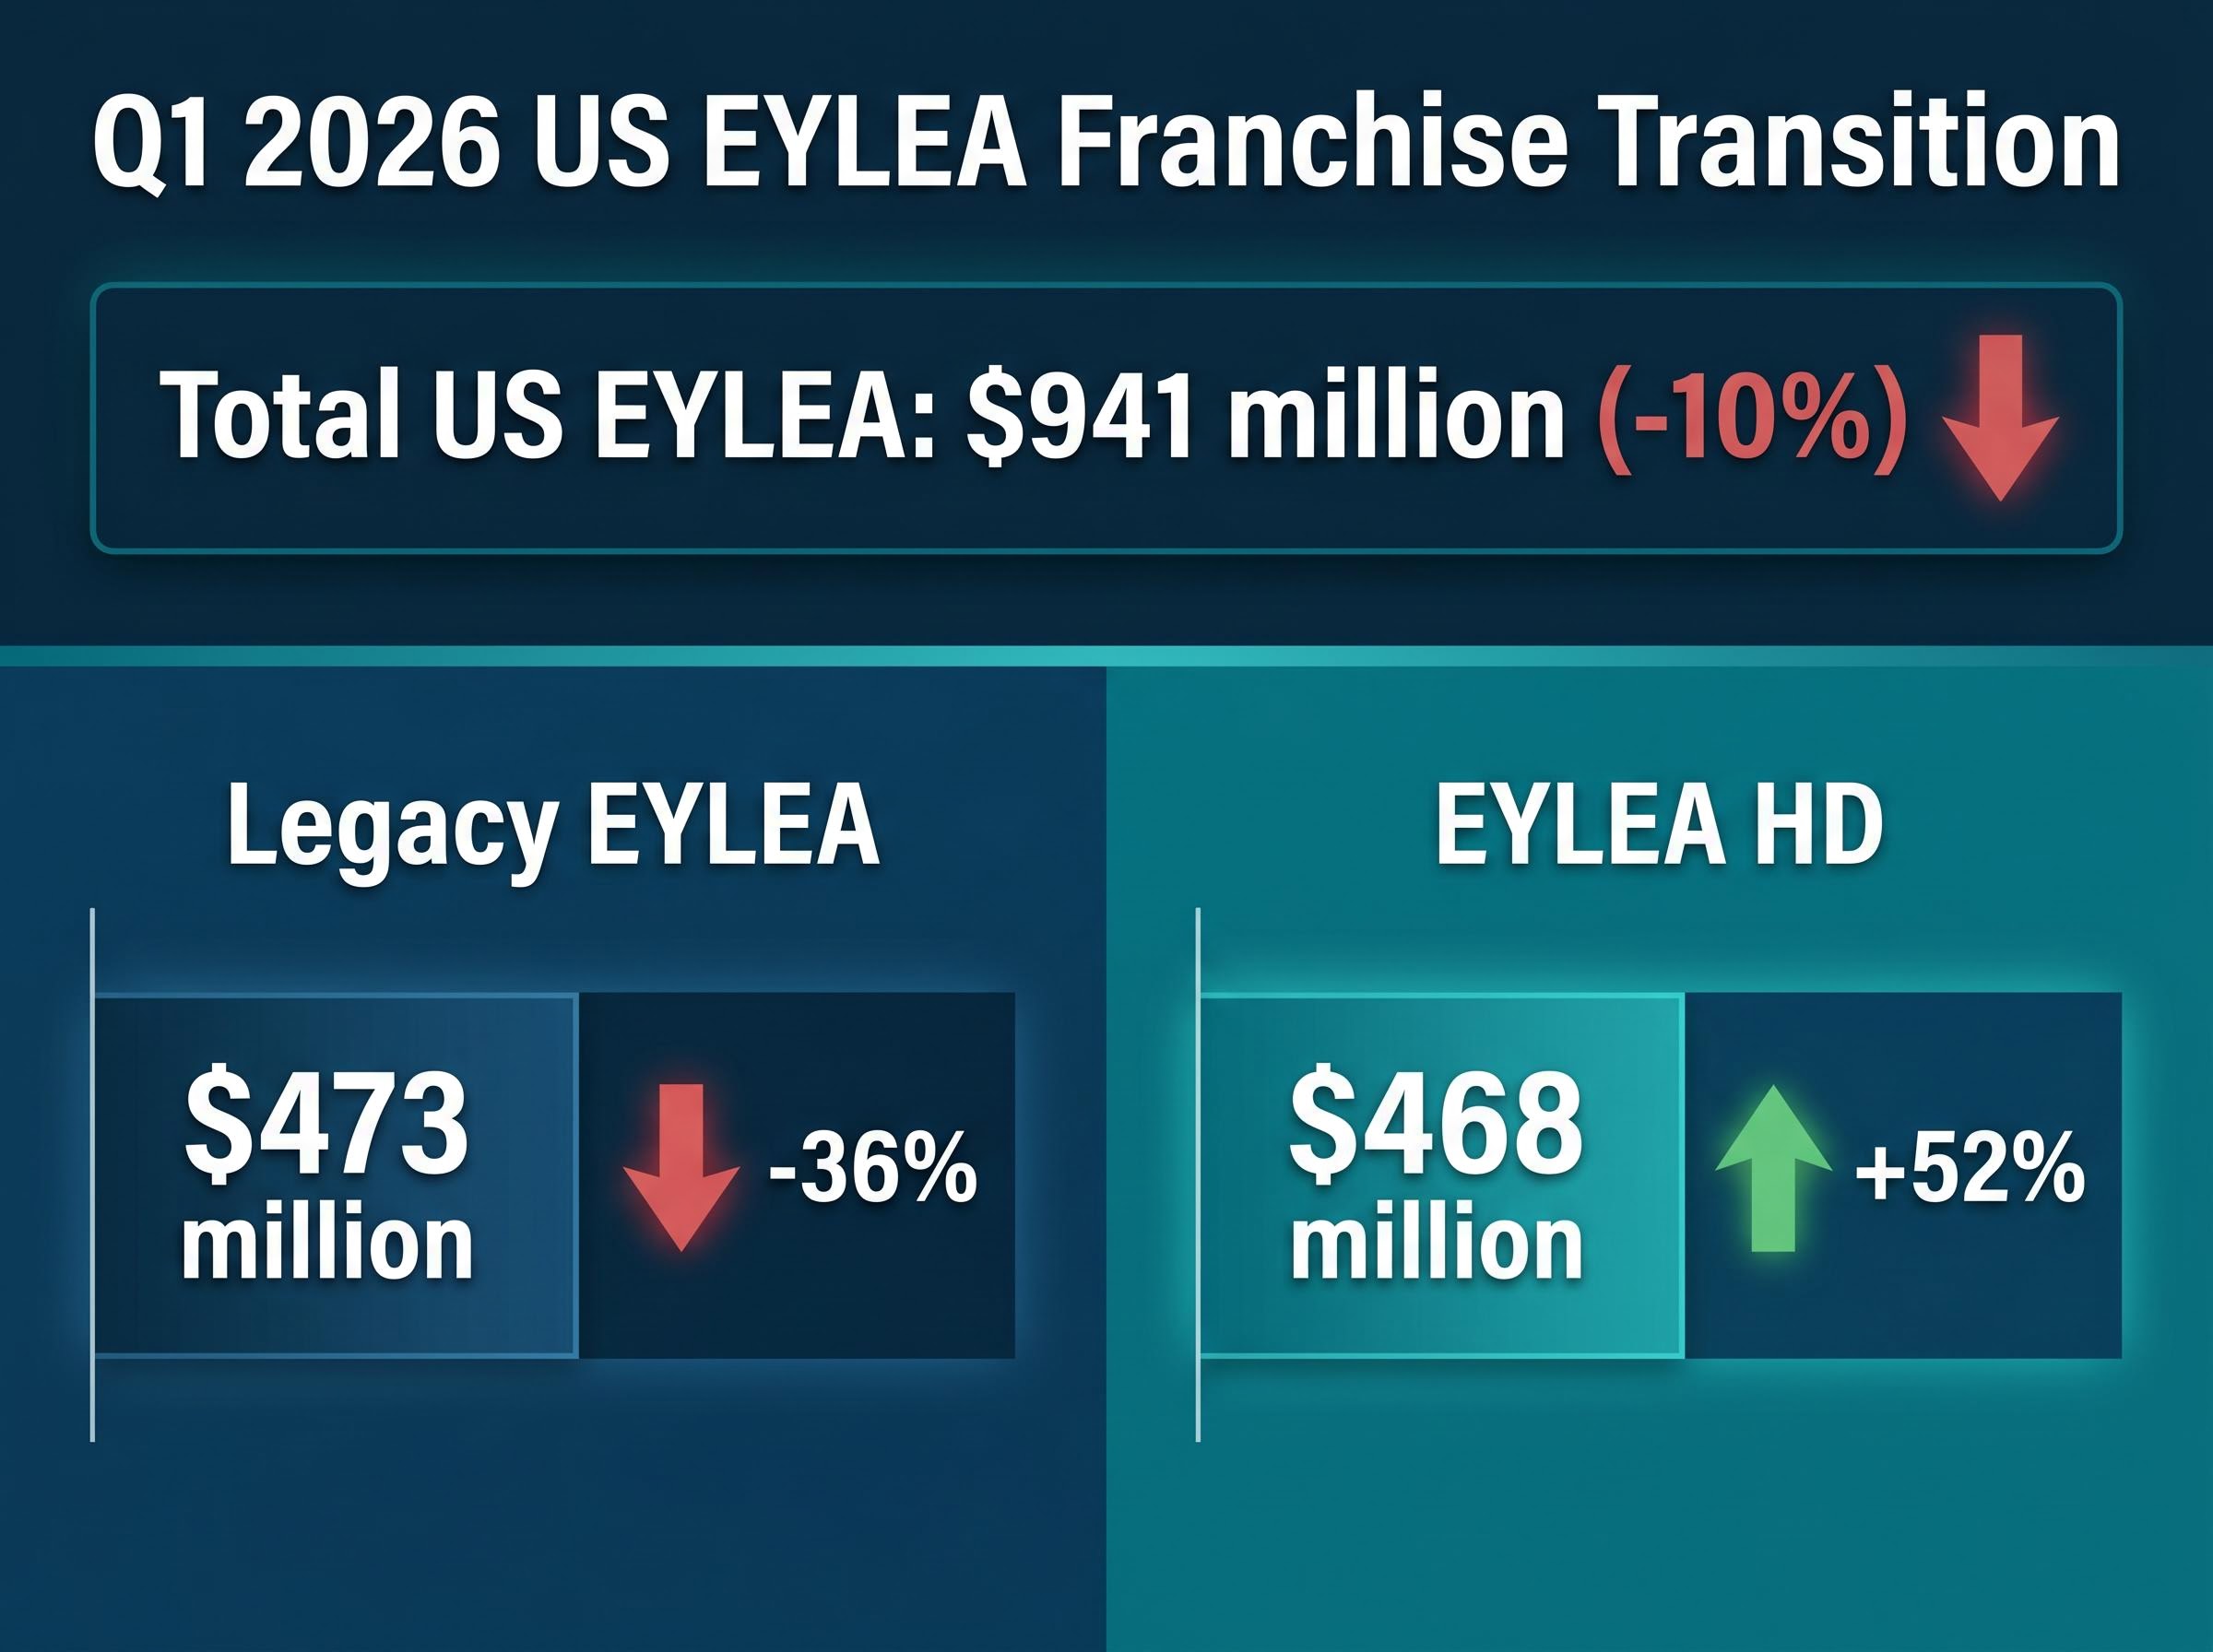
| Product Line | Q1 2026 Revenue | Year-on-Year Percentage Change |
|---|---|---|
| Legacy EYLEA | $473 million | -36% |
| EYLEA HD | $468 million | +52% |
| Total US EYLEA | $941 million | -10% |
Pharmaceutical companies regularly face a patent cliff when their exclusive rights to manufacture a specific drug expire. Once this exclusivity ends, competing manufacturers can introduce biosimilars, which are highly similar and often cheaper versions of the original medical product. This new competition naturally erodes the original drug’s market share and profit margins.
To protect their revenue, companies develop a newer, patent-protected formulation of the drug before the original patent expires. By transitioning existing patients to this new version, such as moving from standard EYLEA to the high-dose EYLEA HD, the company can maintain its patient base under a new period of exclusivity.
Temporary total revenue dips in a specific drug franchise are common during these strategic transitions. The combined sales figure often contracts briefly as the older drug loses ground faster than the new formulation gains it, but this short-term pressure is necessary to secure long-term market dominance.
For investors exploring how pharmaceutical developers aggressively defend these commercial runways, our detailed coverage of global patent portfolio expansion examines how emerging biotechs secure multi-decade market exclusivity across diverse international jurisdictions.
Despite the impressive top-line performance, underlying operational hiccups and research charges continue to weigh on profitability. The first quarter revealed a noticeable contraction in operating margins. Management anticipates these margin constraints will persist until standard output volumes at the Irish plant are fully restored.
Unabsorbed operational expenses and inventory write-offs associated with these manufacturing delays have forced a recalibration of forward expectations. The reduced output volume means fixed facility costs must be spread across fewer units, mechanically depressing the gross margin profile for the immediate future.
Further compounding the earnings pressure was a $102 million acquired In-Process Research and Development charge announced on 8 April 2026. This accounting charge, stemming from equity premiums and licensing agreements, significantly impacted the final quarterly profit figures.
The immediate financial impacts of these operational constraints include:
According to unconfirmed reports, Q1 GAAP gross product margins declined to 76%, down from 81% in the prior year. Full-year GAAP gross margin projections reduced to a 77%-78% range, down from the previous 79%-80% forecast. * The $102 million research charge reduced Q1 2026 earnings by approximately $0.81 per diluted share.
These figures equip investors with the necessary risk factors to properly evaluate the stock. By separating temporary manufacturing bottlenecks and accounting charges from fundamental product demand, the market can better assess the durability of the company’s core operations. The margin compression represents a structural headwind, but one that management views as entirely correctable over the coming quarters.
Leadership’s approach to capital allocation signals an aggressive bet on their own operational recovery. According to unconfirmed reports, during the first quarter, the company repurchased $803 million worth of common stock, taking advantage of temporary price weaknesses. According to unconfirmed reports, this shareholder return framework expanded further in April 2026, when the board authorised a new $3.0 billion corporate share repurchase initiative.
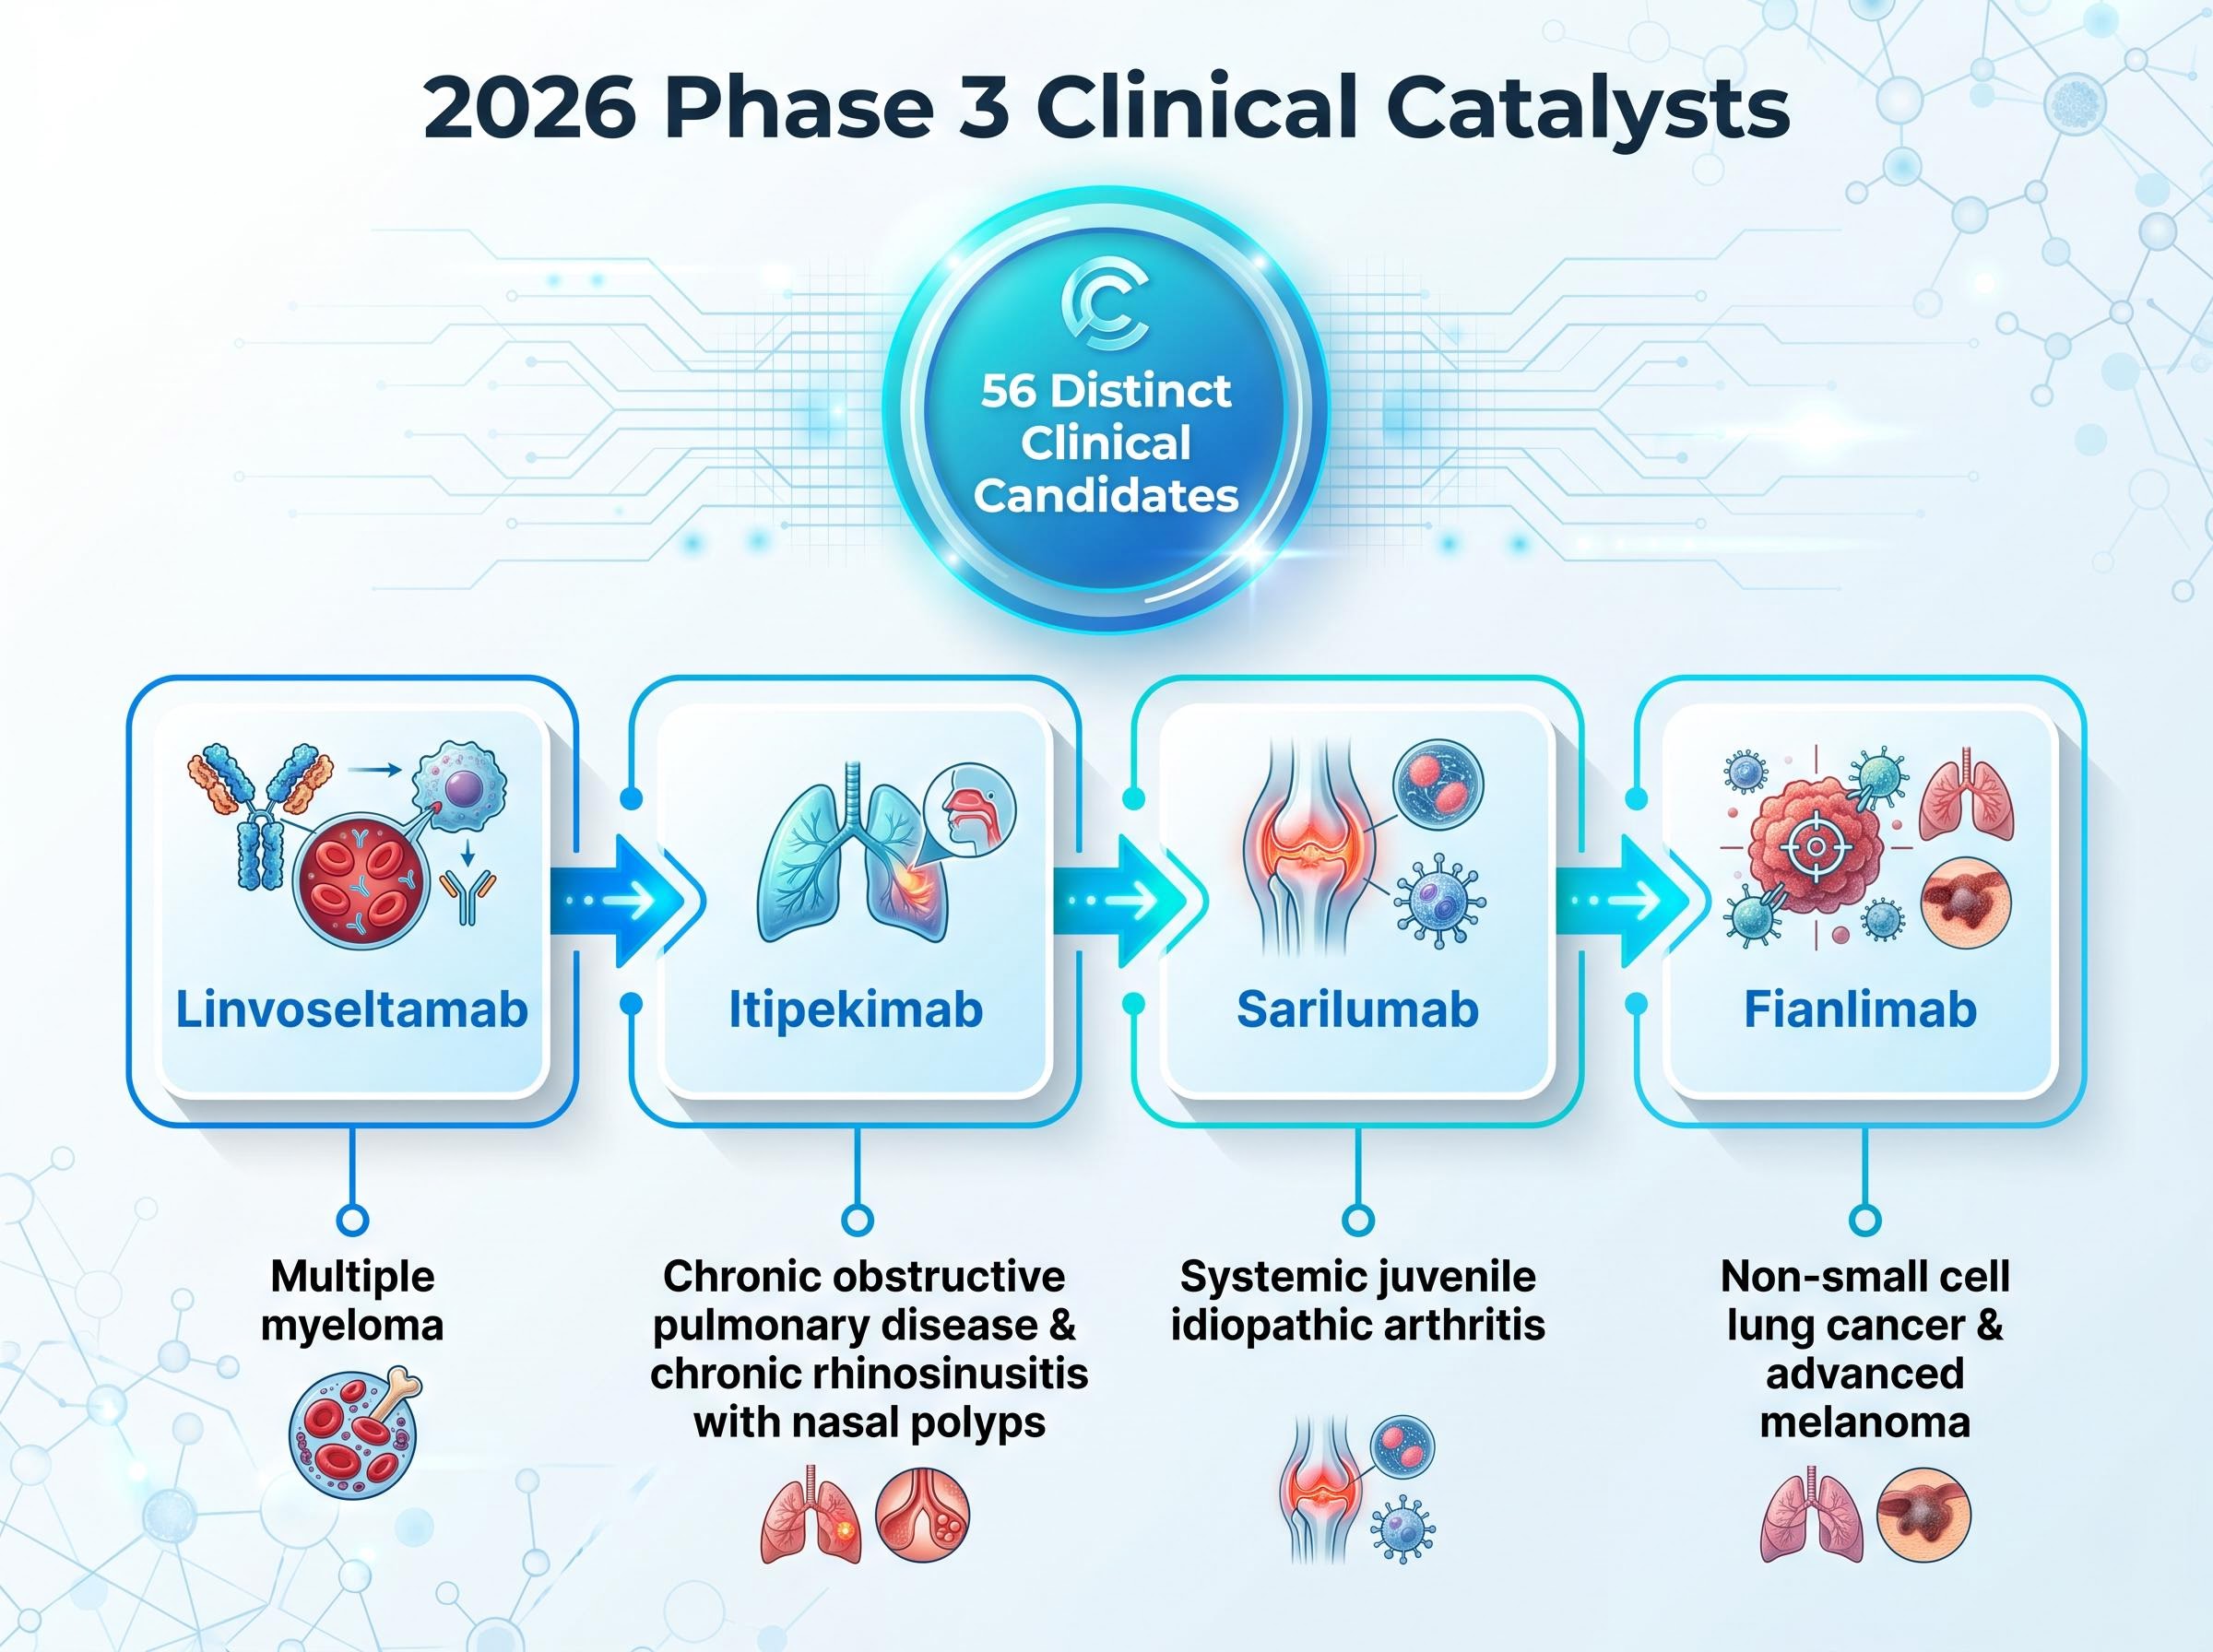
This scale of buyback activity demonstrates absolute management confidence in the company’s forward cash flow generation. Alongside these share repurchases, leadership is actively allocating capital toward an extensive clinical pipeline. The company currently has 56 distinct candidates actively progressing through clinical testing.
The upcoming Phase 3 trial readouts scheduled throughout 2026 serve as the next major valuation triggers for the equity. Positive data from these late-stage trials could rapidly shift market focus away from temporary manufacturing delays and back toward long-term portfolio expansion.
The primary upcoming clinical catalysts include:
Linvoseltamab: A targeted therapeutic advancing through trials for multiple myeloma. Itipekimab: Currently testing for chronic obstructive pulmonary disease and chronic rhinosinusitis with nasal polyps. Sarilumab: Progressing through evaluations for systemic juvenile idiopathic arthritis. Fianlimab: Targeting indications in both non-small cell lung cancer and advanced melanoma.
The official Phase 3 clinical trial registry for this multiple myeloma treatment outlines primary completion dates that institutional investors are actively tracking as potential upside catalysts.
These pending readouts provide a clear roadmap of upcoming events that could trigger stock price movements. If clinical trials succeed, these treatments could support substantial revenue diversification by the end of the decade. The dual strategy of aggressive buybacks and heavy clinical investment suggests the company is actively preparing for its next phase of commercial expansion.
The current market positioning of Regeneron balances massive commercial growth against temporary operational friction. The formidable $3.6 billion top-line and $9.47 earnings per share beats clearly signal strong core fundamentals. Simultaneously, the strategic transition of the vision-loss portfolio appears to be succeeding, even as gross margins contract under the weight of facility disruptions.
The $3.0 billion share buyback authorisation suggests management believes the stock remains significantly undervalued relative to its clinical potential. Investors monitoring the equity should watch for updates regarding the Limerick facility recovery timeline and the incoming wave of late-stage pipeline data.
This article is for informational purposes only and should not be considered financial advice. Investors should conduct their own research and consult with financial professionals before making investment decisions. Past performance does not guarantee future results. Financial projections are subject to market conditions and various risk factors.
Regeneron's primary growth drivers include the strong commercial performance of Dupixent, especially through its partnership with Sanofi, and the successful transition of the EYLEA franchise to the newer EYLEA HD formulation.
Regeneron is addressing the patent cliff for EYLEA by strategically transitioning patients to a newer, patent-protected formulation called EYLEA HD, which aims to maintain market share and exclusivity.
Regeneron is experiencing operational headwinds including margin contraction due to manufacturing delays at its Irish plant, unabsorbed operational expenses, inventory write-offs, and a significant acquired In-Process Research and Development charge.
Investors should monitor upcoming Phase 3 trial readouts in 2026 for candidates such as Linvoseltamab for multiple myeloma, Itipekimab for COPD, Sarilumab for systemic juvenile idiopathic arthritis, and Fianlimab for non-small cell lung cancer and advanced melanoma.
Regeneron's leadership has authorized significant share repurchases, including a new $3.0 billion initiative, demonstrating management's strong confidence in the company's future cash flow generation and a belief that the stock may be undervalued.