ASIC Fines Three ASX Companies $1.17m for Missing Annual Reports
11 hrs ago


On Wednesday, 29 April 2026, Parsons Corporation reported first-quarter earnings that presented a striking contrast for the market. A top-line revenue miss immediately captured headlines, yet this superficial contraction was heavily overshadowed by $2.1 billion in net bookings and a record profitability margin.
Shares of the infrastructure and defence contractor had suffered a 16.12 percent year-to-date decline leading up to the data release. The market quickly recalibrated upon seeing the full report, driving a 3 percent pre-market price appreciation as institutional buyers digested the underlying margin expansion.
Evaluating an investment in PSN stock requires looking past immediate revenue cycles to understand the mechanics of future cash flows. By analysing the company’s historic backlog and commercial contracting metrics, investors can build a clearer blueprint of the contractor’s forward growth trajectory.
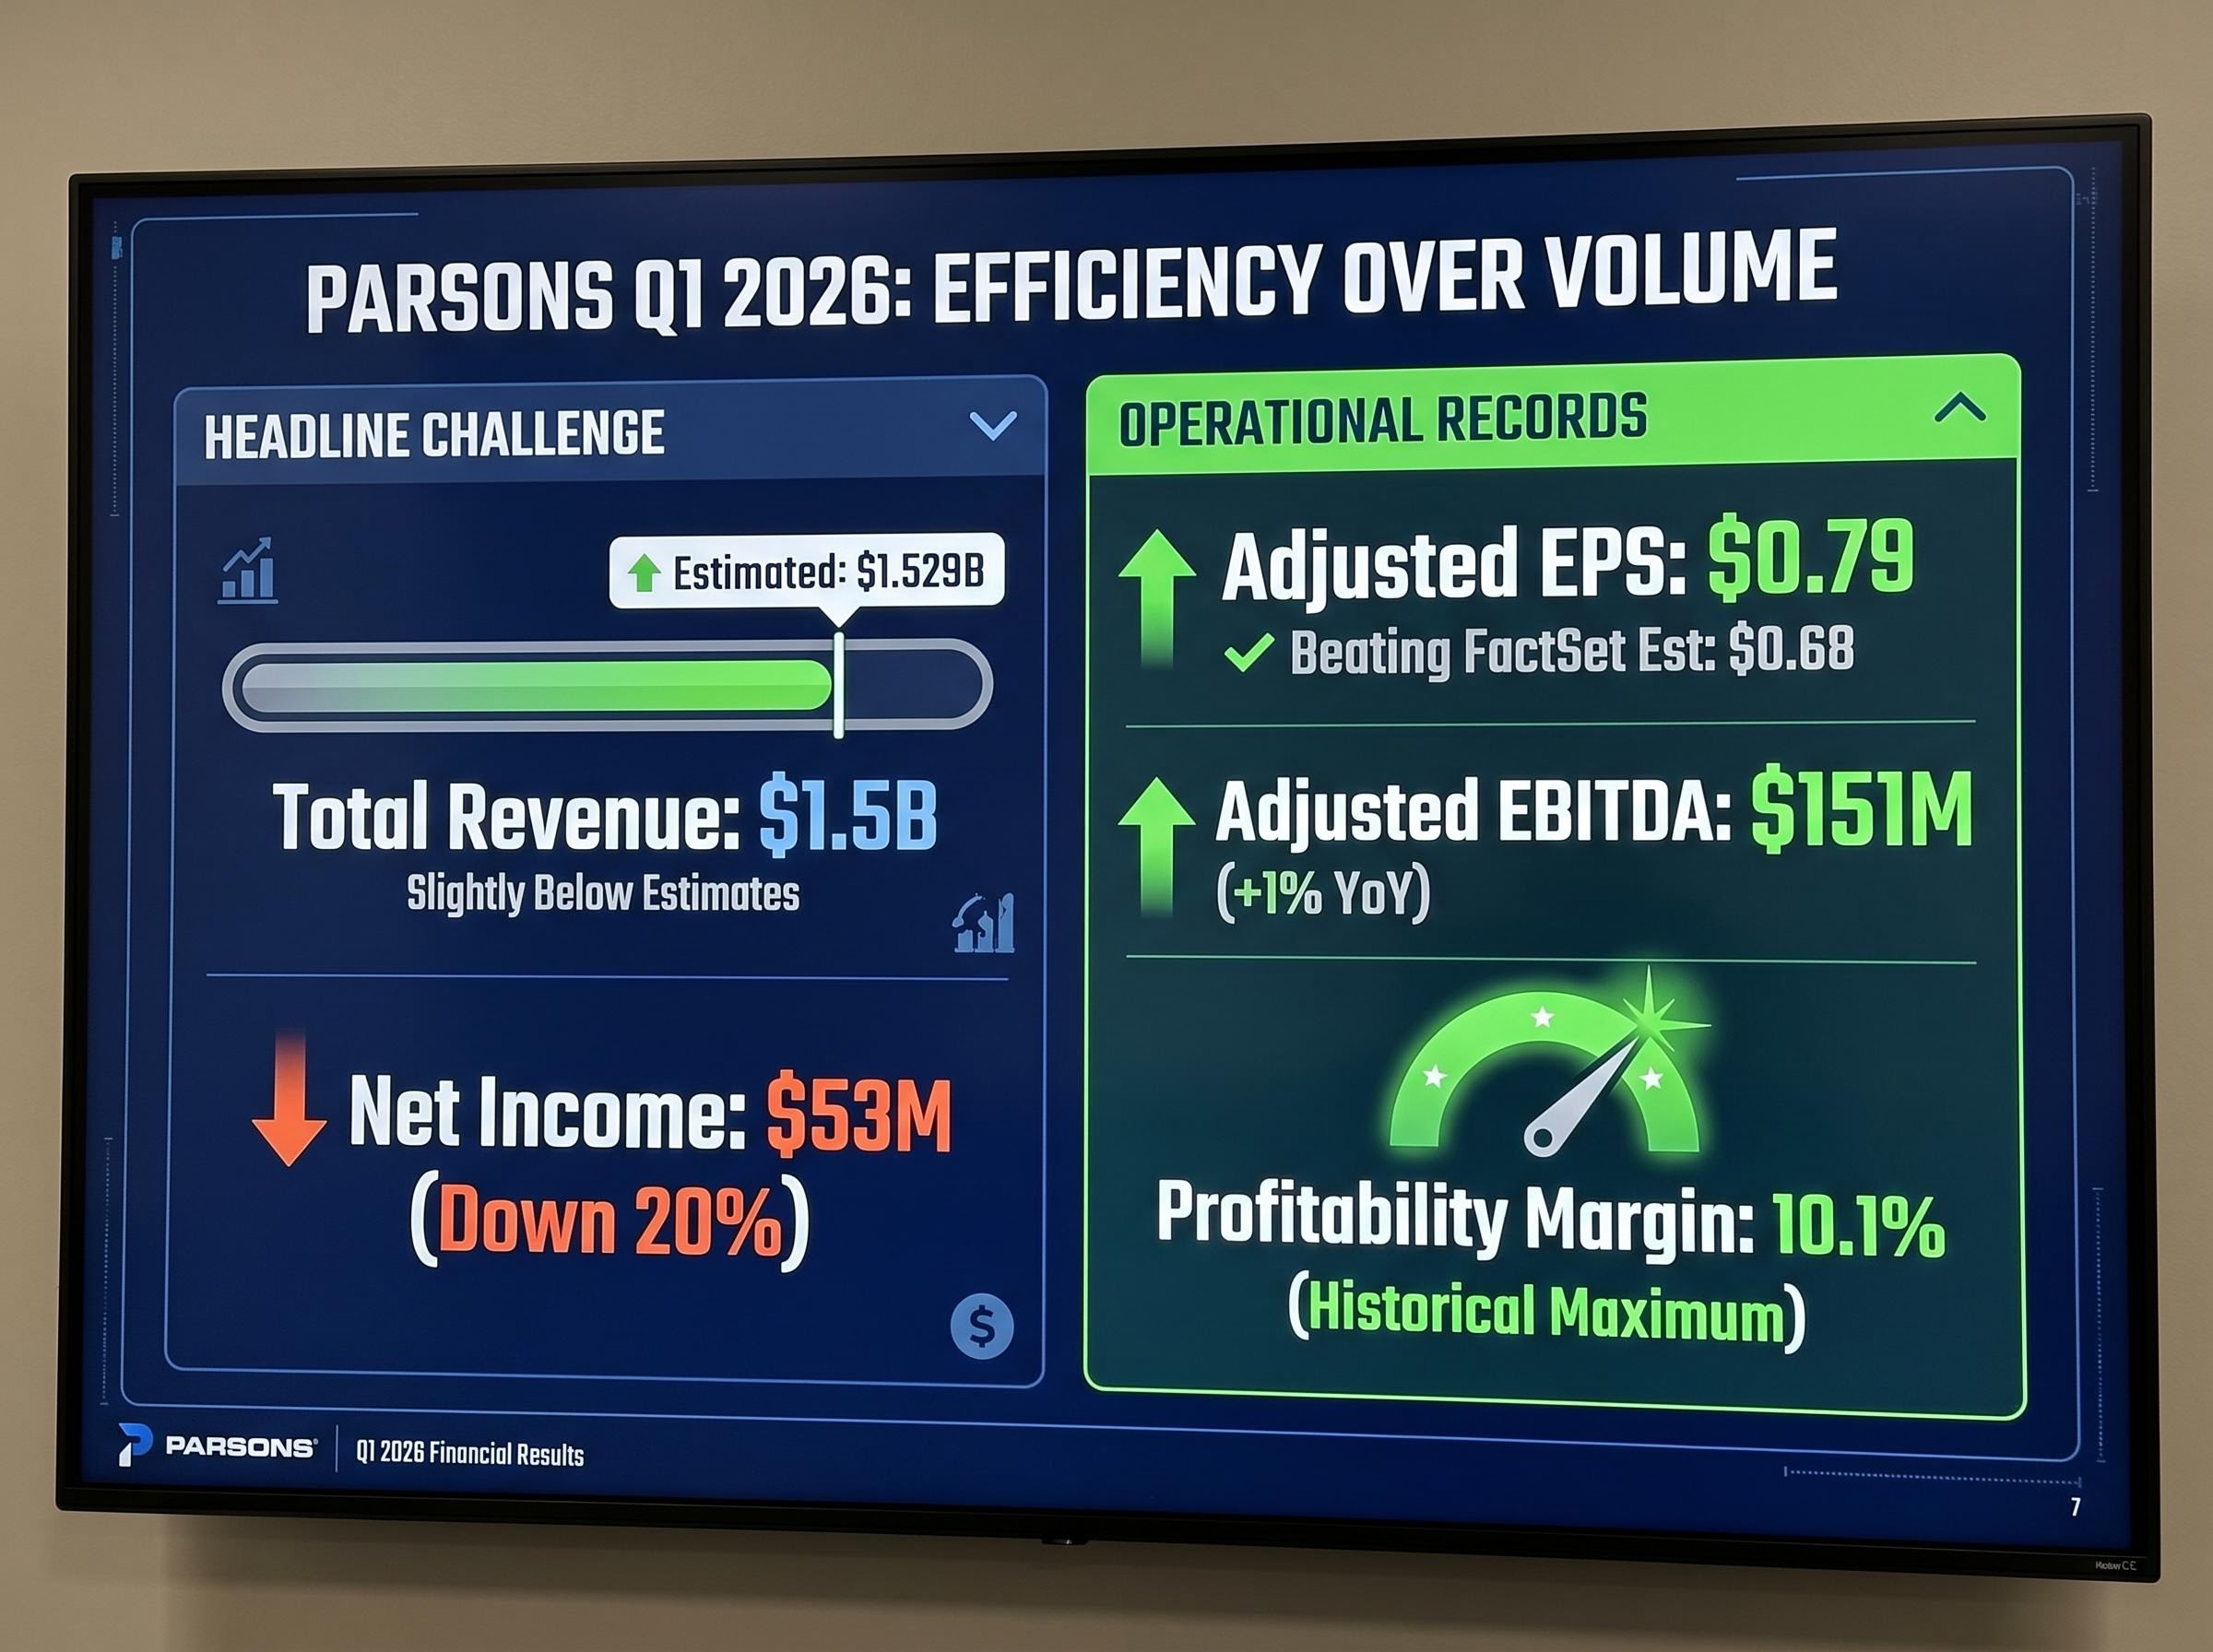
The initial reaction to the first-quarter 2026 financial report hinged on separating headline noise from operational execution. Parsons reported total revenue of approximately $1.5 billion, falling short of the estimated $1.529 billion.
This contraction requires specific context, as the year-over-year comparison is skewed by the completion of an undisclosed classified project. According to company data, when excluding this specific classified initiative, the company actually achieved an 8 percent baseline organic expansion.
The sudden completion of confidential agreements frequently creates reporting distortions in government contracting, requiring investors to look past superficial contractions to evaluate underlying operational momentum.
The market’s positive reaction stemmed directly from management’s ability to extract record profit margins from this revenue base. According to company data, total net income dropped 20 percent to $53 million, but adjusted operational metrics told a different story of internal efficiency.
Adjusted EPS: Reached $0.79, comfortably beating FactSet estimates of $0.68 and market expectations of $0.69. Adjusted EBITDA: Hit a record $151 million, representing a 1 percent year-over-year increase. Profitability Margin: Expanded to a historical maximum of 10.1 percent. Revenue: Recorded at $1.5 billion, slightly below market consensus but masking strong organic baseline growth.
For commercial investors, these mixed results illustrate how margin expansion and operational durability drive stock performance more effectively than raw top-line sales. The ability to expand EBITDA margins to historical highs while navigating a revenue transition phase demonstrates proven pricing power.
To evaluate a government contractor’s true operational health, investors must move beyond current quarterly earnings and examine the mechanisms of future revenue. The premier leading indicator in this sector is the book-to-bill ratio.
The book-to-bill ratio compares the dollar value of new contracts received to the value of work completed and billed to clients. A ratio above 1.0 indicates that a company is securing new business faster than it is depleting its existing project pipeline.
Parsons generated a 1.4x book-to-bill multiple in the first quarter of 2026.
This metric signals aggressive pipeline expansion rather than just steady replacement.
Analytical Indicator A 1.4x book-to-bill ratio provides a high degree of revenue visibility, indicating that for every dollar of work billed during the quarter, the company secured one dollar and forty cents in new contract value.
Furthermore, analysts distinguish between total backlog and funded backlog in government contracting. Total backlog includes all anticipated revenue from awarded contracts, while funded backlog represents money that the government has formally appropriated and committed to a project.
At the close of March 2026, capital-secured funded projects for Parsons totalled $6.6 billion. This represents the largest reserve of appropriated funds the company has held since its 2019 initial public offering.
For readers wanting to understand how these metrics predict future cash flows, our full explainer on defense contractor backlogs details how funded obligations and book-to-bill ratios are used to model forward revenue in the sector.
The foundational theory of backlog health translates into hard evidence when examining the specific contract awards secured during the first quarter. The enterprise accumulated total future work reaching a record $9.3 billion, marking a $235 million year-over-year increase.
The primary drivers behind the $2.1 billion in net bookings showcase a highly diversified portfolio across federal defence, aviation, and civil engineering sectors. The immediate quarter was heavily weighted toward securing long-term funding extensions on massive institutional projects.
| Contract Name | Total Project Value | Q1 2026 Booked Amount |
|---|---|---|
| Federal Aviation Administration (FAA) Extension | $593 million | $410 million |
| U.S. Cyber Command | $500 million | $250 million |
| Middle East Transportation Project | $340 million | $300 million |
| Mine Remediation | $150 million | $150 million |
| Foothill Gold Line | $60 million | $60 million |
Investors typically look for this type of structural diversity to ensure a contractor is not overly reliant on a single vulnerable government programme.
Parsons divides its operations into two primary segments that perform distinctly under different macroeconomic conditions. The Critical Infrastructure division demonstrated notable strength, seeing revenue grow 3 percent while achieving a 10.8 percent profit margin.
Conversely, the Federal Solutions segment navigated a transition phase, operating at a 9.4 percent margin. The varied margin profiles highlight how infrastructure spending acts as a highly profitable counterbalance to federal defence contracts.
Company-specific execution represents only one side of the growth equation. Parsons’ historic backlog is heavily supported by broader macroeconomic and geopolitical forces that funnel capital into defence and infrastructure sectors.
Global geopolitical friction has prompted both domestic legislative action and international commitments that create a reliable floor for future contract awards. These global trends connect directly back to the company’s specific service offerings in space, missile defence, and critical infrastructure protection.
Domestic Legislation: Defence spending under the OBBBA is projected to boost US real GDP growth by 0.2 percentage points in 2026. International Defence Commitments: NATO members have formally committed to increasing their defence spending to at least 3.5 percent of their respective GDPs by 2035. * Industrial Base Strengthening: Increased federal funding flows directly to contractors capable of modernising allied defence technology.
These systemic spending cycles reassure institutional buyers that the company’s pipeline expansion is not a temporary anomaly. The growth is supported by structural, multi-year funding mandates that insulate the firm against short-term economic fluctuations.
Developing a systematic portfolio allocation strategy for defense equities involves weighting these multi-year funding mandates against potential political risks and comparing mid-tier operational agility with the scale of larger industry peers.
Synthesising historical performance data with current macroeconomic tailwinds reveals a distinct gap between internal corporate projections and external market expectations. Management opted for caution in their first-quarter update, reaffirming their existing fiscal year 2026 guidance rather than raising it.
The executive team projects full-year revenue between $6.5 billion and $6.8 billion, paired with $615 million to $675 million in adjusted EBITDA. The guidance midpoint of $6.65 billion sits slightly beneath the Wall Street consensus expectation.
Despite the minor revenue miss and conservative forward guidance, analysts remain notably bullish. Wall Street institutions have maintained a Strong Buy consensus rating, projecting substantial upside potential for the equity.
Analyst Consensus Outlook Financial analysts maintain a mean price target of $74.80 for the stock. Compared to the 28 April 2026 closing price of $51.69, this target implies an approximate 45 percent upside potential for investors.
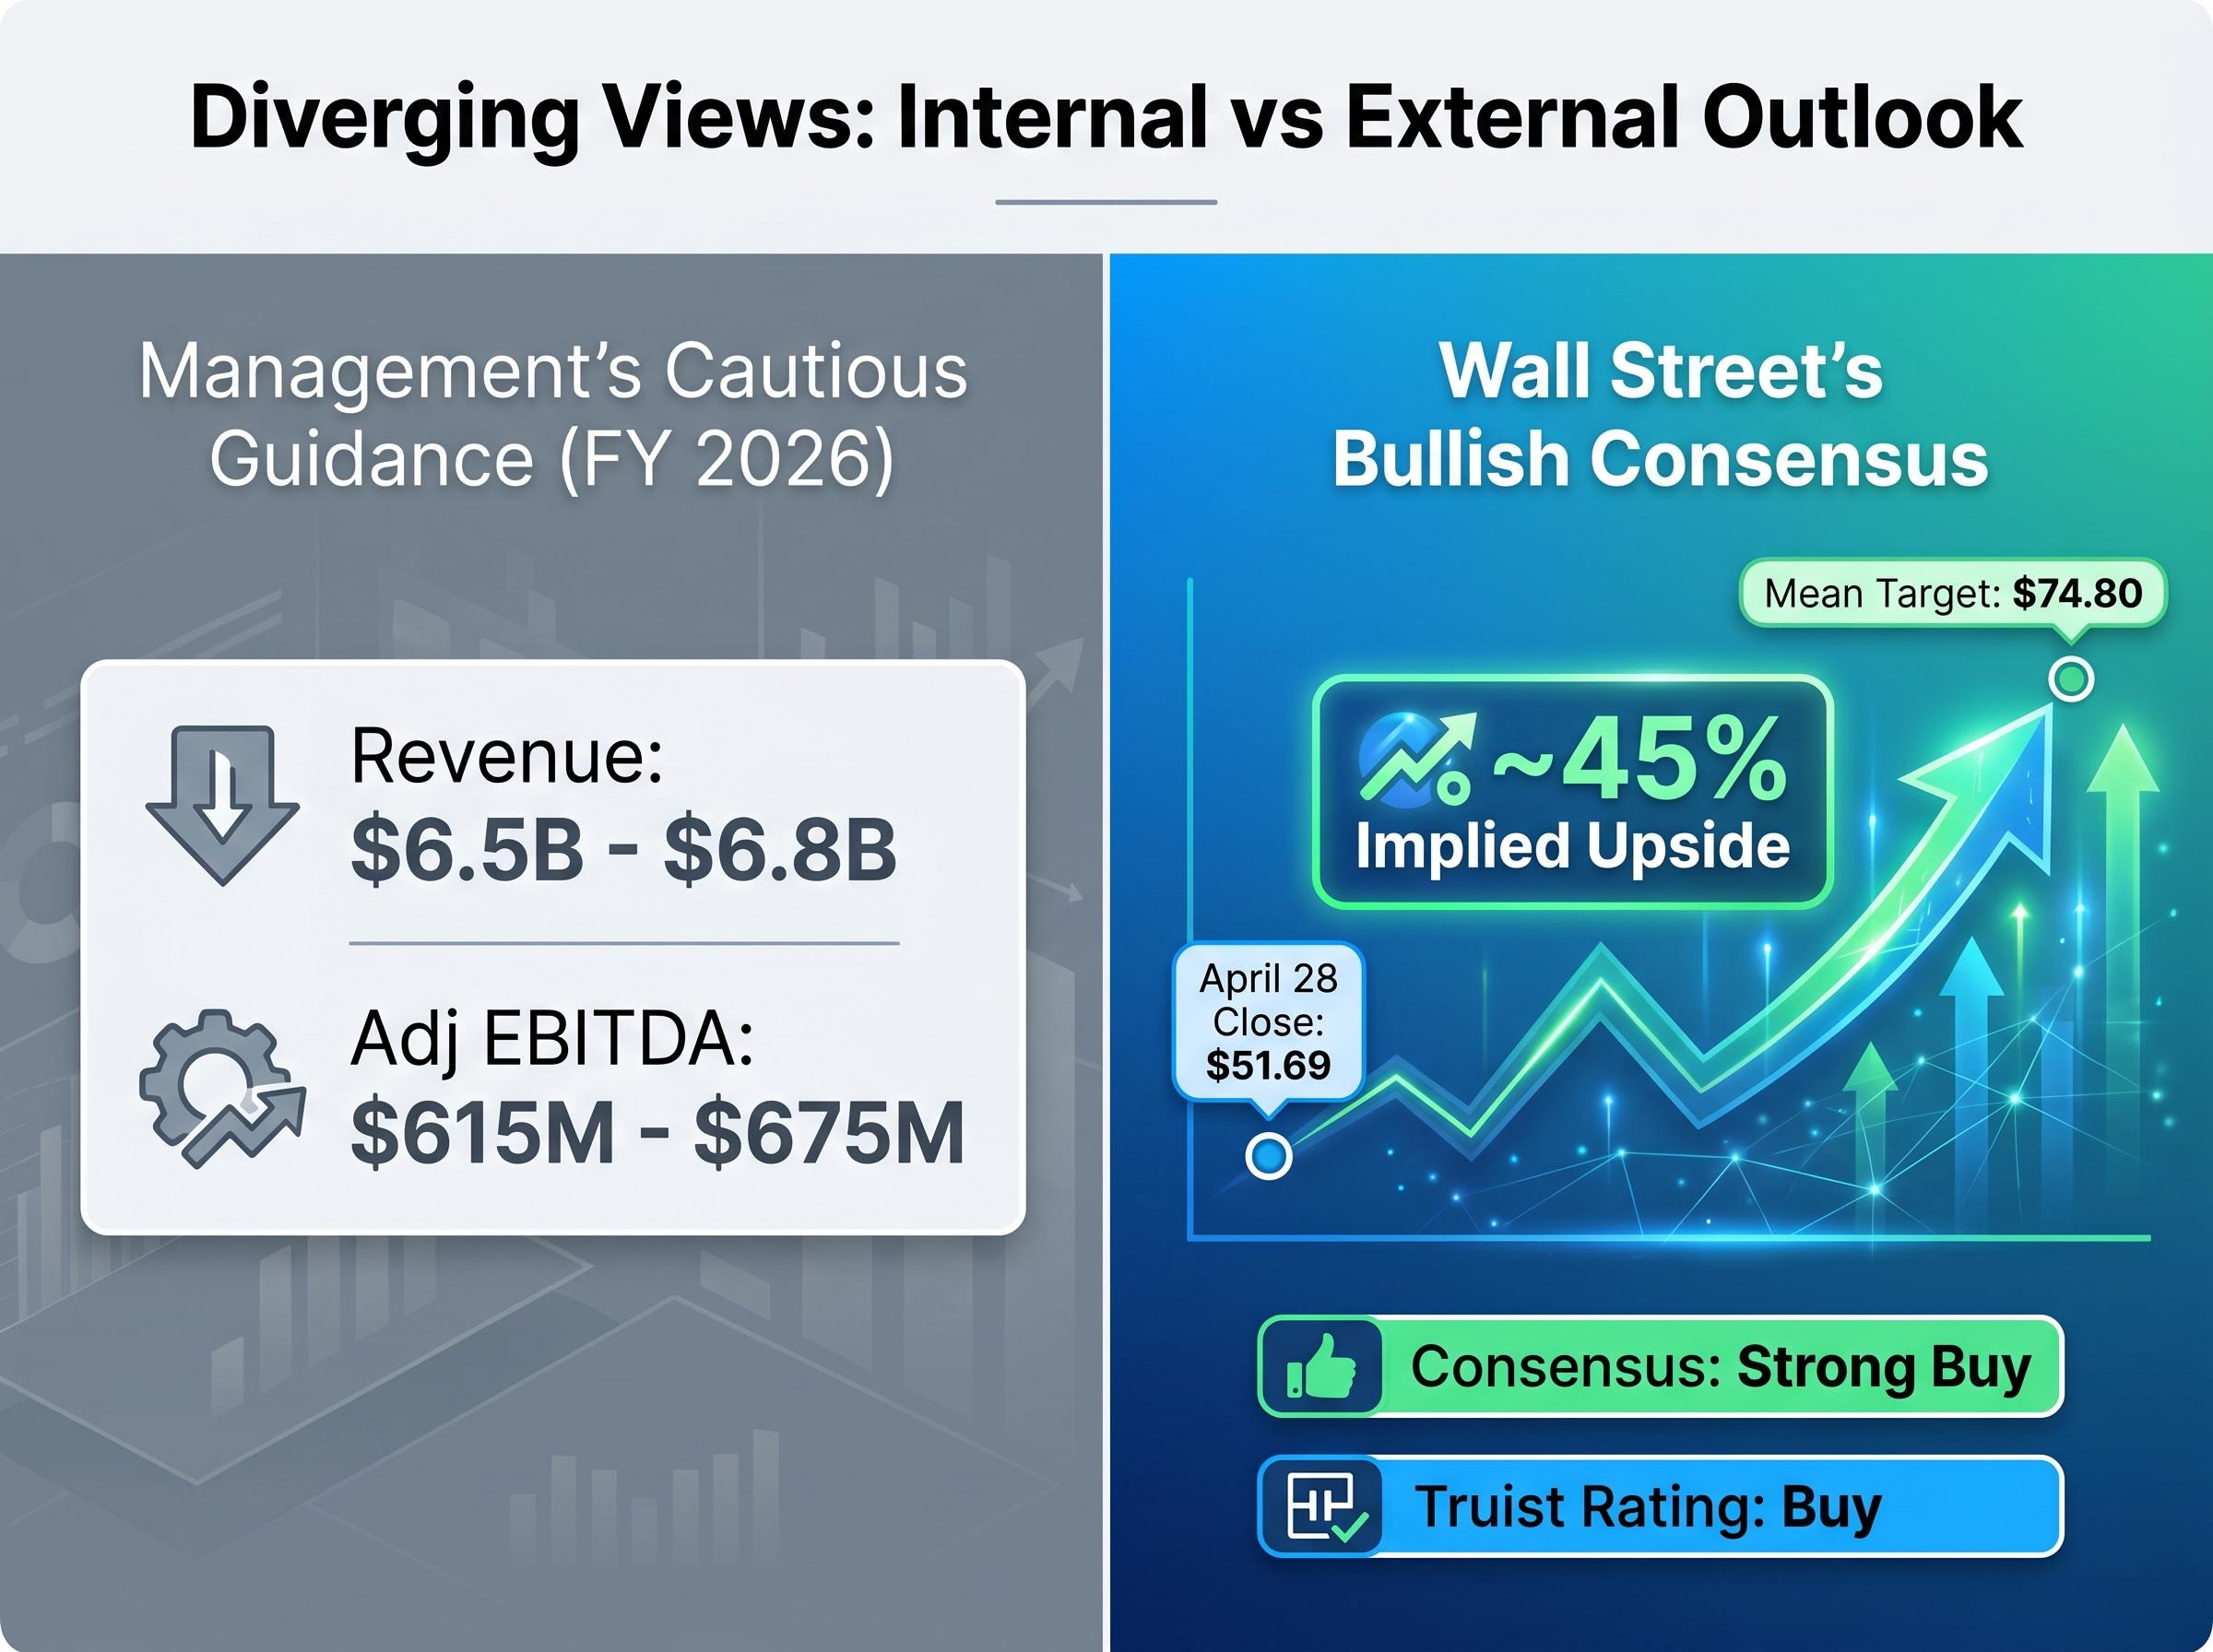
Prior to the earnings release, firms like Truist slightly adjusted targets downward but maintained their Buy ratings. This contrast between conservative management targets and highly bullish analyst projections helps commercial investors gauge the risk-to-reward ratio moving forward.
The core analytical thesis for Parsons is that the mixed first-quarter revenue figures are heavily outweighed by unprecedented profitability margins and a historic project pipeline. The 1.4x book-to-bill ratio serves as a highly reliable compass, pointing toward sustained revenue generation in the coming quarters.
A record $9.3 billion backlog, supported by strong macroeconomic defence tailwinds and legally mandated government spending, provides deep visibility into the company’s future cash flows. With Wall Street signalling a potential 45 percent upside, the current share valuation appears to price in the recent revenue dip while heavily discounting the confirmed pipeline of funded projects.
This structural certainty is particularly valuable given the fragile US economic outlook driven by consumer savings depletion and inflationary pressures, as government appropriations offer a reliable counterbalance to private sector volatility.
This article is for informational purposes only and should not be considered financial advice. Investors should conduct their own research and consult with financial professionals before making investment decisions regarding defence and infrastructure equities.
The book-to-bill ratio compares new contracts secured to work completed, with Parsons' 1.4x ratio indicating it is acquiring new business faster than it depletes its pipeline, providing strong future revenue visibility.
Despite a headline revenue miss, Parsons' Q1 2026 report led to a 3 percent pre-market price appreciation due to record profitability margins and strong net bookings overshadowing the top-line contraction.
Parsons' record $9.3 billion backlog, supported by a $6.6 billion funded portion, signifies deep visibility into future cash flows and insulation against short-term economic fluctuations for investors.
Total backlog includes all anticipated revenue from awarded contracts, while funded backlog represents money the government has formally appropriated and committed to a project, offering greater certainty.
Analysts maintain a Strong Buy consensus, projecting a 45 percent upside, because they prioritize Parsons' unprecedented profitability margins, historic project pipeline, and structural defense tailwinds over conservative short-term revenue guidance.