Nvidia vs Interactive Brokers: Which Growth Stock Wins in 2026?

Key Takeaways
- Interactive Brokers outperformed Nvidia in 2025 and into 2026, challenging assumptions that AI momentum stocks deliver the best risk-adjusted returns.
- Interactive Brokers reported a 95% gross margin and 79% pre-tax margin, driven by automation and operational efficiency built over decades rather than premium pricing power.
- Nvidia delivered a 238% yearly gain but faces material risks including competition from AMD, potential hyperscaler custom silicon development, and market rotation away from technology stocks.
- Interactive Brokers posted 32% account growth in 2025 and 25% year-on-year growth in daily average revenue trades, supporting a steady compounding trajectory at a P/E of approximately 37.
- The two stocks represent fundamentally different growth archetypes with non-correlated risk factors, making a combined position a potential consideration for diversified portfolios.
Interactive Brokers outperformed Nvidia in 2025 and continues to deliver superior returns in early 2026, challenging conventional assumptions about which growth stocks deserve investor attention. Whilst Nvidia captured headlines with its 238% yearly gain driven by artificial intelligence infrastructure demand, the automated brokerage platform quietly delivered steadier appreciation with potentially more durable margin profiles. This analysis compares two fundamentally different growth investment approaches: Nvidia’s high-flying AI momentum versus Interactive Brokers’ operational excellence model.
Investors face a choice between contrasting business models with distinct risk profiles. Understanding how each company generates profits, maintains competitive advantages, and navigates market headwinds provides essential context for allocation decisions.
Understanding the Two Business Models
Nvidia operates as a semiconductor designer specialising in graphics processing units for data centres, with revenue driven by capital expenditure cycles amongst hyperscale cloud providers. The company maintains premium pricing power through technological leadership in AI chip design. Demand from Microsoft, Amazon Web Services, Google Cloud, and other infrastructure providers supports the business model, though this creates dependency on sustained AI investment enthusiasm.
Interactive Brokers runs a highly automated trading platform serving active traders and institutions globally. Revenue streams include trading commissions, net interest income from client cash balances, and margin lending spreads. The platform’s competitive positioning stems from decades of proprietary software development, enabling the firm to offer amongst the lowest margin lending rates in the brokerage industry. This cost leadership derives from operational efficiency rather than premium pricing.
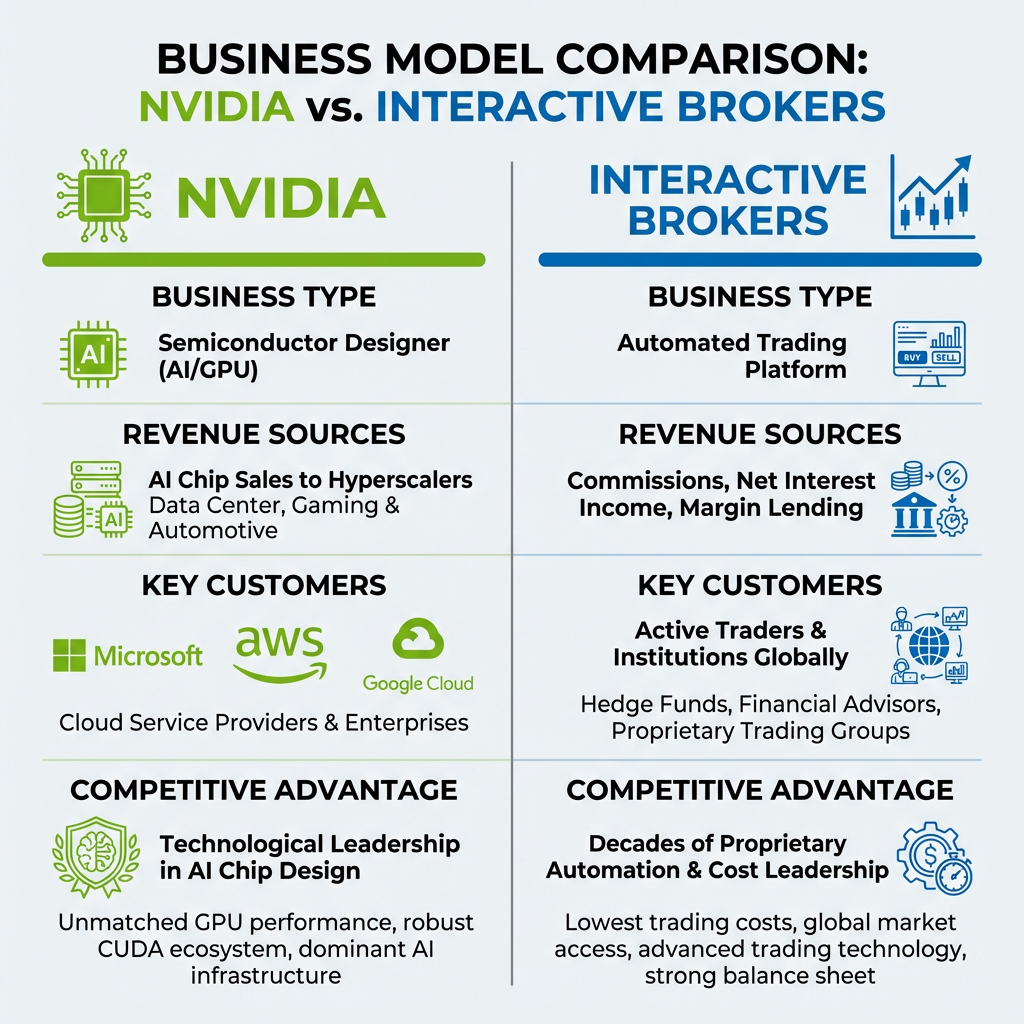
The fundamental contrast centres on moat sustainability. Nvidia’s profitability requires maintaining multi-year technological superiority against well-capitalised competitors including AMD, Intel, and potential custom silicon development by hyperscalers themselves. Interactive Brokers’ advantages stem from automation investments that enable volume-based scaling without proportional expense increases, creating structural efficiency rather than technology-dependent margins.
When big ASX news breaks, our subscribers know first
Recent Stock Performance and Earnings
Nvidia delivered a 238% gain over the past year, though recent performance has been turbulent despite positive earnings results. The company reported beat-and-raise earnings on or before 26 February 2026, confirming robust AI capital expenditure demand from hyperscalers. However, the stock experienced declines following the announcement, as results failed to exceed the elevated bar set by the prior year’s extraordinary gains. Technical analysis suggests support levels at $113 to $140, with potential upside to $150 to $180 if AI infrastructure spending maintains momentum.
Market rotation towards cyclical sectors and safe-haven assets has created headwinds for technology stocks generally. Nvidia’s post-earnings decline reflects maturity concerns surrounding the AI investment theme, with investors questioning whether spending can accelerate sufficiently to justify current valuations.
Interactive Brokers reported 32% account growth in 2025, with daily average revenue trades reaching 4.33 million in March 2026, representing 25% year-on-year growth. The stock traded within a 52-week range of $38.10 to $82.88, with current trading at approximately $81.71 and a price-to-earnings ratio near 37. The platform maintains a 79% pre-tax margin and approximately 95% gross margin, driven by the automated infrastructure developed over multiple decades.
Understanding market-wide valuation dynamics becomes essential when evaluating Interactive Brokers’ P/E ratio of 37, particularly during periods when broader market valuations exhibit unusual patterns.
| Metric | Nvidia (NVDA) | Interactive Brokers (IBKR) |
|---|---|---|
| Gross Margin | ~75% | ~95% |
| Pre-Tax Margin | Not disclosed | ~79% |
| P/E Ratio | Market-dependent | ~37 |
| Key Growth Metric | 238% yearly gain | 32% account growth |
| Recent Trend | Volatile post-earnings | Steady upward trajectory |
Margin Profiles and Sustainability
Nvidia’s approximately 75% gross margin requires sustained technological superiority in AI chip design and manufacturing. The company must maintain multi-year leads over competitors whilst hyperscalers continue purchasing external GPUs rather than developing proprietary alternatives. If AI infrastructure spending consolidates or competition from AMD and potential hyperscaler custom silicon intensifies, margin compression represents a material risk. Premium pricing depends on maintaining performance advantages that justify the cost premium.
The competitive threat from hyperscaler custom silicon development represents a material margin risk for Nvidia, as evidenced by recent industry partnerships shifting towards proprietary chip designs.
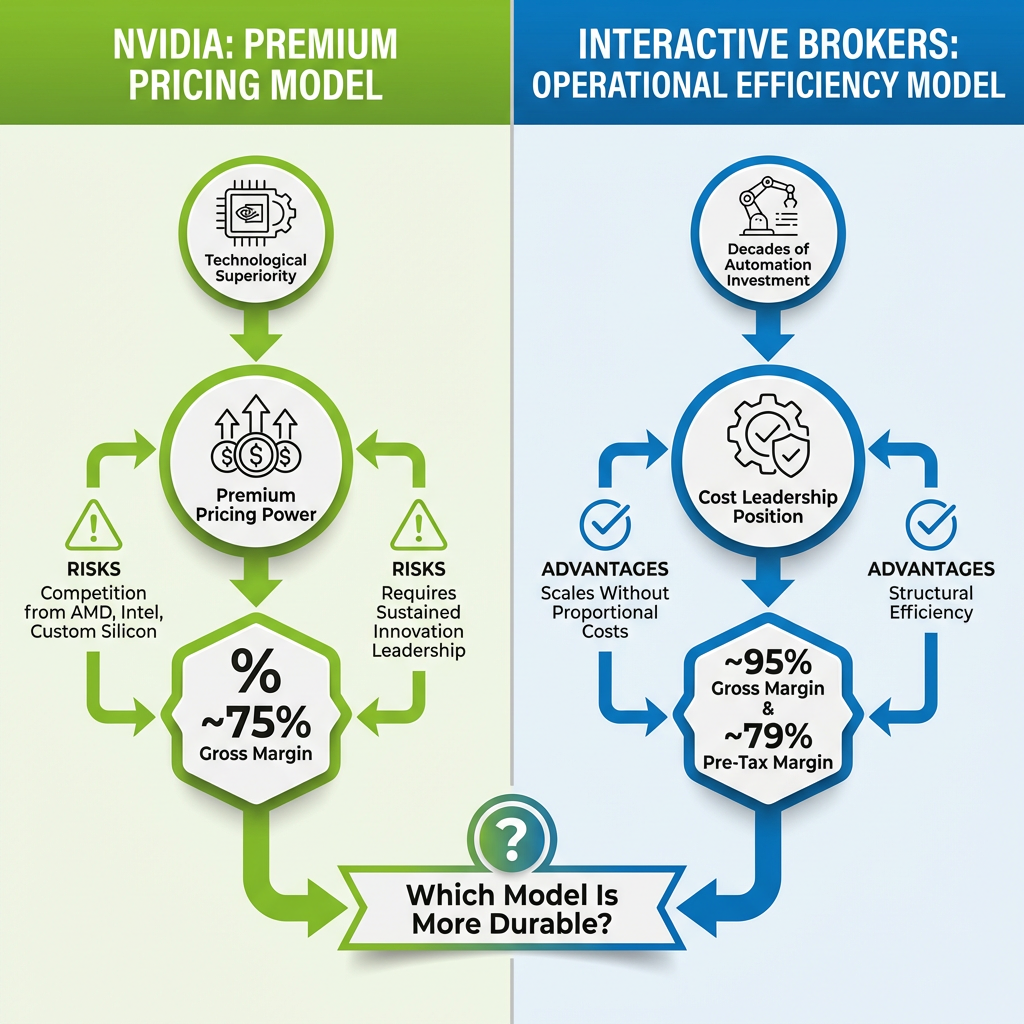
Interactive Brokers achieves approximately 95% gross margin and 79% pre-tax margin through automation rather than premium pricing. The platform scales trading volumes without proportional expense growth, as decades of software development created infrastructure that handles increased activity efficiently. The firm competes on cost leadership, offering amongst the industry’s lowest margin lending rates whilst maintaining exceptional profitability. This efficiency-based model may prove more defensible than pricing power dependent on technological leadership.
Interactive Brokers’ profitability stems from operational efficiency and competitive low-cost positioning built over decades, potentially offering more durable advantages than Nvidia’s premium pricing model dependent on maintaining technological superiority against well-capitalised competitors.
Growth Catalysts and Risk Factors
Nvidia’s catalysts and risks include:
- Robust hyperscaler AI infrastructure spending supporting near-term demand
- Technical upside potential to $180 if market rotation reverses
- Market leadership position in data centre GPU segment
- AI theme maturity concerns limiting enthusiasm for continued acceleration
- Margin pressure risk if competition from AMD or hyperscaler custom silicon intensifies
- Market rotation away from technology stocks towards cyclicals and safe-haven assets
Interactive Brokers’ catalysts and risks include:
- Sustained account growth momentum with 32% annual increase
- Trading volume expansion with 25% year-on-year growth in daily average revenue trades
- Interest rate sensitivity pressuring net interest income if Federal Reserve implements cuts
- Market downturn risk reducing trading volumes and client equity balances
- Valuation assumptions embedded in P/E of 37 requiring sustained double-digit growth
The next major ASX story will hit our subscribers first
Which Stock Fits Your Portfolio?
Nvidia suits investors maintaining conviction in continued AI infrastructure buildout, comfortable with volatility inherent in momentum-driven technology stocks, and seeking potential for outsized returns with corresponding risk. The investment thesis depends on hyperscaler spending exceeding current expectations and Nvidia maintaining technological leadership against emerging competition. The 238% yearly gain demonstrates the upside potential, whilst recent post-earnings declines illustrate the volatility accompanying high-growth technology positions.
Interactive Brokers appeals to investors preferring growth through operational excellence rather than thematic momentum, valuing margin durability over premium pricing power, and seeking exposure to sustained trading volume growth. The steady account growth trajectory and exceptional margin profile suggest a potentially more predictable compounding path. The platform’s automation-driven efficiency may prove more defensible than technology-dependent competitive advantages requiring sustained innovation leadership.
The choice between Nvidia’s AI momentum and Interactive Brokers’ operational excellence exemplifies the broader momentum versus value debate reshaping technology sector allocations in 2026.
Some investors may find strategic value in holding both positions within a diversified portfolio, as they represent fundamentally different growth archetypes with non-correlated risk factors. Interactive Brokers’ outperformance during 2025 and into 2026 challenges assumptions about which category of growth stocks delivers superior risk-adjusted returns, suggesting operational efficiency deserves consideration alongside technological innovation when evaluating long-term holdings.
Conclusion
The comparison reveals two distinct growth investment approaches with contrasting sustainability profiles. Interactive Brokers’ 95% gross margin and 79% pre-tax margin stem from automation and operational efficiency, potentially offering more durable advantages than Nvidia’s 75% gross margin dependent on maintaining technological superiority. Recent performance supports this thesis, with steady account growth and margin expansion at Interactive Brokers contrasting with Nvidia’s post-earnings volatility despite beating analyst expectations.
Investors should monitor AI infrastructure spending trends and hyperscaler capital expenditure announcements for Nvidia, as sustained demand acceleration remains critical to justifying current valuations.
Investors should monitor AI infrastructure spending trends and hyperscaler capital expenditure announcements for Nvidia, as sustained demand acceleration remains critical to justifying current valuations. For Interactive Brokers, Federal Reserve interest rate policy represents the key variable affecting net interest income, whilst trading volume trends could drive material account growth over coming quarters. These distinct catalysts and risk factors create differentiated investment profiles suited to different portfolio objectives and risk tolerances.
This article is for informational purposes only and should not be considered financial advice. Investors should conduct their own research and consult with financial professionals before making investment decisions.
Frequently Asked Questions
How does Interactive Brokers compare to Nvidia as an investment in 2025 and 2026?
Interactive Brokers outperformed Nvidia in 2025 and continued delivering superior returns into 2026, with steady 32% account growth and a 79% pre-tax margin, while Nvidia posted a 238% yearly gain but faced post-earnings volatility and margin risks tied to maintaining AI chip leadership.
What makes Interactive Brokers' profit margins so high?
Interactive Brokers achieves approximately 95% gross margin and 79% pre-tax margin through decades of proprietary automation that allows the platform to scale trading volumes without proportional expense increases, enabling cost leadership rather than premium pricing.
What are the biggest risks for Nvidia investors right now?
Nvidia's main risks include potential margin compression if AMD or hyperscaler custom silicon development intensifies competition, market rotation away from technology stocks, and the challenge of sustaining the extraordinary growth rate that current valuations require.
Is Interactive Brokers stock overvalued at a P/E of 37?
At a price-to-earnings ratio of approximately 37, Interactive Brokers' valuation requires sustained double-digit growth, though the platform's exceptional margin profile and 25% year-on-year growth in daily average revenue trades support the case for this multiple.
Which stock is better suited for a long-term portfolio: Interactive Brokers or Nvidia?
Nvidia suits investors with high risk tolerance who believe in continued AI infrastructure spending, while Interactive Brokers appeals to those seeking compounding growth through operational efficiency; holding both provides exposure to non-correlated growth archetypes within a diversified portfolio.


