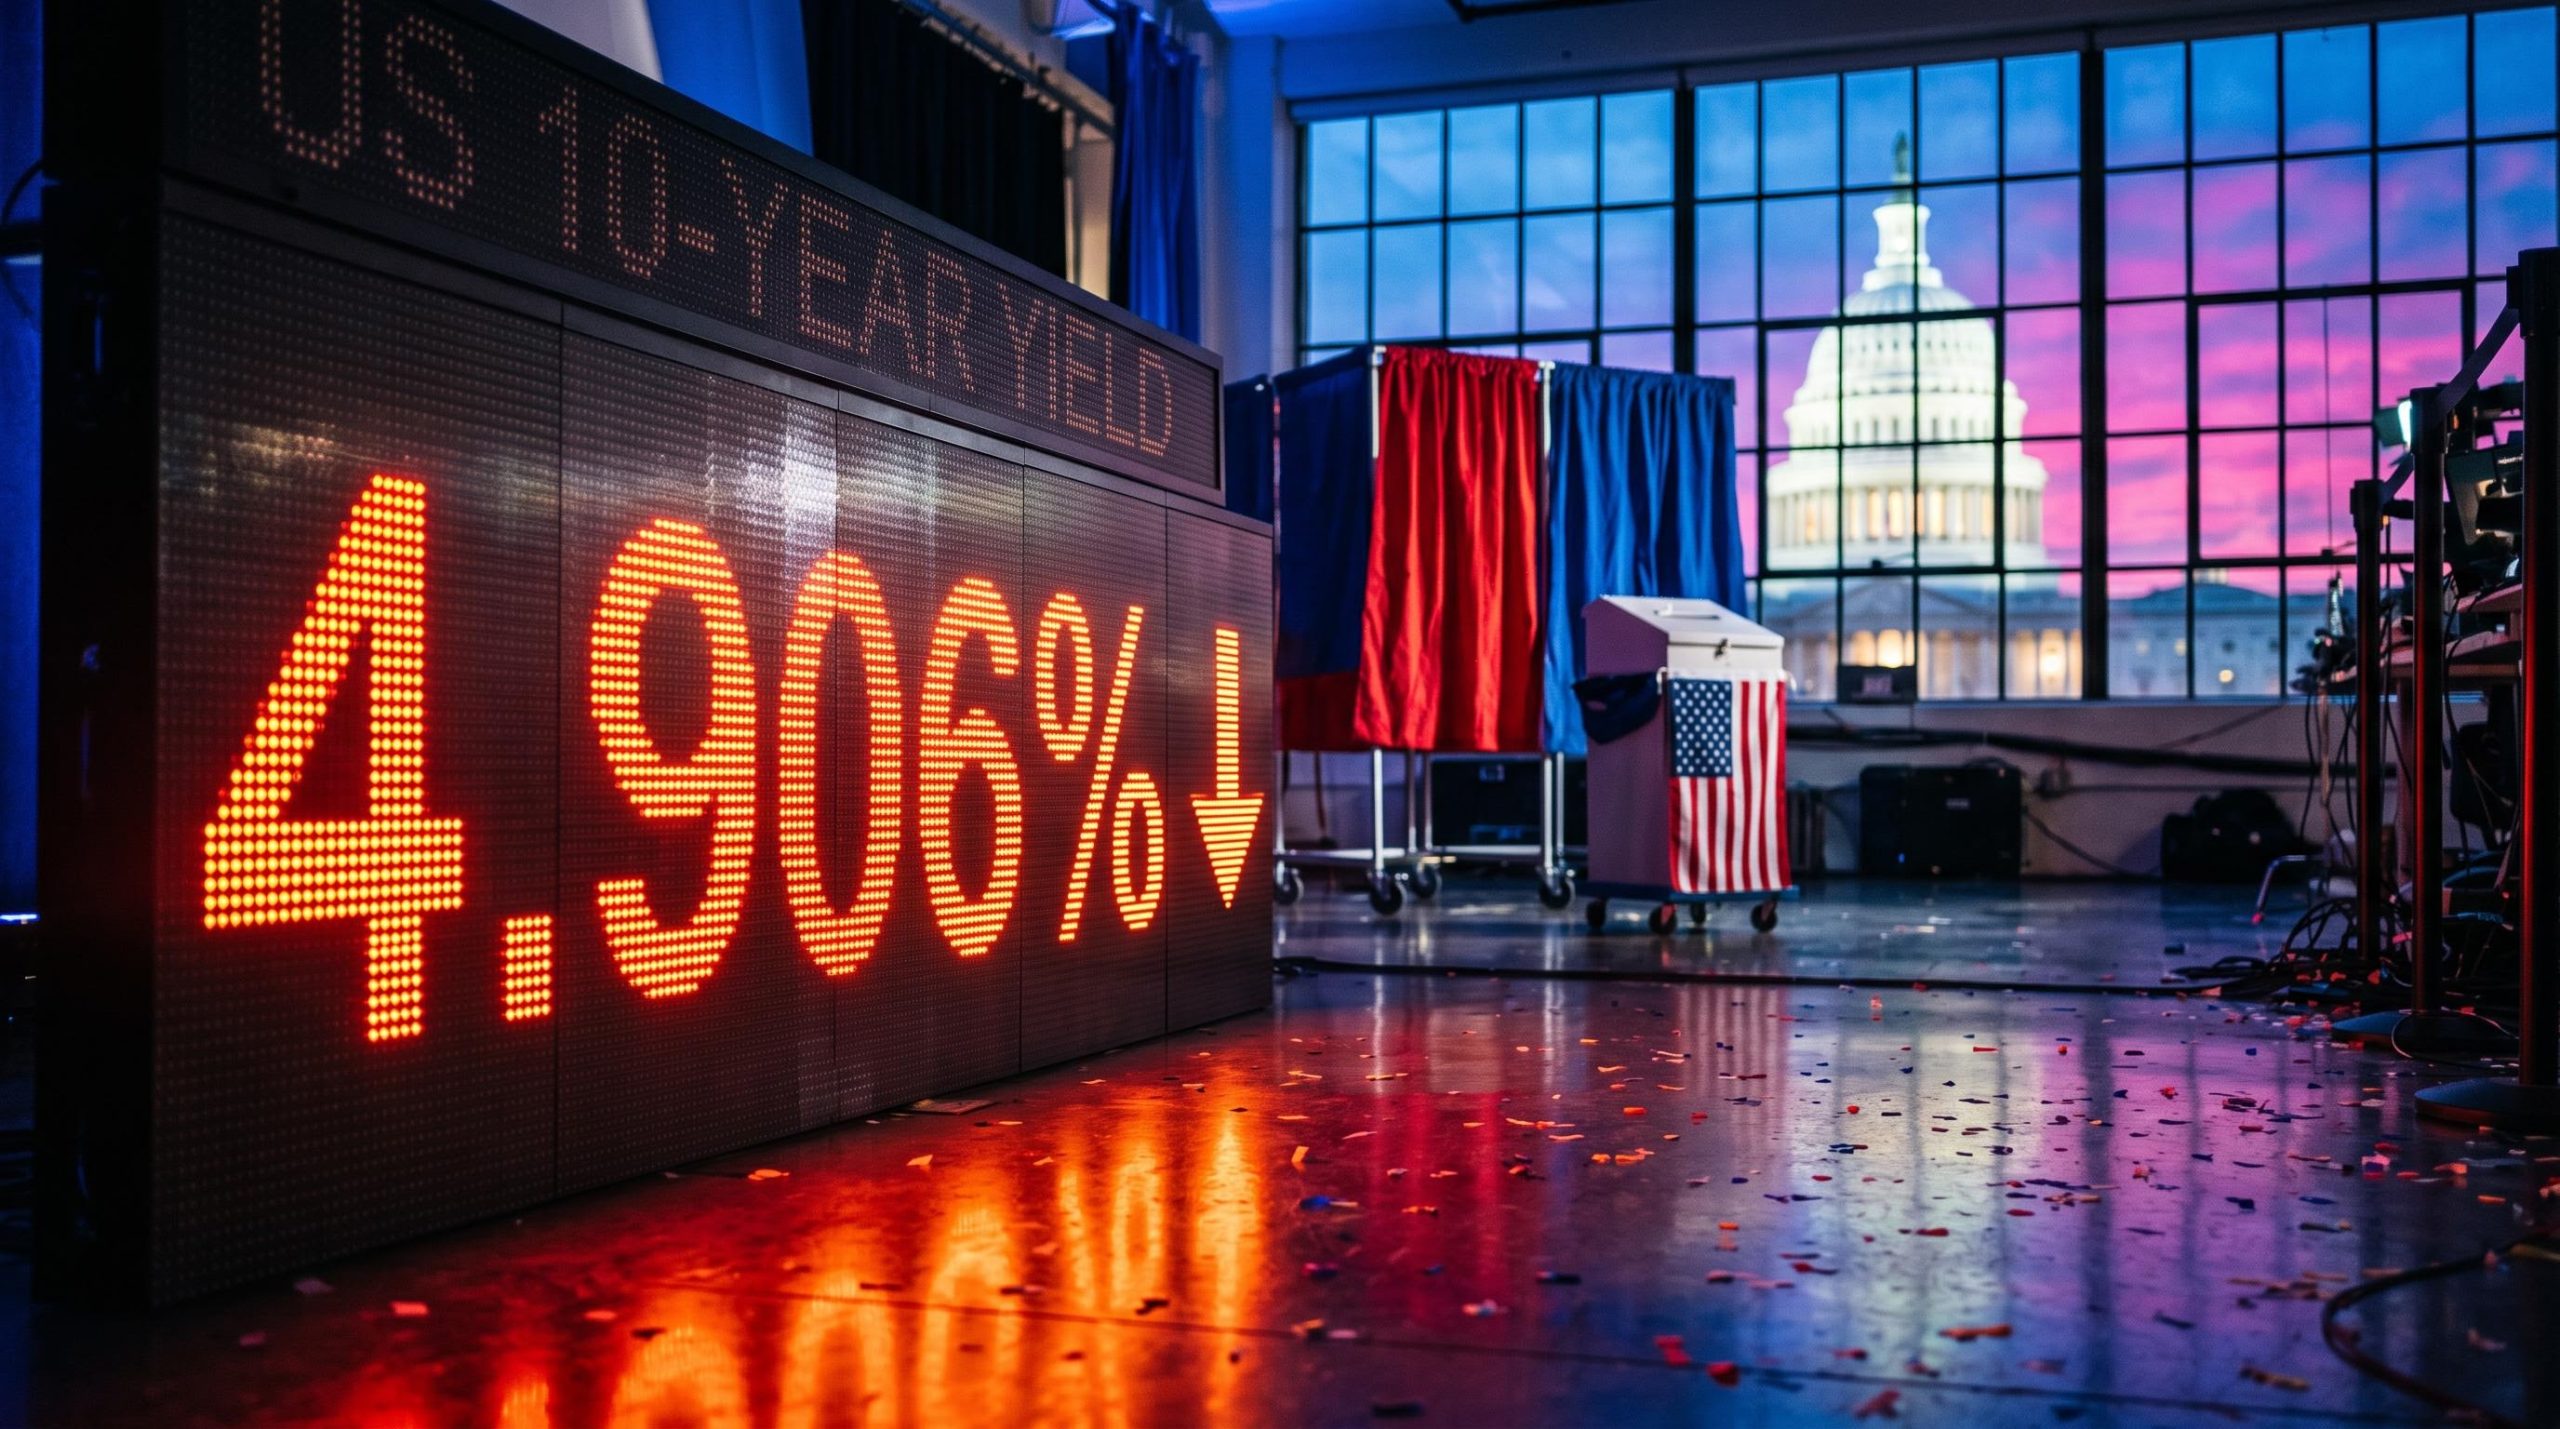
Early Democratic gains in the 2026 midterm election results pushed US Treasury yields lower, softened the dollar and weighed on equity futures in the early hours of 4 November 2026. The benchmark 10-year Treasury yield fell about 6 basis points to 4.906% as bonds rallied on the first Senate calls, including a flipped Republican seat in North Carolina.
Decision Desk HQ has projected that Democrats will retake the House of Representatives. The Senate remains uncalled, and every figure here is an early-count snapshot that will shift as results arrive.
For a global investor, the risk is reading too much into one night. A softer dollar and a bond rally affect currency exposure, fixed income returns and equity valuations well beyond the US.
This report covers what markets moved on overnight, what 19 previous midterms say about the next 12 months, and which variables are likely to matter more than the vote itself.
Why did Treasuries rally and the dollar slip as Democrats scored early wins?
The screens told a simple story overnight: yields down, the dollar softer, stocks lower. The readings below are early-timeline figures and will move again before the US open.
| Market | Reading | Direction |
|---|---|---|
| 10-year Treasury yield | 4.906% | Down about 6 bps |
| 2-year Treasury yield | About 4.57% | Little changed |
| S&P 500 futures | Down about 0.8% | Lower |
| Nasdaq futures | Down about 1.8% | Lower |
| US Dollar Index (DXY) | Around 101.7 before results | Softer |
The logic runs through fiscal policy. A Democratic Congress is less likely to pass deficit-funded stimulus, which means less government borrowing and less Treasury supply. Lower supply supports bond prices and pulls yields down, and lower yields give the dollar less support, according to Reuters market analysis.
Carol Kong of Commonwealth Bank of Australia had flagged this scenario before the vote.
Strategist view Kong argued that a Democratic sweep would restrict government spending for the rest of Trump’s term, which could drive further weakness in the US dollar.
J.P. Morgan Asset Management made a similar case, saying Democratic control or divided government gives the best chance of limiting fiscal stimulus and capping further rises in yields.
Why the moves were muted before the Senate calls
Election day itself was quiet. The 10-year hovered near 4.90%, and the DXY traded in a tight 101.3-101.8 range, with the dollar weakest against the Swiss franc.
Before the results, strong economic data and election uncertainty had pushed the 10-year up about 6 bps to 4.954%, with the 30-year near 5.324%. Energy-driven inflation concerns, lingering since the February attacks on Iran, and speculation about US-Iran talks were competing for attention, while AI-related trading lifted stocks on 3 November.
That mix should temper your reading of the overnight moves. Markets are treating the vote as one input among several, so a single night’s price action is not a lasting trend.
When big ASX news breaks, our subscribers know first
Where the 2026 midterm election results stand: House, Senate and the races that moved markets
For readers outside the US: midterms elect all 435 House members and about a third of the Senate. The president is not on the ballot.
The Senate calls moved markets most. Former Governor Roy Cooper defeated Trump-endorsed Michael Whatley in North Carolina, flipping a Republican seat, while Jon Ossoff held Georgia against Mike Collins. Democrats needed a net gain of four seats, according to AP.
| State | Winner | Opponent | Outcome |
|---|---|---|---|
| North Carolina | Roy Cooper (D) | Michael Whatley (R) | Democratic flip |
| South Carolina | Annie Andrews (D) | Darline Graham (R) | Democratic flip |
| Georgia | Jon Ossoff (D) | Mike Collins (R) | Democratic hold |
| New Hampshire | Chris Pappas (D) | John Sununu (R) | Democratic hold |
| Illinois | Juliana Stratton (D) | Don Tracy (R) | Democratic hold |
Incumbents Mark Warner, Chris Coons, Jack Reed, Cory Booker and Ed Markey were also re-elected. The South Carolina upset materially improved the Democratic Senate outlook.
In the House, Democrats also outperformed in several Republican-leaning Florida districts. The early tally from Decision Desk HQ:
- 201 of 435 seats called
- Democrats 124, Republicans 77
- 218 seats needed for control
That tally was still changing overnight, so treat it as a snapshot, not a final delegation. The most likely configuration is a Democratic House with an uncertain Senate.
The distinction matters for you. A Democratic House alone is a check on the White House; a Democratic Senate as well would be a different market regime. The Senate count is the swing variable.
Pre-election pricing had already leaned heavily towards a Democratic midterm win in the House, which is why the Senate count carried more new information than the House result and why sector exposure may matter more than index direction.
What does history say about stocks after midterms, and why is the pattern not a promise?
The historical record is striking.
Key statistic The S&P 500 has been higher 12 months after all 19 midterms since 1950, averaging about 15%, according to J.P. Morgan Asset Management.
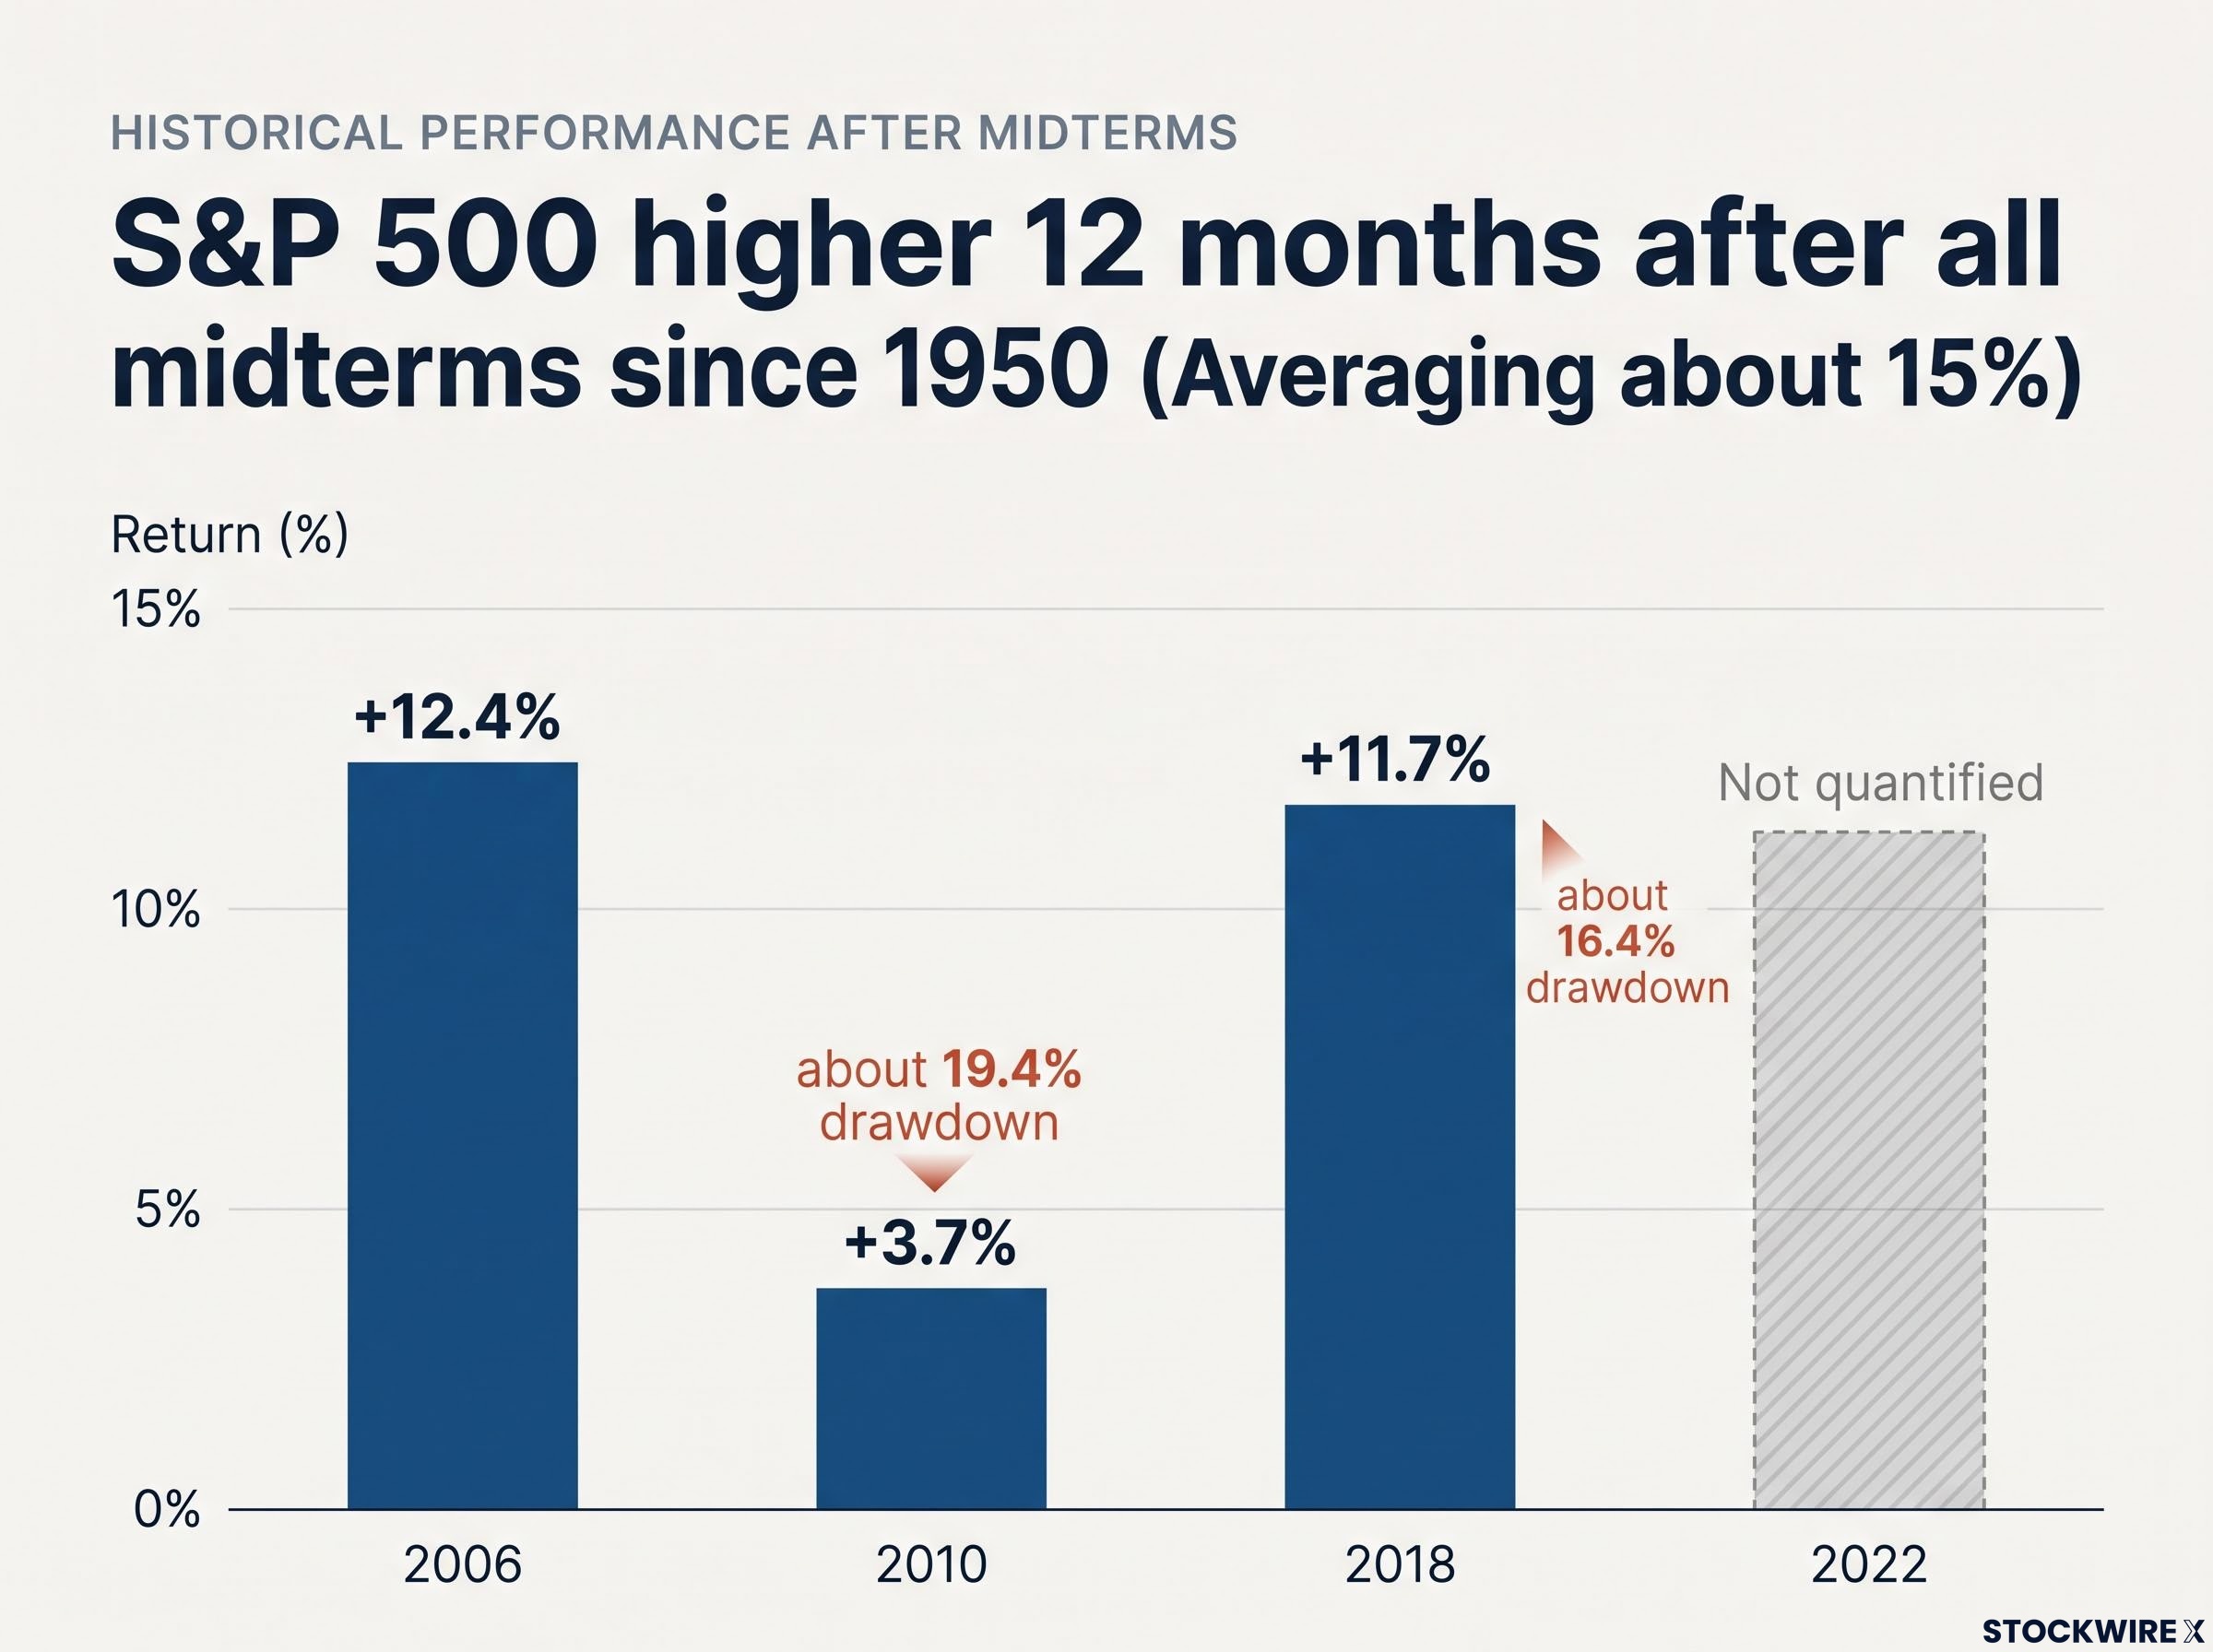
The pattern is straightforward: stocks tend to struggle into midterms, then recover as uncertainty fades. Fidelity’s analysis found average returns of 3.4% in midterm years versus 14.7% the following year. CNBC data shows six-month returns averaging 12.4%, positive in all 13 observations, while TradingView puts the 12-month average at 16.6% (median 16.3%). Methodology varies.
The party label explains little. Pepperstone found 14 of 19 outcomes produced divided government, with average 12-month returns of about 15.1% versus 15.0% for unified control.
The path is rarely smooth, though. Carson Investment Research puts the average peak-to-trough fall in midterm years at 17.5%, against about 11.2%-12.9% in other years.
The seasonal shape of the midterm election cycle, with weakness concentrated in the first half and a recovery from October onward, helps explain why drawdowns and strong 12-month returns have so often coexisted.
Four precedents, four different drivers
| Midterm | Control outcome | 12-month S&P 500 | What actually drove markets |
|---|---|---|---|
| 2006 | Democrats won both chambers | +12.4% | Housing slowdown, early subprime stress |
| 2010 | Republican House, Democratic Senate | +3.7% (about 19.4% drawdown) | QE2, 2011 debt-ceiling fight, US downgrade |
| 2018 | Democratic House, Republican Senate | +11.7% (about 16.4% drawdown) | Fed tightening, US-China trade tensions |
| 2022 | Republican House, Democratic Senate | Not quantified in research | Inflation, Fed tightening, recession fears |
In each case, macro forces outweighed the election. Nineteen observations is a small sample, some early data is reconstructed, and some strategists warn that high 2026 valuations could test the pattern.
The read for you: a constructive 12-month bias, but plan for a drawdown of 16-19% along the way. Past performance does not guarantee future results.
Which factors will matter more than the vote over the next 6 to 12 months?
Election night is over; the variables that decide returns are just getting started. Near-term shocks include jobs data, inflation, oil, Fed guidance and geopolitics. Structural forces include Treasury issuance, the term premium (the extra yield investors demand for holding long-dated bonds), tariffs and the fiscal path.
An NBER working paper on federal borrowing finds that higher debt-to-GDP ratios lift long-term Treasury rates, with most of the effect coming through the term premium, which is why fiscal restraint can pull yields lower.
Divided government does not remove fiscal risk. The administration keeps executive authority over tariffs and existing appropriations, and Capital Economics and other forecasters see a divided Congress limiting major legislation while leaving tariff and regulatory uncertainty intact.
Here is the watch list, ordered by expected near-term impact:
- Senate outcome: a House check alone, or unified Democratic control of Congress.
- Funding and debt-ceiling deadlines: a Democratic House can use them as leverage; the 2011 dispute hurt equities without a default.
- Fed and inflation data: the Fed responds to inflation and jobs, not party control, and post-Iran energy inflation could keep rates high.
- Tariffs and executive action: largely beyond the House’s reach.
- Treasury issuance and term premium: heavy supply can lift long yields regardless of the vote.
- Valuations: elevated multiples and concentrated tech exposure could limit returns.
Most analysts expect a short-lived dollar reaction, with divided Congress the base case and partly priced in. Your portfolio will feel the Senate count, the Fed, inflation and valuations far more than the House result, so monitor those first.
What the early count changes for markets, and what it leaves open
Early Democratic gains point to a Democratic House and a divided, or possibly Democratic, Congress. The overnight bond rally and softer dollar fit lower expectations of deficit-financed stimulus.
Over the next 6-12 months, the Senate result, the Fed’s reaction to inflation and energy prices will carry more weight than the vote. History supports a constructive equity bias after midterms, but the pattern is probabilistic, and large drawdowns have occurred on the way. Results are still early and races are still being called.
This article is for informational purposes only and should not be considered financial advice. Investors should conduct their own research and consult with financial professionals before making investment decisions.