Micron Confirms HBM4 Deal, Then Falls 7.7% in AI Selloff
2 hrs ago

At US$96.20 a barrel and climbing, WTI crude is pricing in something the market has not confronted in years: a live military exchange inside the Strait of Hormuz, the narrow waterway through which roughly 20% of the world’s traded oil moves every day. On 3 June 2026, Iranian forces struck Kuwait and Bahrain with missiles and drones. US forces retaliated with strikes on Qeshm Island and disabled a tanker bound for Kharg Island. The escalation is not a threat assessment or a war game. It is happening now, and energy markets are responding in real time.
What follows covers the military events driving the Iran war oil price shock, which sectors and instruments are moving and why, what the escalation does to Federal Reserve rate-cut expectations for the rest of 2026, and how governments are already scrambling to absorb the impact.
The chain of events started with Iran. Missile and drone strikes hit Kuwait and Bahrain in a coordinated offensive that included a drone strike on Kuwait International Airport’s passenger terminal, killing one person, according to Bloomberg.
The US response came quickly and targeted the chokepoint itself. American forces struck an Iranian military ground control facility on Qeshm Island, positioned inside the Strait of Hormuz, according to NPR and a CENTCOM official release. Separately, a Hellfire missile was fired into the engine room of an oil tanker heading toward Iran’s Kharg Island, disabling the vessel, CENTCOM confirmed.
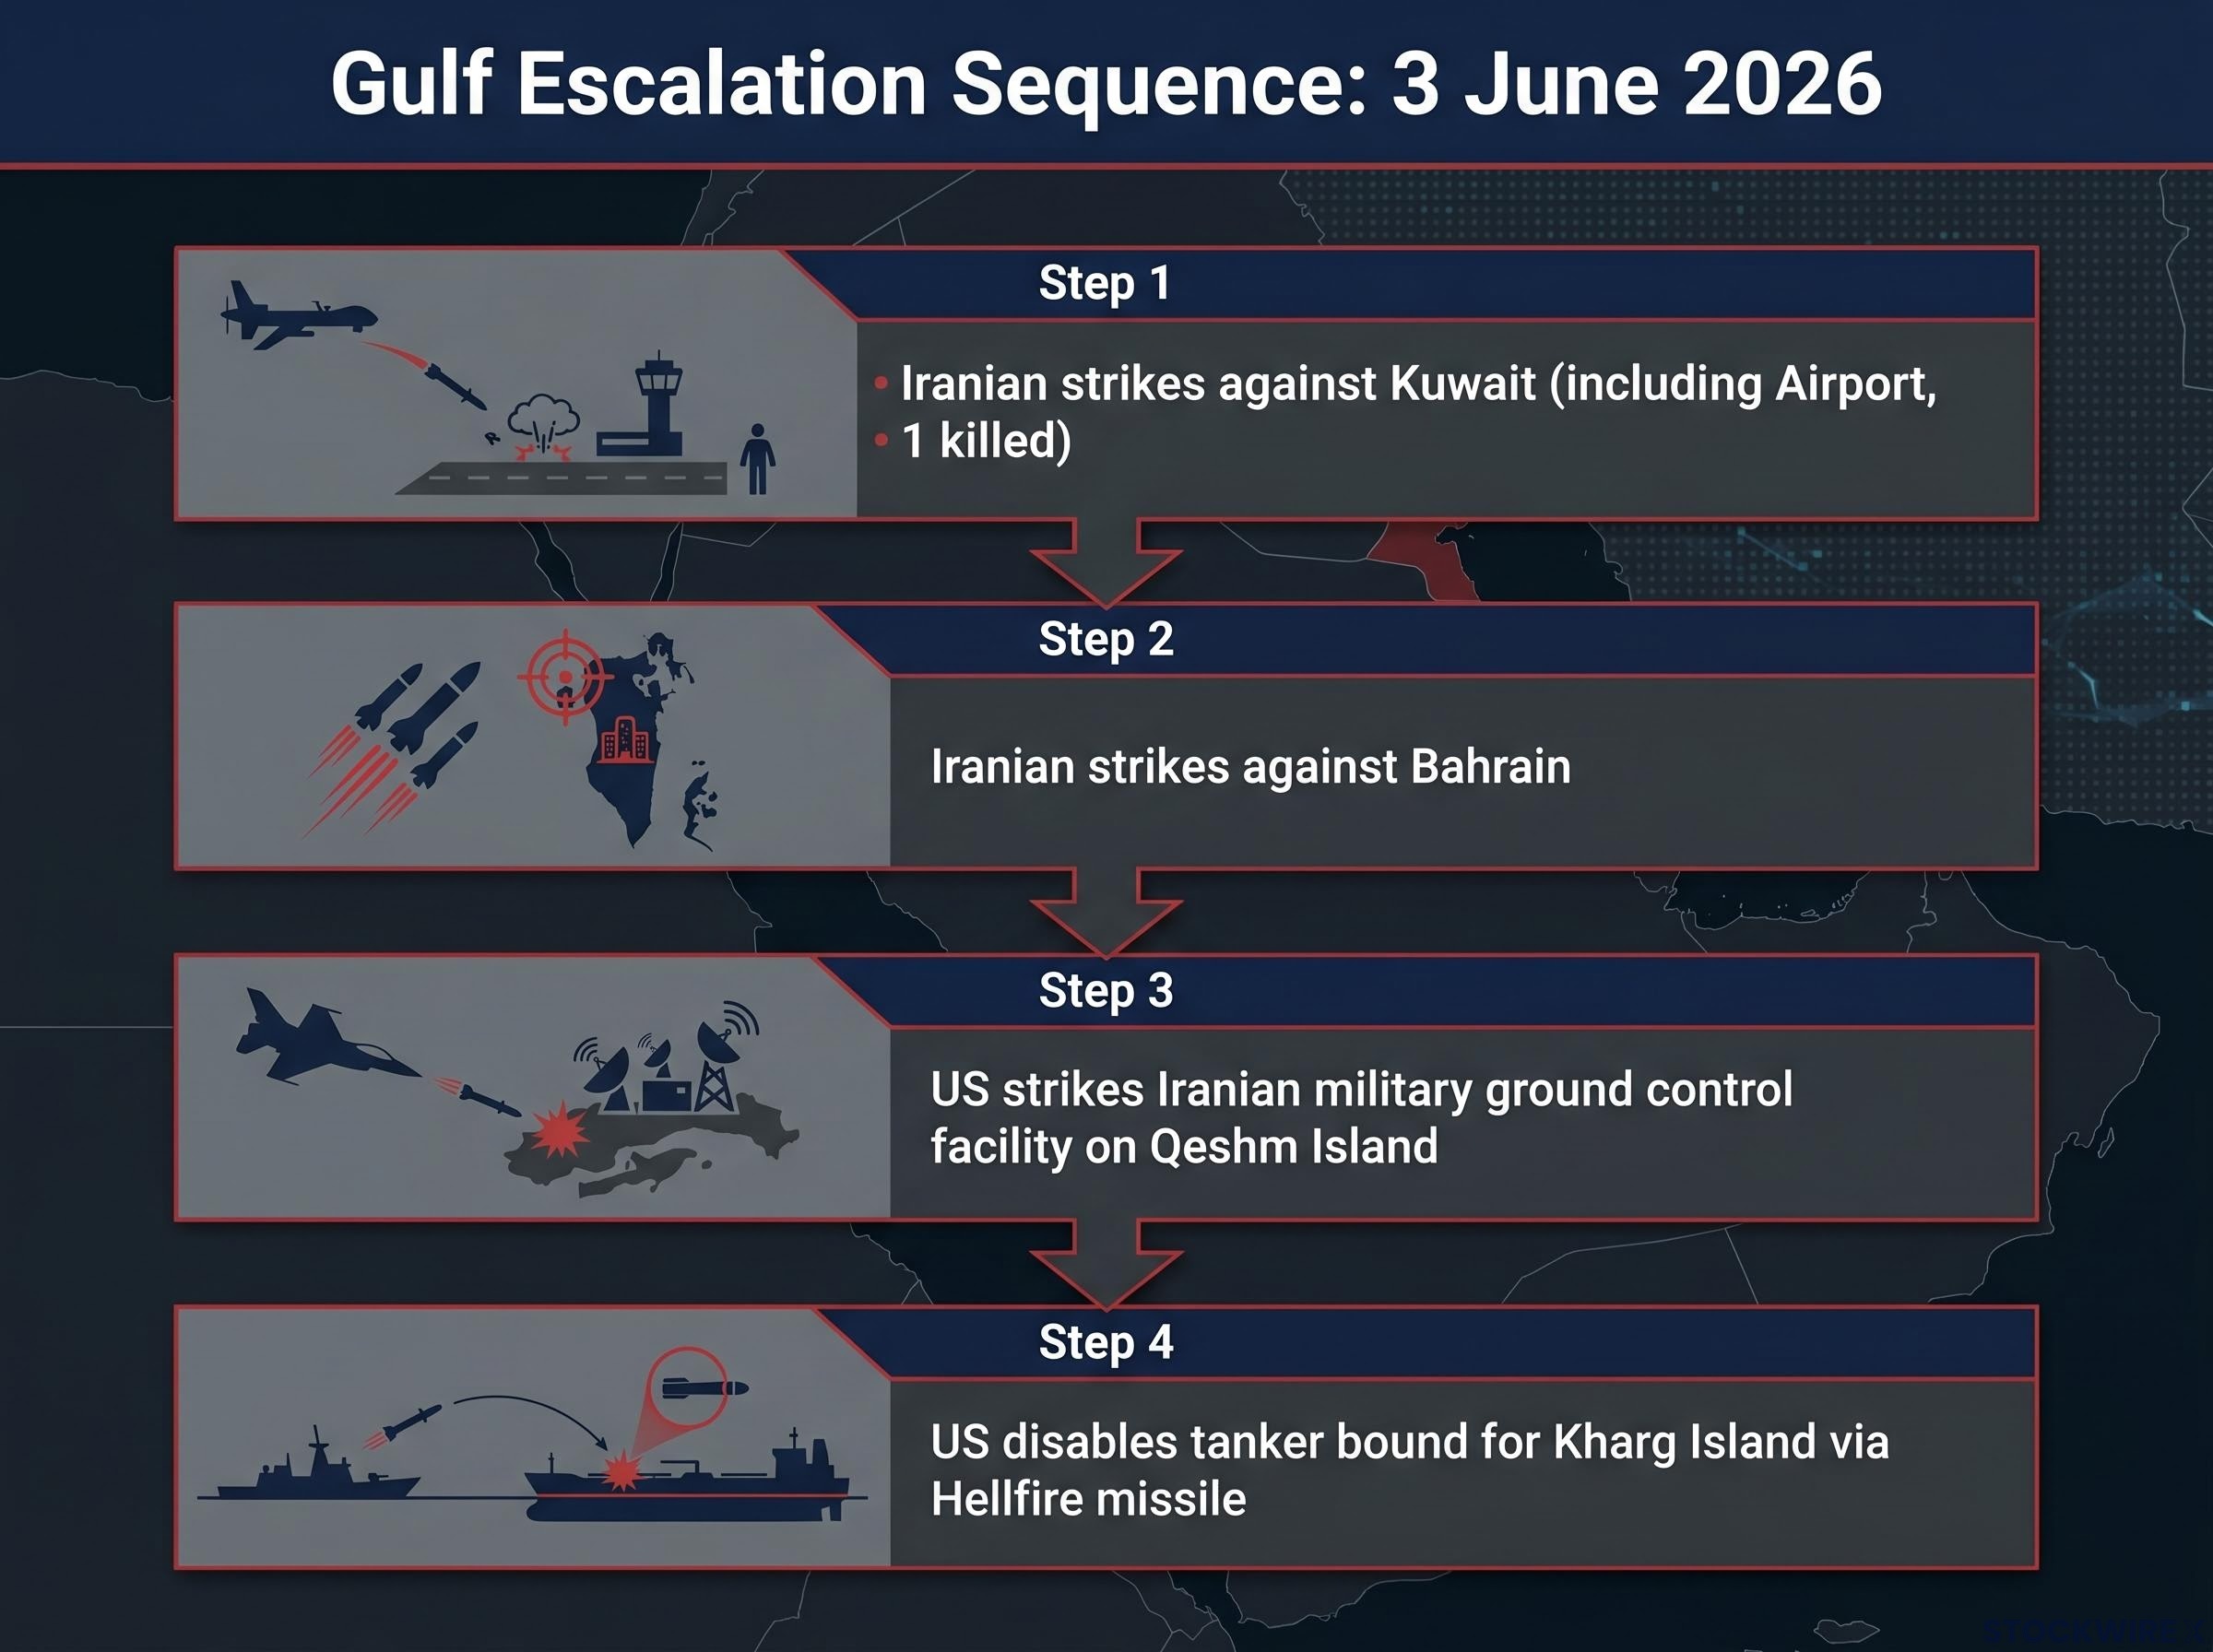
The sequence, in chronological order:
President Trump then offered contradictory signals about how long the disruption might last. He suggested a diplomatic agreement could come together relatively quickly, while simultaneously acknowledging the Iran blockade may extend further.
Trump indicated the blockade could extend beyond Labor Day, a signal that the disruption’s timeline remains measured in months, not days. (New York Post)
Each retaliatory step raises the probability of prolonged supply disruption. Investors need to distinguish between a single-incident price spike and an escalating confrontation with no clear end date.
The Strait of Hormuz is a narrow waterway separating Iran from Oman, connecting the Persian Gulf to the Gulf of Oman and from there to the broader global tanker network. It is not wide. At its narrowest point, shipping lanes compress into corridors that leave little room for deviation, and any military presence along its banks can exert direct control over transit.
The numbers explain why it matters:
The EIA World Oil Transit Chokepoints report measured Hormuz throughput at an average of 20.9 million barrels per day in the first half of 2025, representing approximately 20% of global petroleum liquids consumption and one quarter of all maritime traded oil, figures that put the current military exchange directly inside the world’s single most consequential supply node.
Qeshm Island sits inside the strait itself. The US strike on an Iranian facility there was not a strike on a distant military base. It was a strike on infrastructure positioned to monitor and influence the lanes through which tankers pass daily.
No viable rerouting option replaces Strait of Hormuz volume at equivalent speed or cost. The Cape of Good Hope route around southern Africa is the only major alternative, and it adds approximately two weeks of transit time per voyage, compressing tanker availability globally.
Saudi Arabia operates an East-West pipeline that can bypass the strait, but it carries only a fraction of total regional throughput. A full closure would leave the market short of millions of barrels per day with no near-term substitute.
Bypass route capacity was further compromised in early May when Iranian strikes hit the Fujairah Oil Industry Zone, one of the few active pipeline corridors circumventing the strait, meaning the rerouting constraints the current disruption faces are measurably worse than those present at the start of the conflict.
The sector performance data from 3 June 2026 tells the story of a market repricing for sustained energy disruption. Energy led all sectors with a +1.38% gain, while Information Technology fell -1.52%, the widest single-day divergence between the two sectors in months.
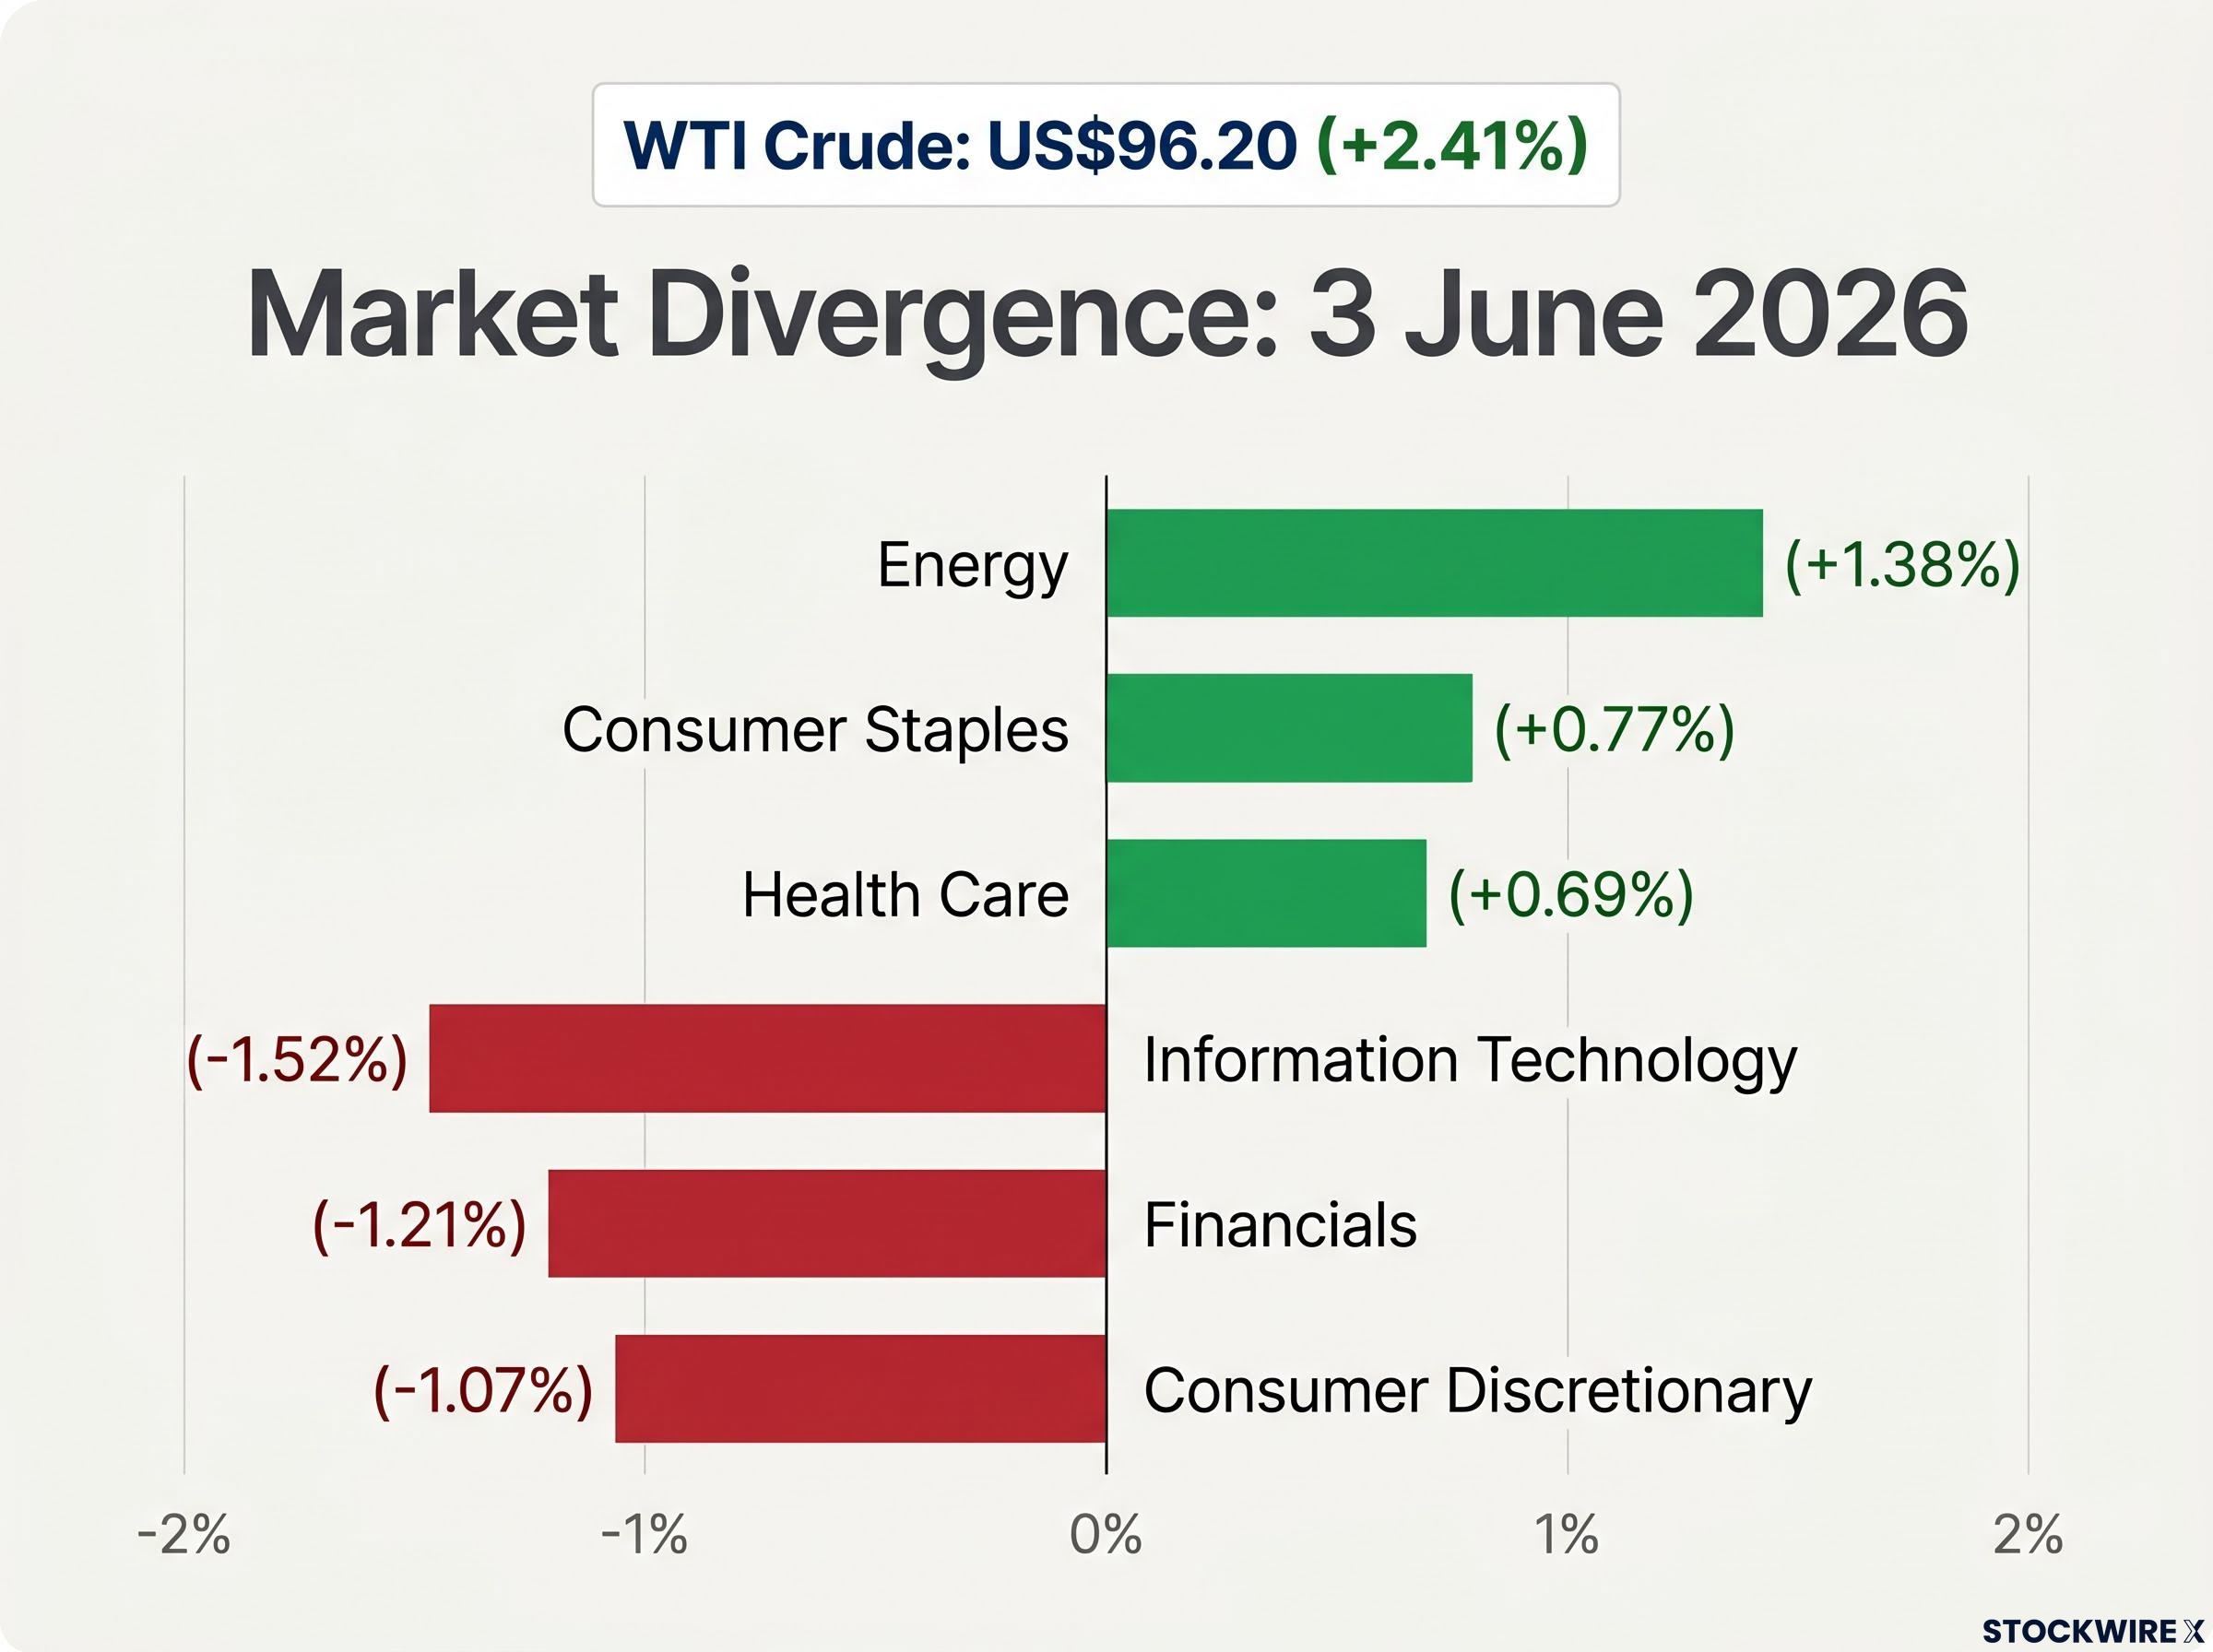
WTI crude: US$96.20, +2.41% on 3 June 2026
| Sector | 3 June 2026 Performance |
|---|---|
| Energy | +1.38% |
| Consumer Staples | +0.77% |
| Health Care | +0.69% |
| Materials | +0.24% |
| Real Estate | +0.09% |
| Industrials | -0.10% |
| Communication Services | -0.18% |
| Utilities | -0.54% |
| Consumer Discretionary | -1.07% |
| Financials | -1.21% |
| Information Technology | -1.52% |
The pattern is a flight to defensives. Consumer Staples (+0.77%) and Health Care (+0.69%) outperformed because investors rotated away from growth exposure and into sectors whose earnings are less sensitive to energy input costs or macroeconomic uncertainty. Energy sector ETFs and related equities were among the few areas posting broad gains, reflecting direct commodity exposure.
Financials (-1.21%) fell alongside tech, weighed by the implications of a prolonged rate-hold environment. The divergence between sectors shows the real-time portfolio reshuffling already underway, and it is directionally consistent with how capital has moved during previous oil supply shocks.
The Federal Reserve did not create this problem, but it now has to navigate it. Elevated oil prices feed directly into headline inflation through fuel costs, transport costs, and input prices across the supply chain. That transmission chain constrains the Fed’s ability to cut rates without risking an inflation resurgence.
The bond market is already pricing this constraint:
Bond markets assigned a 77% probability that the Fed holds rates unchanged at its December 2026 meeting, with the implied target range at 3.50%-3.75%. (Yahoo Finance, 3 June 2026)
The three-step transmission mechanism is straightforward:
The policy tension is stark. The Fed would ordinarily prefer to ease into a risk-off equity environment where growth stocks are selling off and defensive positioning is rising. But oil-driven inflation pressure pulls in the opposite direction, boxing policymakers into holding rates steady even as equity markets weaken.
For US investors, the rate outlook shapes everything from mortgage rates to equity valuations to bond positioning. An oil shock that delays Fed cuts is a second-order effect that extends well beyond the energy sector.
Investors who want to understand the internal mechanics shaping this constraint will find our deep-dive into the April FOMC dissent, which covers how a historic four-way committee split reflects a genuine dual-mandate conflict between 3.5% PCE inflation and rising unemployment that the Fed’s standard tools are not built to resolve simultaneously.
The oil shock has already moved beyond financial markets and into sovereign fiscal policy. Japanese Prime Minister Takaichi finalised a supplementary budget worth approximately US$19 billion directed at subsidising surging fuel costs arising from Gulf hostilities, Reuters reported around 2 June 2026.
Japan’s supplementary budget: approximately US$19 billion, the largest single-country fiscal response to the Gulf disruption disclosed so far.
The budget signals two things:
Physical oil markets were described as continuing to tighten as nations draw down on strategic petroleum reserves. Japan’s response sits within a broader sovereign scramble to absorb the economic consequences of a contested chokepoint.
Strategic petroleum reserves have been drawn down at double the record pace seen in prior disruptions, with IEA data pointing to roughly 800 million barrels of usable buffer remaining globally and no supply-demand rebalancing expected before October 2026, which means government spending responses like Japan’s are absorbing a shock that physical reserve releases cannot arrest.
For investors, large-scale government fiscal responses historically accompany the kind of supply shocks that persist long enough to alter earnings forecasts, consumer spending patterns, and central bank calculations across multiple quarters.
This article is for informational purposes only and should not be considered financial advice. Investors should conduct their own research and consult with financial professionals before making investment decisions.
The structural parallel to the 1990-1991 Gulf War is visible: military conflict in the Gulf, chokepoint risk, and rapid crude price movement. During that conflict, oil spiked sharply on the Iraqi invasion of Kuwait and then reversed quickly once Desert Storm concluded with a clear military outcome.
The current situation carries a different duration profile. Trump’s acknowledgement that the Iran blockade may extend beyond Labor Day introduces an open-ended timeline that the 1990-1991 playbook did not feature. WTI at US$96.20 is the starting point, not the ceiling, if the disruption persists through the northern hemisphere summer.
The Hormuz risk premium has historically collapsed rapidly after ceasefire announcements, but the near-total withdrawal of commercial war-risk insurance from the strait signals a structural dislocation that diplomatic agreements alone cannot immediately repair, with VLCC daily hire rates tracking around $110,000 as physical market confirmation.
Two scenarios frame the range of outcomes:
No external analyst has published WTI price targets conditional on an extended Hormuz disruption in verified sourcing. The range of outcomes remains genuinely wide.
Past performance does not guarantee future results. Financial projections are subject to market conditions and various risk factors.
If the blockade extends, the beneficiaries and casualties diverge further from the 3 June snapshot. Energy producers and energy infrastructure companies stand to gain from sustained elevated pricing. Airlines and consumer discretionary names face the most direct margin compression from prolonged fuel costs they cannot pass through quickly. Financials remain under pressure if rate-cut expectations compress further, as the revenue uplift from higher rates has already been priced in while the lending slowdown has not.
WTI at US$96.20 reflects genuine supply risk. The sector rotation underway, with energy gaining +1.38% while technology shed -1.52%, is directionally consistent with historical oil shock patterns. The Fed is boxed in by inflation transmission risk, with a 77% probability of holding rates through December 2026. Governments are already spending; Japan’s US$19 billion supplementary budget confirms the shock has reached the real economy.
The central uncertainty remains duration. The difference between a week and a summer of disruption determines whether this is a sector trade or a structural portfolio shift. Trump’s Labor Day comment is the clearest signal available, and it points toward the longer end of that range.
Two things to watch from here:
These statements are speculative and subject to change based on market developments and geopolitical conditions.
The Iran war oil price shock refers to the rapid crude oil price spike following Iranian missile and drone strikes on Kuwait and Bahrain on 3 June 2026, and subsequent US retaliatory strikes inside the Strait of Hormuz. Because roughly 20% of the world's traded oil transits the strait daily, military activity there directly threatens global supply and pushes prices higher.
The Strait of Hormuz is the only sea passage connecting Persian Gulf oil producers to global shipping routes, handling approximately 20.9 million barrels per day or about 20% of global petroleum liquids consumption. There is no substitute route that can replace that volume at equivalent speed or cost, meaning any disruption there immediately tightens global oil supply.
Higher oil prices feed into headline inflation through fuel, transport, and supply chain costs, which reduces the Fed's ability to cut rates without risking an inflation resurgence. As of 3 June 2026, bond markets were pricing a 77% probability that the Fed holds rates unchanged at its December 2026 meeting, with the implied target range at 3.50%-3.75%.
Energy was the top-performing sector on 3 June 2026, gaining 1.38%, while Information Technology fell 1.52% and Financials dropped 1.21%, reflecting a classic flight to defensives. Airlines and consumer discretionary companies face the most direct margin compression from sustained high fuel costs.
Japan approved approximately US$19 billion in emergency spending to subsidise surging fuel costs arising from Gulf hostilities, and analysts noted that governments do not approve emergency spending at that scale for disruptions expected to resolve within days, suggesting sovereign policymakers are preparing for a prolonged supply shock.