Lululemon Fundamental Analysis: the Price of Brand Dilution
26 mins ago

The immediate market reaction to the 29 April 2026 financial disclosure delivered a clear verdict, with Etsy shares surging following an unexpected revenue beat. This initial analysis of the Etsy earnings results reveals a platform finally breaking from a prolonged 24-month period of operational stagnation. The transition back to positive sequential growth marks a critical inflection point for the broader United States e-commerce sector.
During the past two years, digital marketplaces faced severe headwinds from shifting consumer spending habits and persistent inflation. Market participants are now pricing in a fundamentally different trajectory for the platform based on this quarter’s resilience. What follows is a detailed breakdown of the underlying drivers powering this turnaround.
This evaluation separates the immediate financial windfall from the structural changes currently influencing the company’s long-term profitability. Understanding these mechanics is required for assessing forward valuations.
The newly released financial figures establish a decisive break from prior quarters of stagnation. According to early reports, total quarterly income reached $631.3 million, outpacing the $621.1 million consensus estimate by 1.6%. According to early reports, this top-line expansion was primarily catalysed by strong Gross Merchandise Sales, which hit $2.5 billion and represented a 5.5% year-on-year expansion.
Core digital storefront income mirrored this momentum, increasing by 7.6% annually. These quantifiable metrics allow retail investors to see that the stock surge is rooted in fundamental performance rather than speculative optimism.
| Metric | Q1 2026 Actual | Wall Street Consensus | Variance |
|---|---|---|---|
| Total Income | $631.3M | $621.1M | +1.6% |
| Gross Merchandise Sales | $2.5B | $2.37B | +5.5% YoY |
| Earnings Per Share | $0.60 | $0.61 | -$0.01 |
| Adjusted EBITDA | $185M | N/A | 29.3% Margin |
The revenue outperformance stood in slight contrast to the bottom line. According to early reports, earnings per share of $0.60 marginally missed the predicted $0.61.
According to early reports, the platform generated an adjusted EBITDA of $185 million, yielding a 29.3% profitability margin. This margin profile reflects stringent cost controls implemented across corporate operations over the past twelve months. Management has successfully decoupled revenue growth from proportional increases in operating expenses.
Similar margin protection initiatives are becoming standard across the retail sector, with major consumer brands increasingly relying on strict cost control and strategic turnaround initiatives to sustain profitability amid unpredictable sales environments.
The slight earnings per share shortfall is largely absorbed by the market, as investors heavily weight the top-line growth and disciplined expenditure management. Maintaining a margin near 30% demonstrates strong pricing power within the niche e-commerce space.
Stepping back from the immediate earnings frenzy provides an opportunity to clarify the core metrics driving e-commerce valuations. Digital marketplace structures require investors to separate the total volume of goods traded from the actual money the company keeps. Wall Street analysts consistently prioritise transaction volume growth over immediate profitability, as scale dictates long-term market dominance.
This structural dynamic applies across the broader digital economy, where social commerce platform models require massive upfront transaction volumes before operating leverage eventually activates to deliver meaningful earnings improvements.
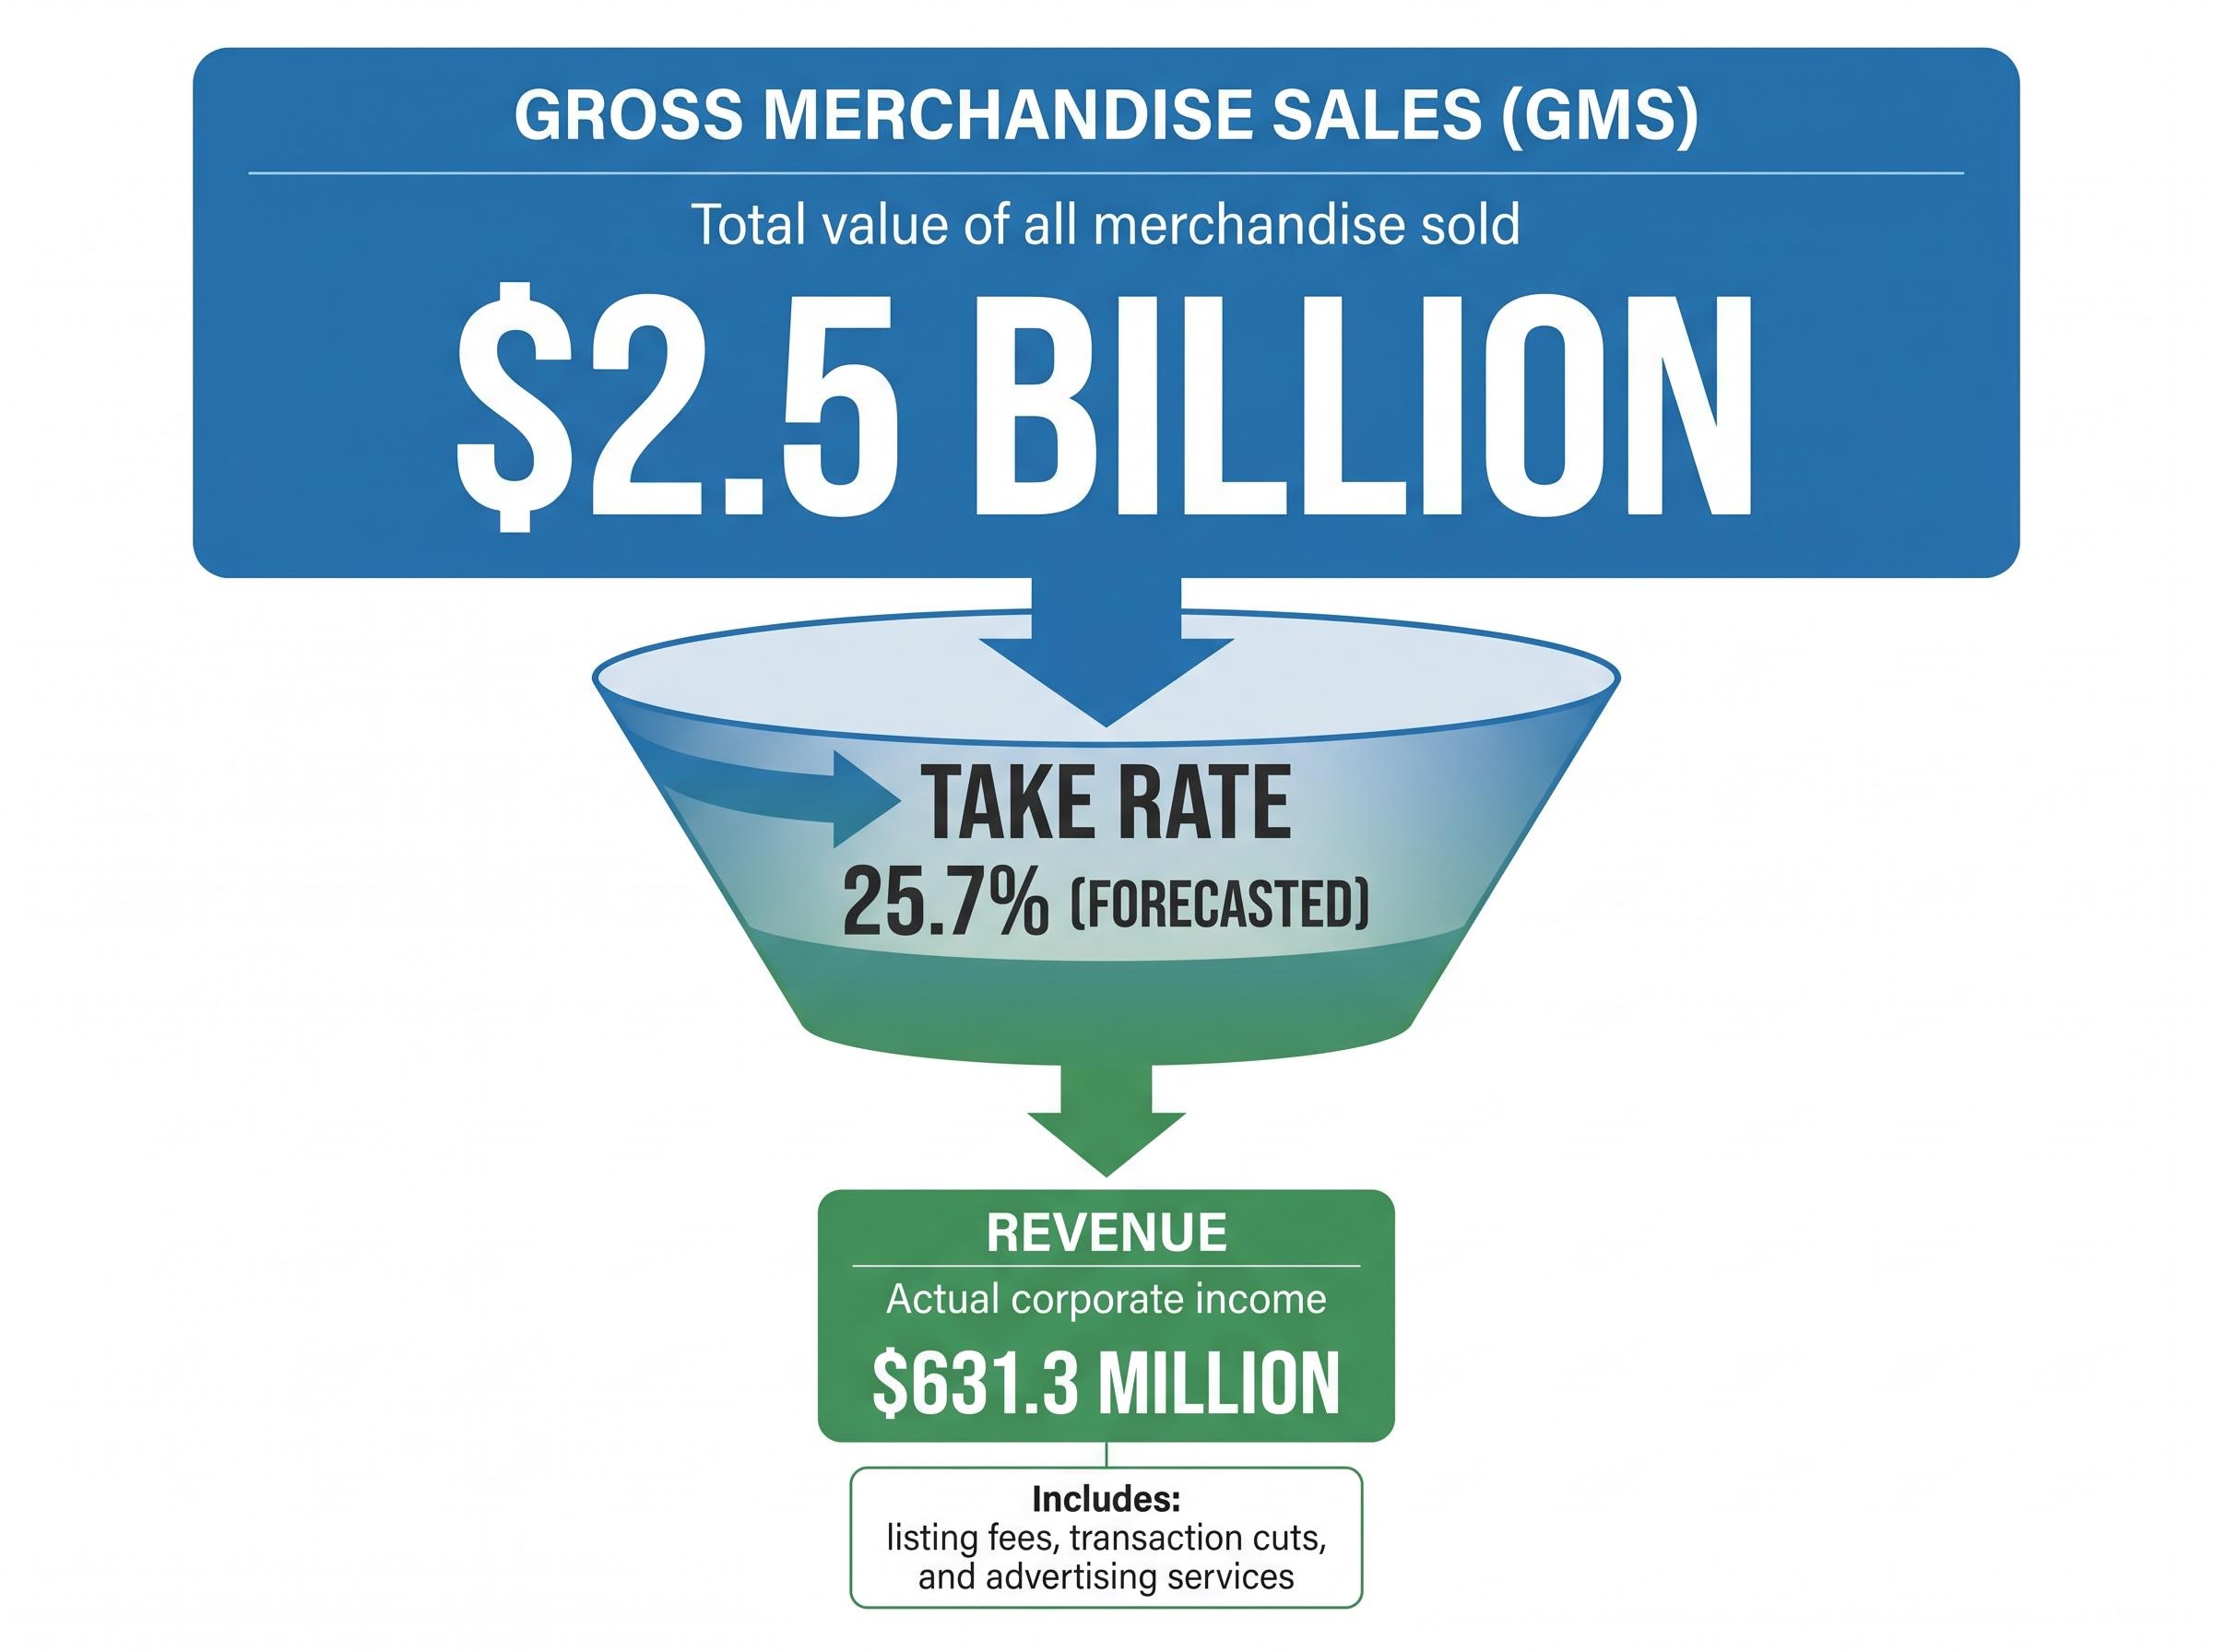
The distinction between these figures explains why market sentiment shifts so sharply on specific operational data points. The platform recorded $2.5 billion in total goods transacted, but the actual recorded corporate income was a much smaller fraction at $631.3 million. Understanding this gap is fundamental to evaluating platform economics.
Gross Merchandise Sales (GMS): This represents the total dollar value of all merchandise sold across the platform, indicating overall consumer demand and ecosystem health. Revenue: This metric reflects the actual corporate income the company earns from those sales, primarily through listing fees, transaction cuts, and advertising services. * Take Rate: This percentage is the translation mechanism between GMS and revenue, representing the exact portion of transaction volume the platform captures as corporate income.
According to early reports, the platform has forecasted a 25.7% take rate for upcoming quarters. Equipping retail investors with this foundational financial literacy prevents confusion between total platform activity and actual corporate earnings. A higher take rate allows the company to generate more income without necessarily increasing total user sales.
Financial metrics provide the structural framework, but human behaviour validates the overarching management strategy. The platform achieved positive quarter-on-quarter active shopper growth for the first time in 24 months. This milestone signals a healthier ecosystem and serves as the most critical leading indicator for sustained future performance.
The expansion in active merchants and fresh purchasers directly connects to broader consumer spending resilience within the United States. The final quarter of 2025 saw a 0.5% contraction in active users, making this current reversal structurally significant for the brand.
The company recorded positive annual gains across three distinct operational categories. Fresh purchasers are entering the ecosystem at higher rates, active merchants are listing more inventory, and the average spending per individual consumer has increased. This multi-layered growth suggests a fundamental improvement in platform utility.
Management Commentary “The return to sequential user growth demonstrates that recent platform enhancements are successfully aligning with shifting consumer purchasing habits, validating our core strategic focus.”
This behavioural shift demonstrates that the financial outperformance is not a mathematical anomaly. It is driven by actual consumer adoption and renewed engagement with the digital storefront.
Corporate strategy often requires subtraction to enable future operational addition. On 18 February 2026, the company announced an agreement to sell the fashion resale app Depop to competitor eBay for $1.2 billion. This divestiture removes the subsidiary from the balance sheet, explicitly excluding Depop figures from the current core financial summaries.
Removing this asset narrows the corporate reporting scope while clarifying the fundamental health of the primary business. The strategic rationale centres on shedding the fashion resale app to double down on the primary artisan marketplace. A smaller, more focused portfolio will likely yield a stronger core business in the coming quarters.
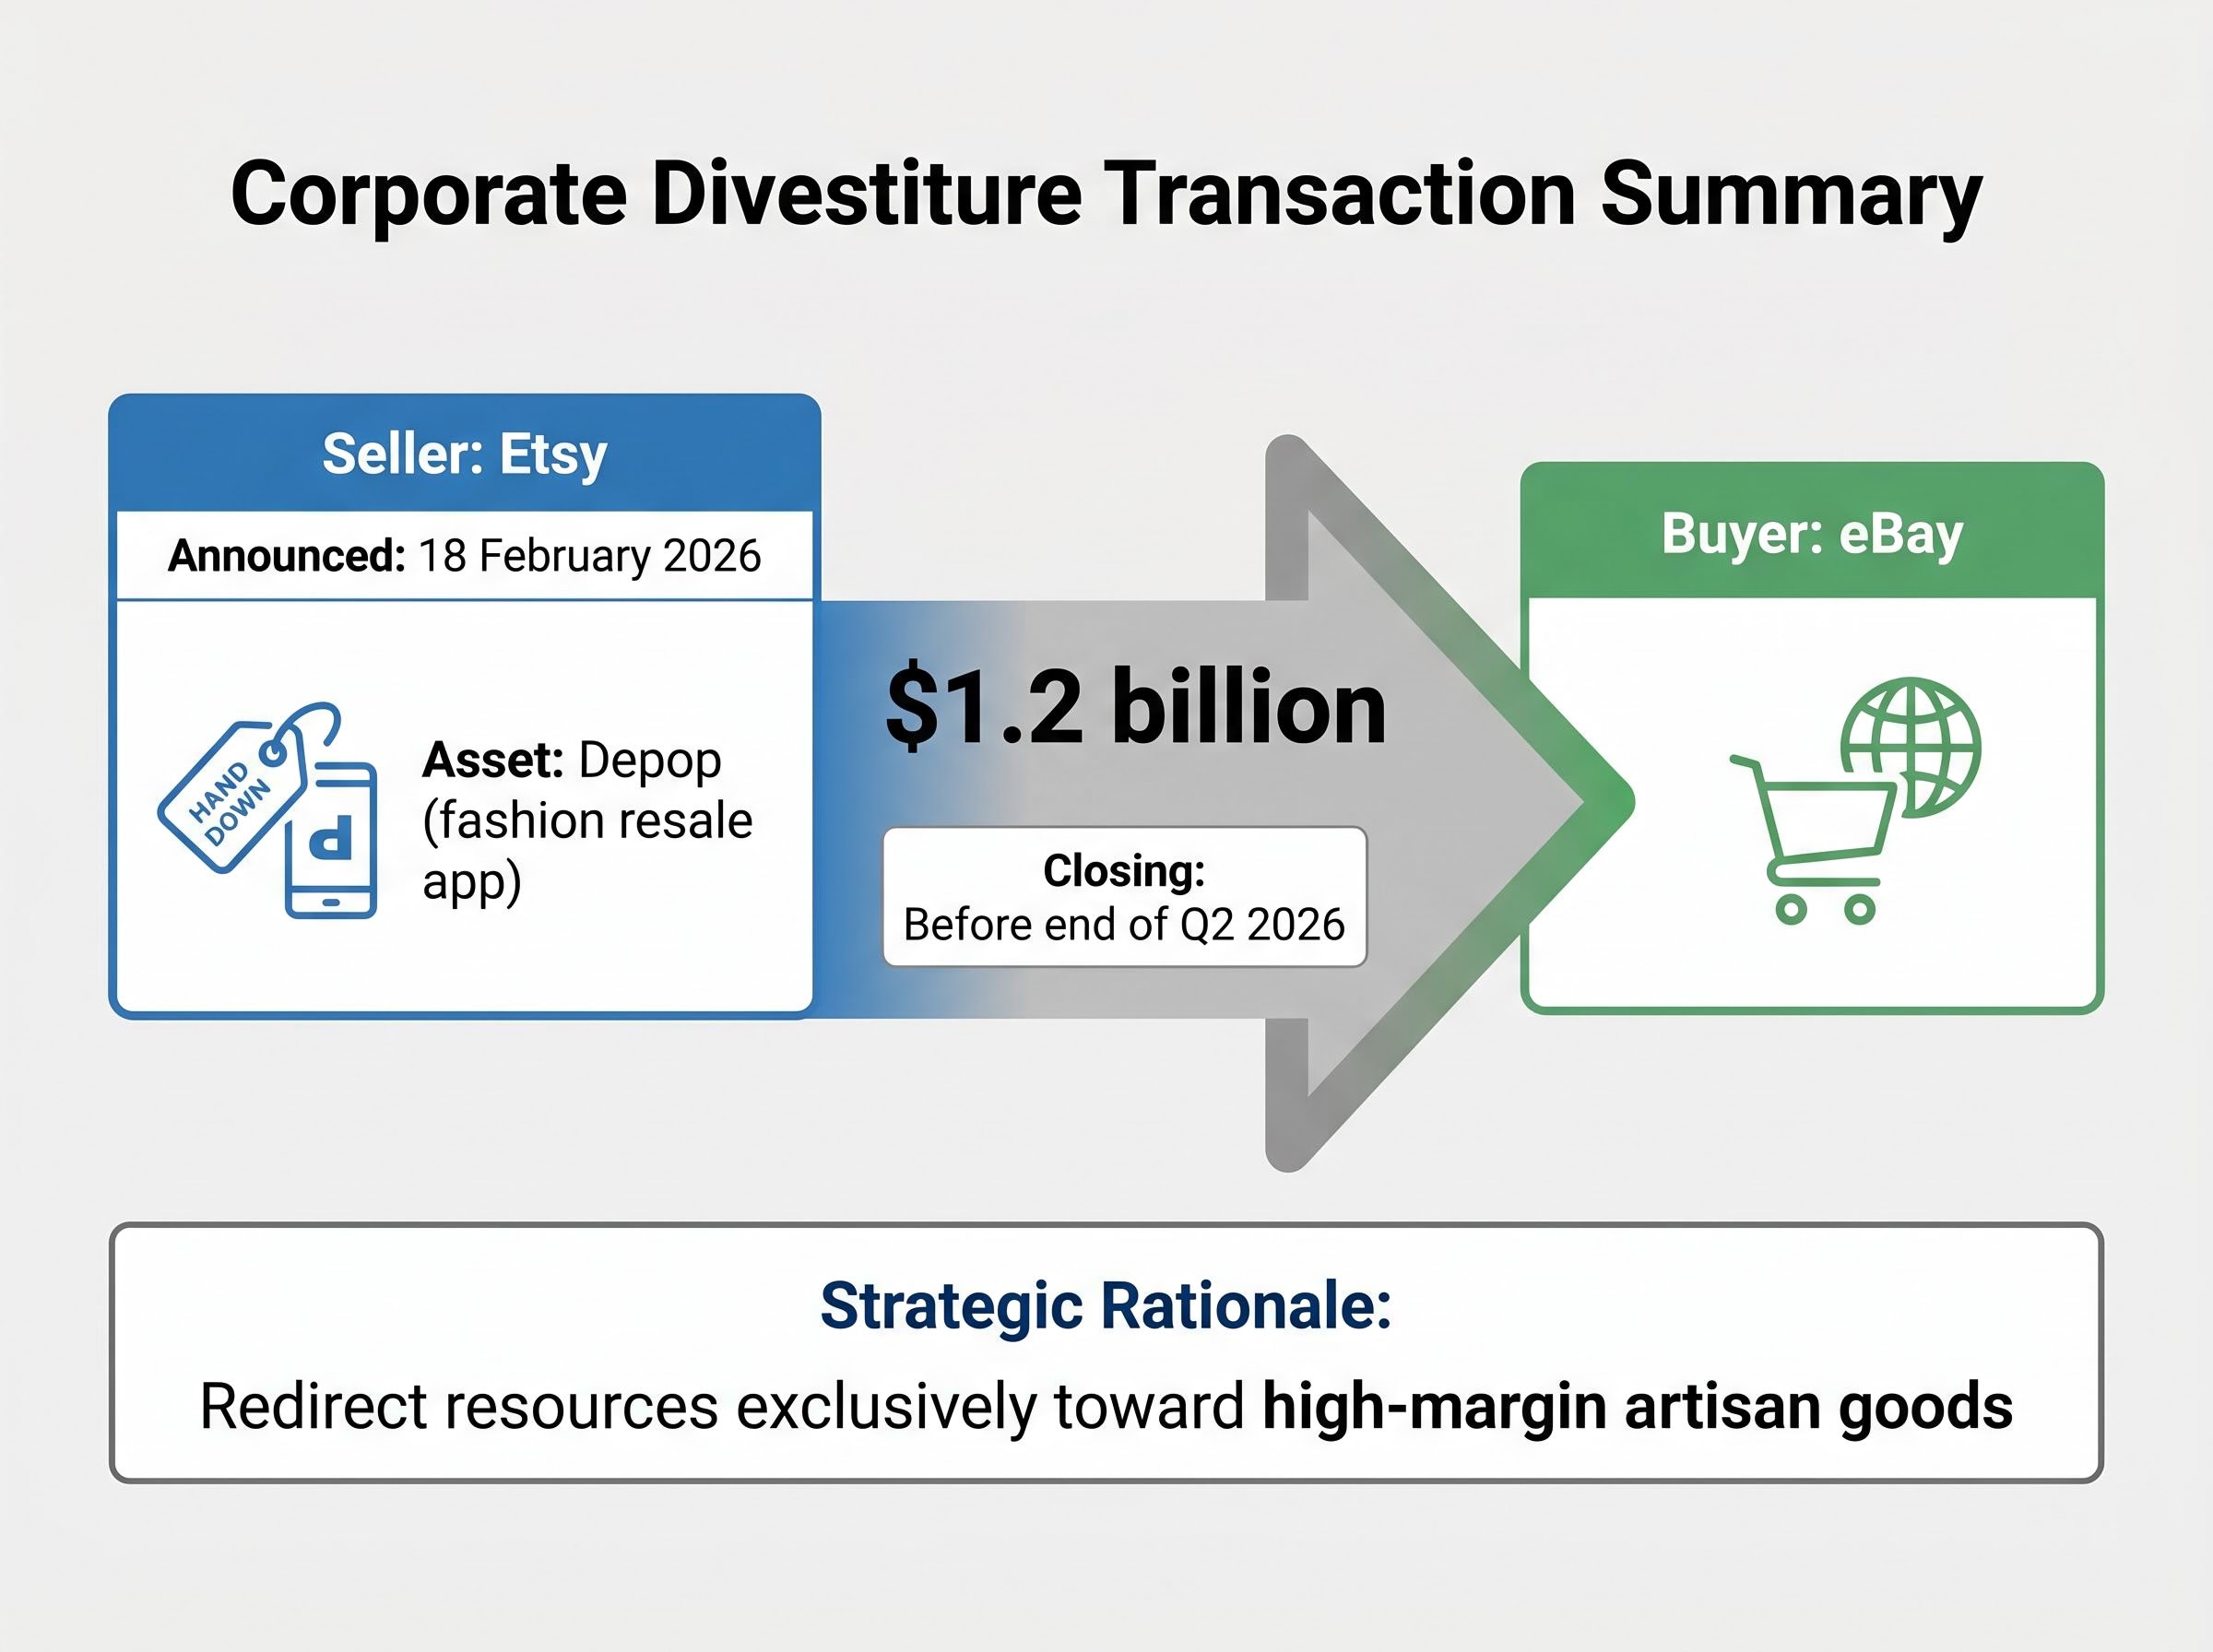
The transaction is projected to officially close within a defined window before the end of Q2 2026. Offloading Depop significantly alters the competitive dynamic with eBay, effectively transferring the operational burden of the saturated fashion resale sector. This allows management to redirect resources exclusively toward high-margin artisan goods.
This move highlights a broader corporate shift toward a singular brand focus. Investors are closely watching how capital reallocation from this $1.2 billion divestiture might fund future shareholder returns or core platform investments.
While Etsy is shedding secondary assets to focus on its core operations, other players in the global artisan space are actively expanding through targeted moves to consolidate independent creator marketplaces and capture regional market share.
Synthesising the immediate results with forward-looking promises provides a clearer view of the structural challenges ahead in the calendar year. Management has revised transaction volume forecasts upward, signalling a renewed confidence level in the core business model. This outlook translates historical earnings data into an actionable roadmap for investors evaluating current market valuations.
However, potential macroeconomic headwinds could still impact the realisation of these single-digit growth targets. Shifts in consumer discretionary spending, inflationary pressures, or supply chain bottlenecks remain present risks for the remainder of the year. The executive team has established three main pillars of future guidance to anchor market expectations.
These targets give analysts a concrete benchmark for the upcoming summer months. If economic pressures mount, the platform will need to rely heavily on its increased take rate to protect those profitability margins.
For investors wanting to better understand the broader macroeconomic threats that could impact these projections, our detailed coverage of escalating US recession risk explores how rapidly depleting household savings and collapsing consumer sentiment are creating hidden vulnerabilities across the retail sector.
The combination of unexpected revenue growth, a streamlined corporate structure, and returning consumer engagement positions the company well for the remainder of 2026. The immediate financial jump is highly significant, particularly the reversal of the 24-month user stagnation trend.
However, the true test for long-term investors remains execution. Management must successfully complete the Depop handover while simultaneously maintaining the fragile sequential user growth recorded this quarter. As the summer months approach, market observers should monitor whether the anticipated consumer resilience holds steady against broader economic pressures.
This article is for informational purposes only and should not be considered financial advice. Past performance does not guarantee future results.
Financial projections are subject to market conditions and various risk factors. Investors should conduct their own research and consult with financial professionals before making investment decisions.
Gross Merchandise Sales (GMS) represents the total dollar value of all goods sold on Etsy's platform, indicating overall consumer demand and ecosystem health, which analysts often prioritize for long-term market dominance.
Etsy's Q1 2026 total income of $631.3 million outpaced consensus estimates by 1.6%, driven by strong Gross Merchandise Sales, though earnings per share marginally missed predictions.
Etsy is selling the Depop fashion resale app to eBay for $1.2 billion to streamline its corporate structure and refocus resources exclusively on its high-margin primary artisan marketplace.
Etsy projects Q2 transaction volumes between $2.48 billion and $2.53 billion, representing a 3% to 5% estimated yearly increase, with adjusted EBITDA margins forecasted between 27% and 29%.
The take rate is the percentage of Gross Merchandise Sales that Etsy captures as corporate income, meaning a higher take rate allows the company to generate more revenue without necessarily increasing total user sales.