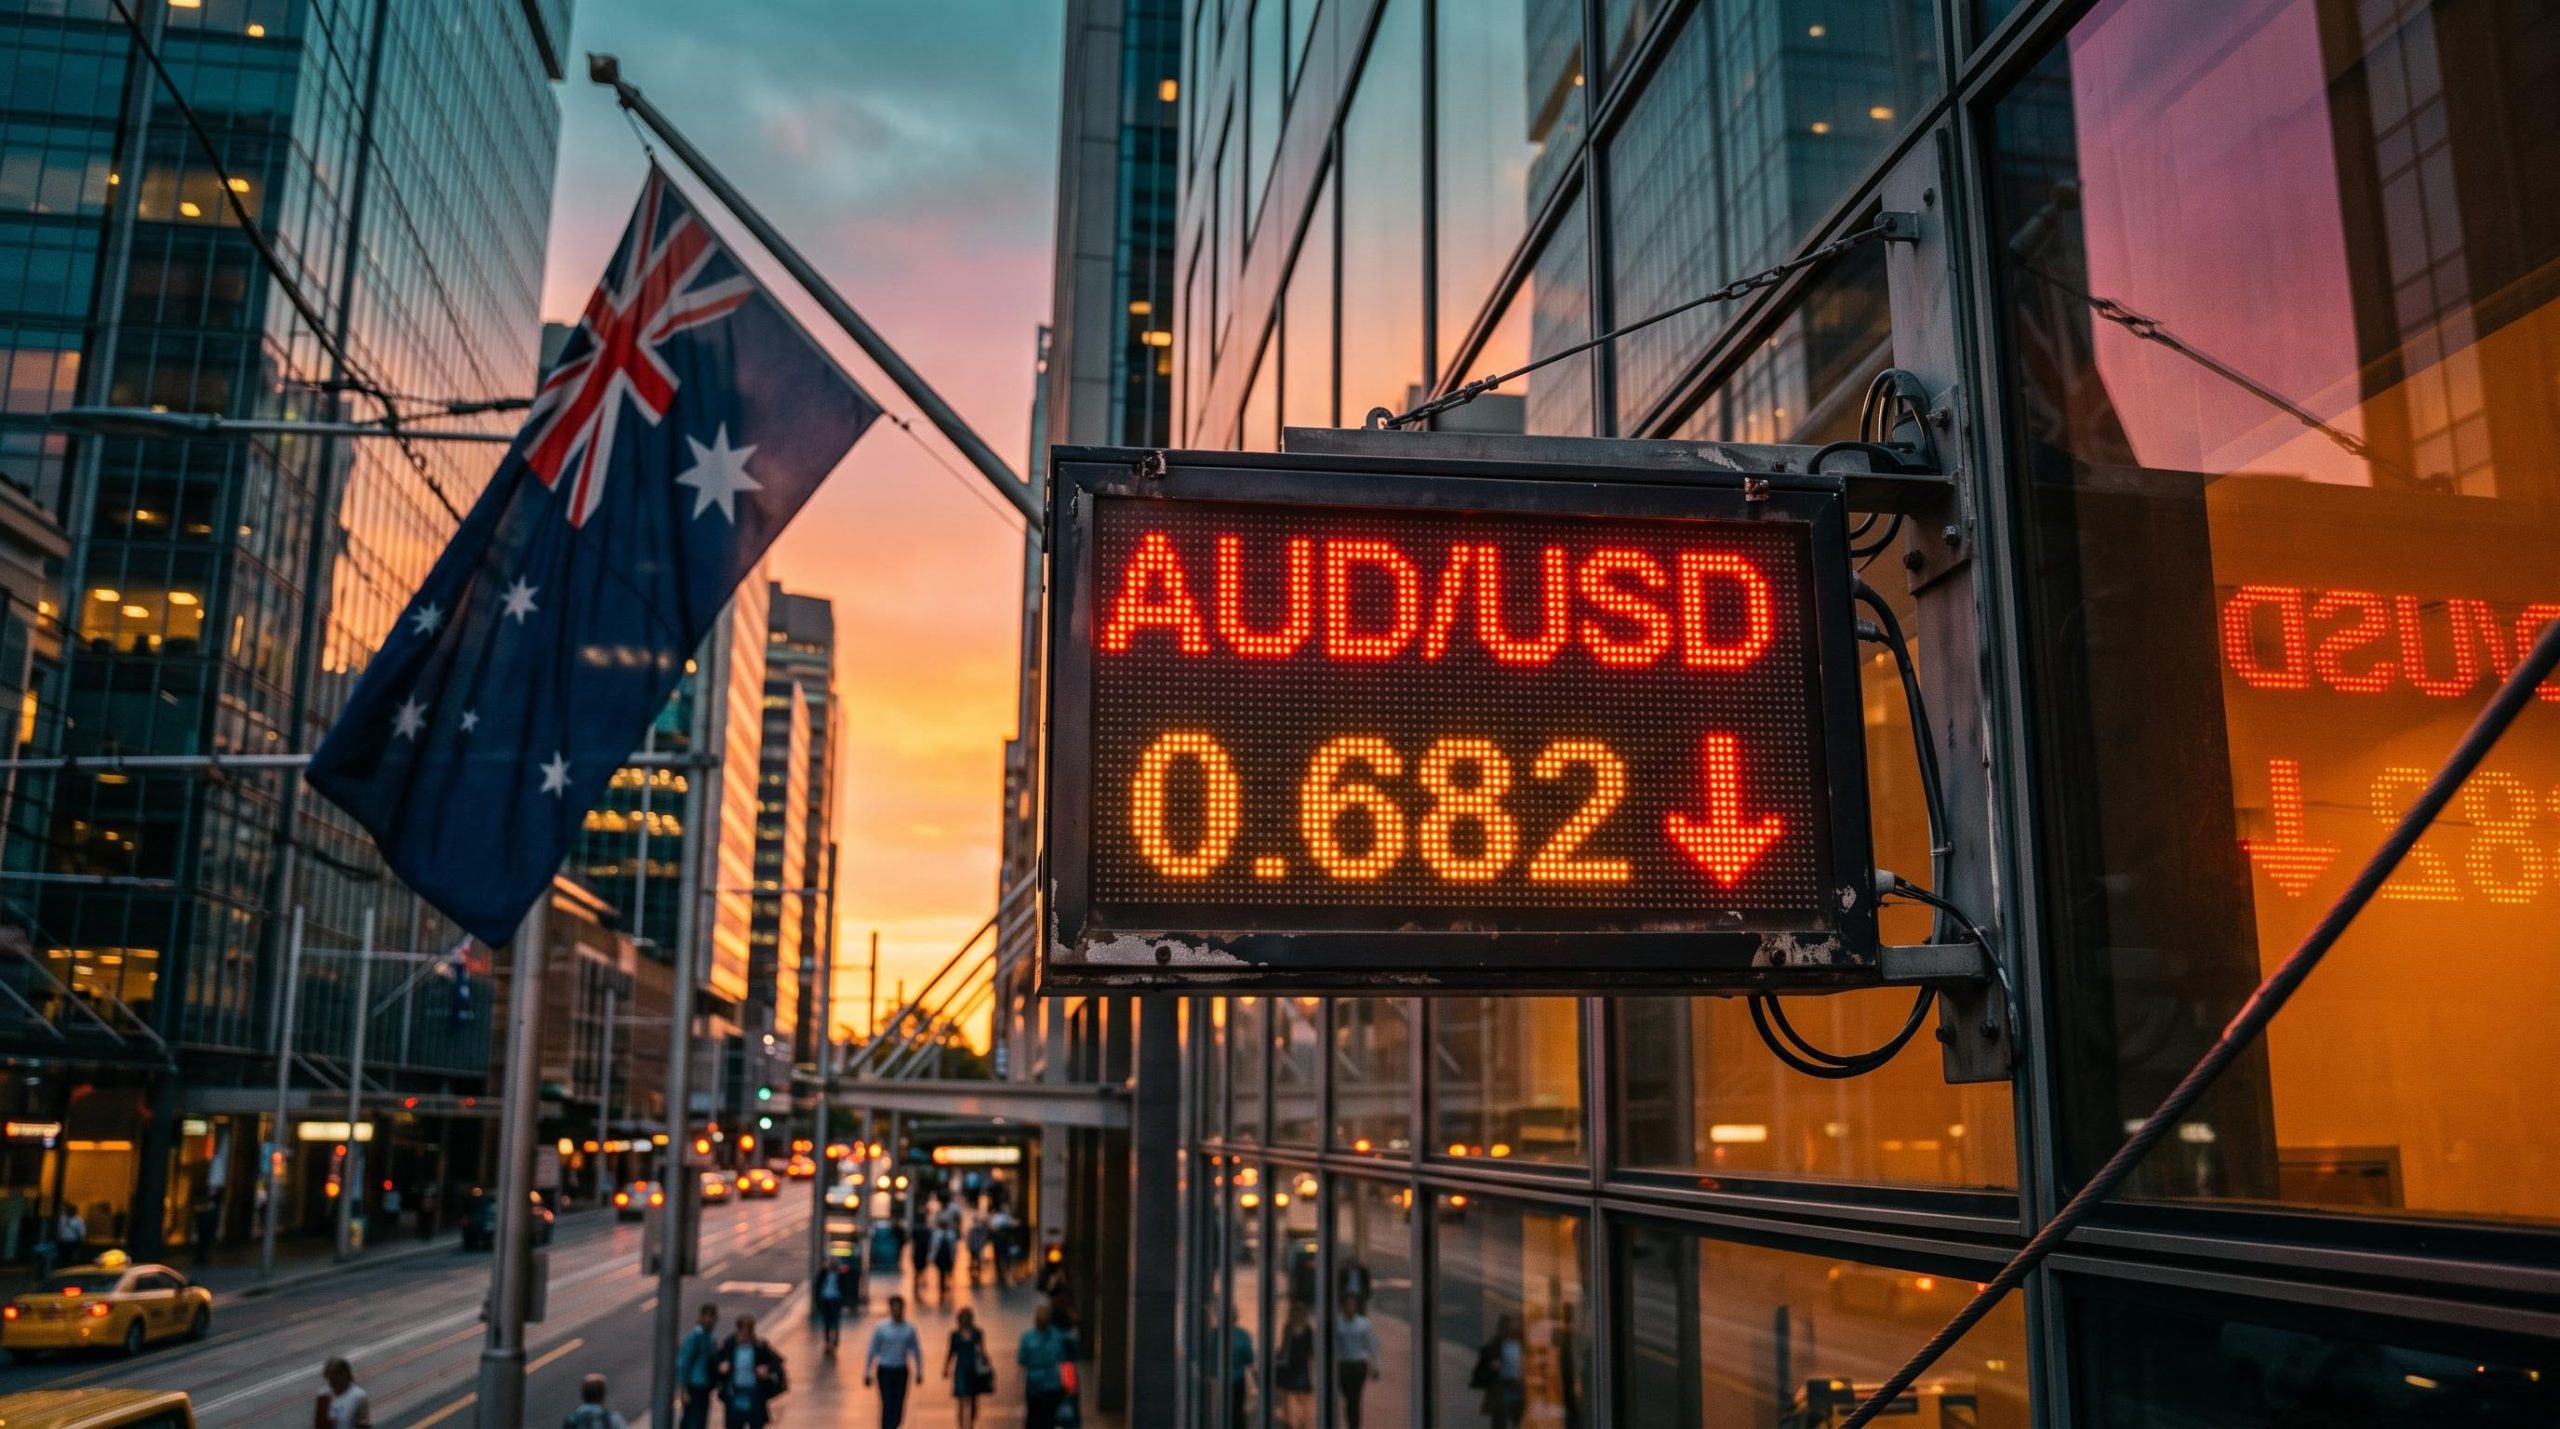
The Australian dollar slid to about 0.682 against the US dollar on Thursday 12 November 2026, its weakest level since January. The fall of roughly 0.60% came as the US Dollar Index hit a year-to-date high, and it pushes the AUD USD forecast debate back into the spotlight.
FXStreet’s Vishal Chaturvedi reported the 0.682 figure at the time of writing. Trading Economics later showed 0.6845 for the same date, a gap that most likely reflects timing within the trading day.
For Australians, the move reaches well beyond trading screens. A weaker dollar raises the cost of imported goods and fuel, makes overseas travel dearer and feeds into how markets think about mortgage rates. Behind it sits a widening policy gap: the US Federal Reserve is expected to keep raising rates, while the Reserve Bank of Australia (RBA) looks close to done.
Here is what is driving the slide, which signals matter next and where the major banks split on the Aussie’s direction.
Where did the Aussie dollar fall furthest, and what does the heat map show?
The headline number is 0.682, down about 0.60% on the day, according to FXStreet. That came only three days after the currency recovered to about 0.6922 on 9 November, when President Trump’s comments on Iran briefly calmed markets, Reuters reported.
The other side of the trade was a firmer greenback. FXStreet put the US Dollar Index (DXY), which measures the US dollar against a basket of six major currencies, at a year-to-date high of 103.19. IDNFinancials reported 102.85 and Trading Economics 102.858, readings that describe the dollar nearing a one-month high rather than a fresh peak.
A cross-rate heat map shows how one currency moved against each of the others. It explains why the slide looks less like an Australian story and more like a dollar story.
| Currency pair | Move on the day | What it signals |
|---|---|---|
| USD vs AUD | USD +0.57% | Biggest US dollar gain among the majors |
| AUD vs JPY | AUD -0.54% | Safe-haven yen also in demand |
| AUD vs EUR | AUD -0.36% | Broad weakness across risk-sensitive currencies |
| AUD vs GBP | AUD -0.28% | Smallest fall, so AUD held up best against sterling |
Read the table by looking for the smallest and largest moves. The Aussie fell least against sterling and most against the US dollar and the yen, two currencies investors buy when they are nervous.
When the AUD drops against every major at once, you are looking at broad dollar demand rather than an Australia-specific problem. That means US data and global risk events deserve more of your attention than local headlines.
When big ASX news breaks, our subscribers know first
What is pushing the US dollar higher: Fed hike bets, tech turmoil and Iran headlines?
The foundation is US inflation. October consumer price index (CPI) figures, released on 10 November, came in hotter than economists expected, Reuters reported.
The core CPI beat Core CPI rose 0.3% month-on-month against 0.2% expected, the third straight monthly rise. Headline CPI rose 0.4% against 0.3% expected, and annual core inflation sat at 2.8%.
Core CPI strips out volatile food and energy prices, so it is the figure the Fed watches most closely. A third consecutive rise told traders the problem is not fading on its own.
With Chair Kevin Warsh offering no forward guidance, inflation prints rather than Fed signals now steer rate expectations, which helps explain why a single hot CPI reading moved currencies so sharply.
Fed officials then reinforced the message. Cleveland Fed President Beth Hammack said policy must turn restrictive to bring inflation down, while Dallas Fed President Lorie Logan and Philadelphia Fed President Anna Paulson backed further tightening. Governor Christopher Waller said before the release that a core reading near 0.3% could bring a half-point December hike into consideration.
Markets have taken that seriously. A December hike is fully priced, with research putting the chance of a 25 basis point move at 87% and a 50 basis point move possible. A basis point is one-hundredth of a percentage point. Rabobank said the hawkish commentary is being taken seriously by markets.
Risk events added a third layer:
- Inflation data: a hot October CPI reset rate expectations.
- Fed speakers: Hammack, Logan, Paulson and Waller leaned hawkish.
- Risk events: tech turmoil and Iran headlines drove safe-haven buying.
Nvidia plunged almost 10% on 12 November after a Wall Street Journal report, Reuters said. Sources differ on the detail: FXStreet referred to reports that CEO Jensen Huang had resigned, while Reuters described a report that the board might remove him. No resignation has been confirmed.
Iran cuts both ways. Trump’s Truth Social post that the US does not need an agreement with Iran lifted caution, yet his 9 November remarks on talks briefly weakened the dollar.
For you, a dollar bid built on inflation data and rate expectations tends to last longer than one built on headlines. Friday’s US producer price index (PPI), which tracks prices businesses receive, is the next test of the durable part.
Is the RBA really pausing while the Fed tightens?
The RBA did not pause in November. It lifted the cash rate by 25 basis points to 4.85%, its fifth hike of 2026. The RBA’s decision page dates the move 3 November, while FXStreet cites 4 November.
So why does the market call it a pause? The answer sits in the wording. The bank struck out its earlier signal of more increases to come, and Governor Michele Bullock indicated that the moment had arrived to gauge how the economy is coping with the higher cost of borrowing.
Central bank statements are written with care, so a dropped phrase often signals more than the decision itself. Markets read this hike as potentially the last, and OCBC said traders now price a 74% chance of a 25 basis point RBA cut by December 2027.
Governor Bullock’s guidance was already the swing factor for the currency before the decision, with a one-and-done signal judged more likely to push the pair lower than the hike itself was to lift it.
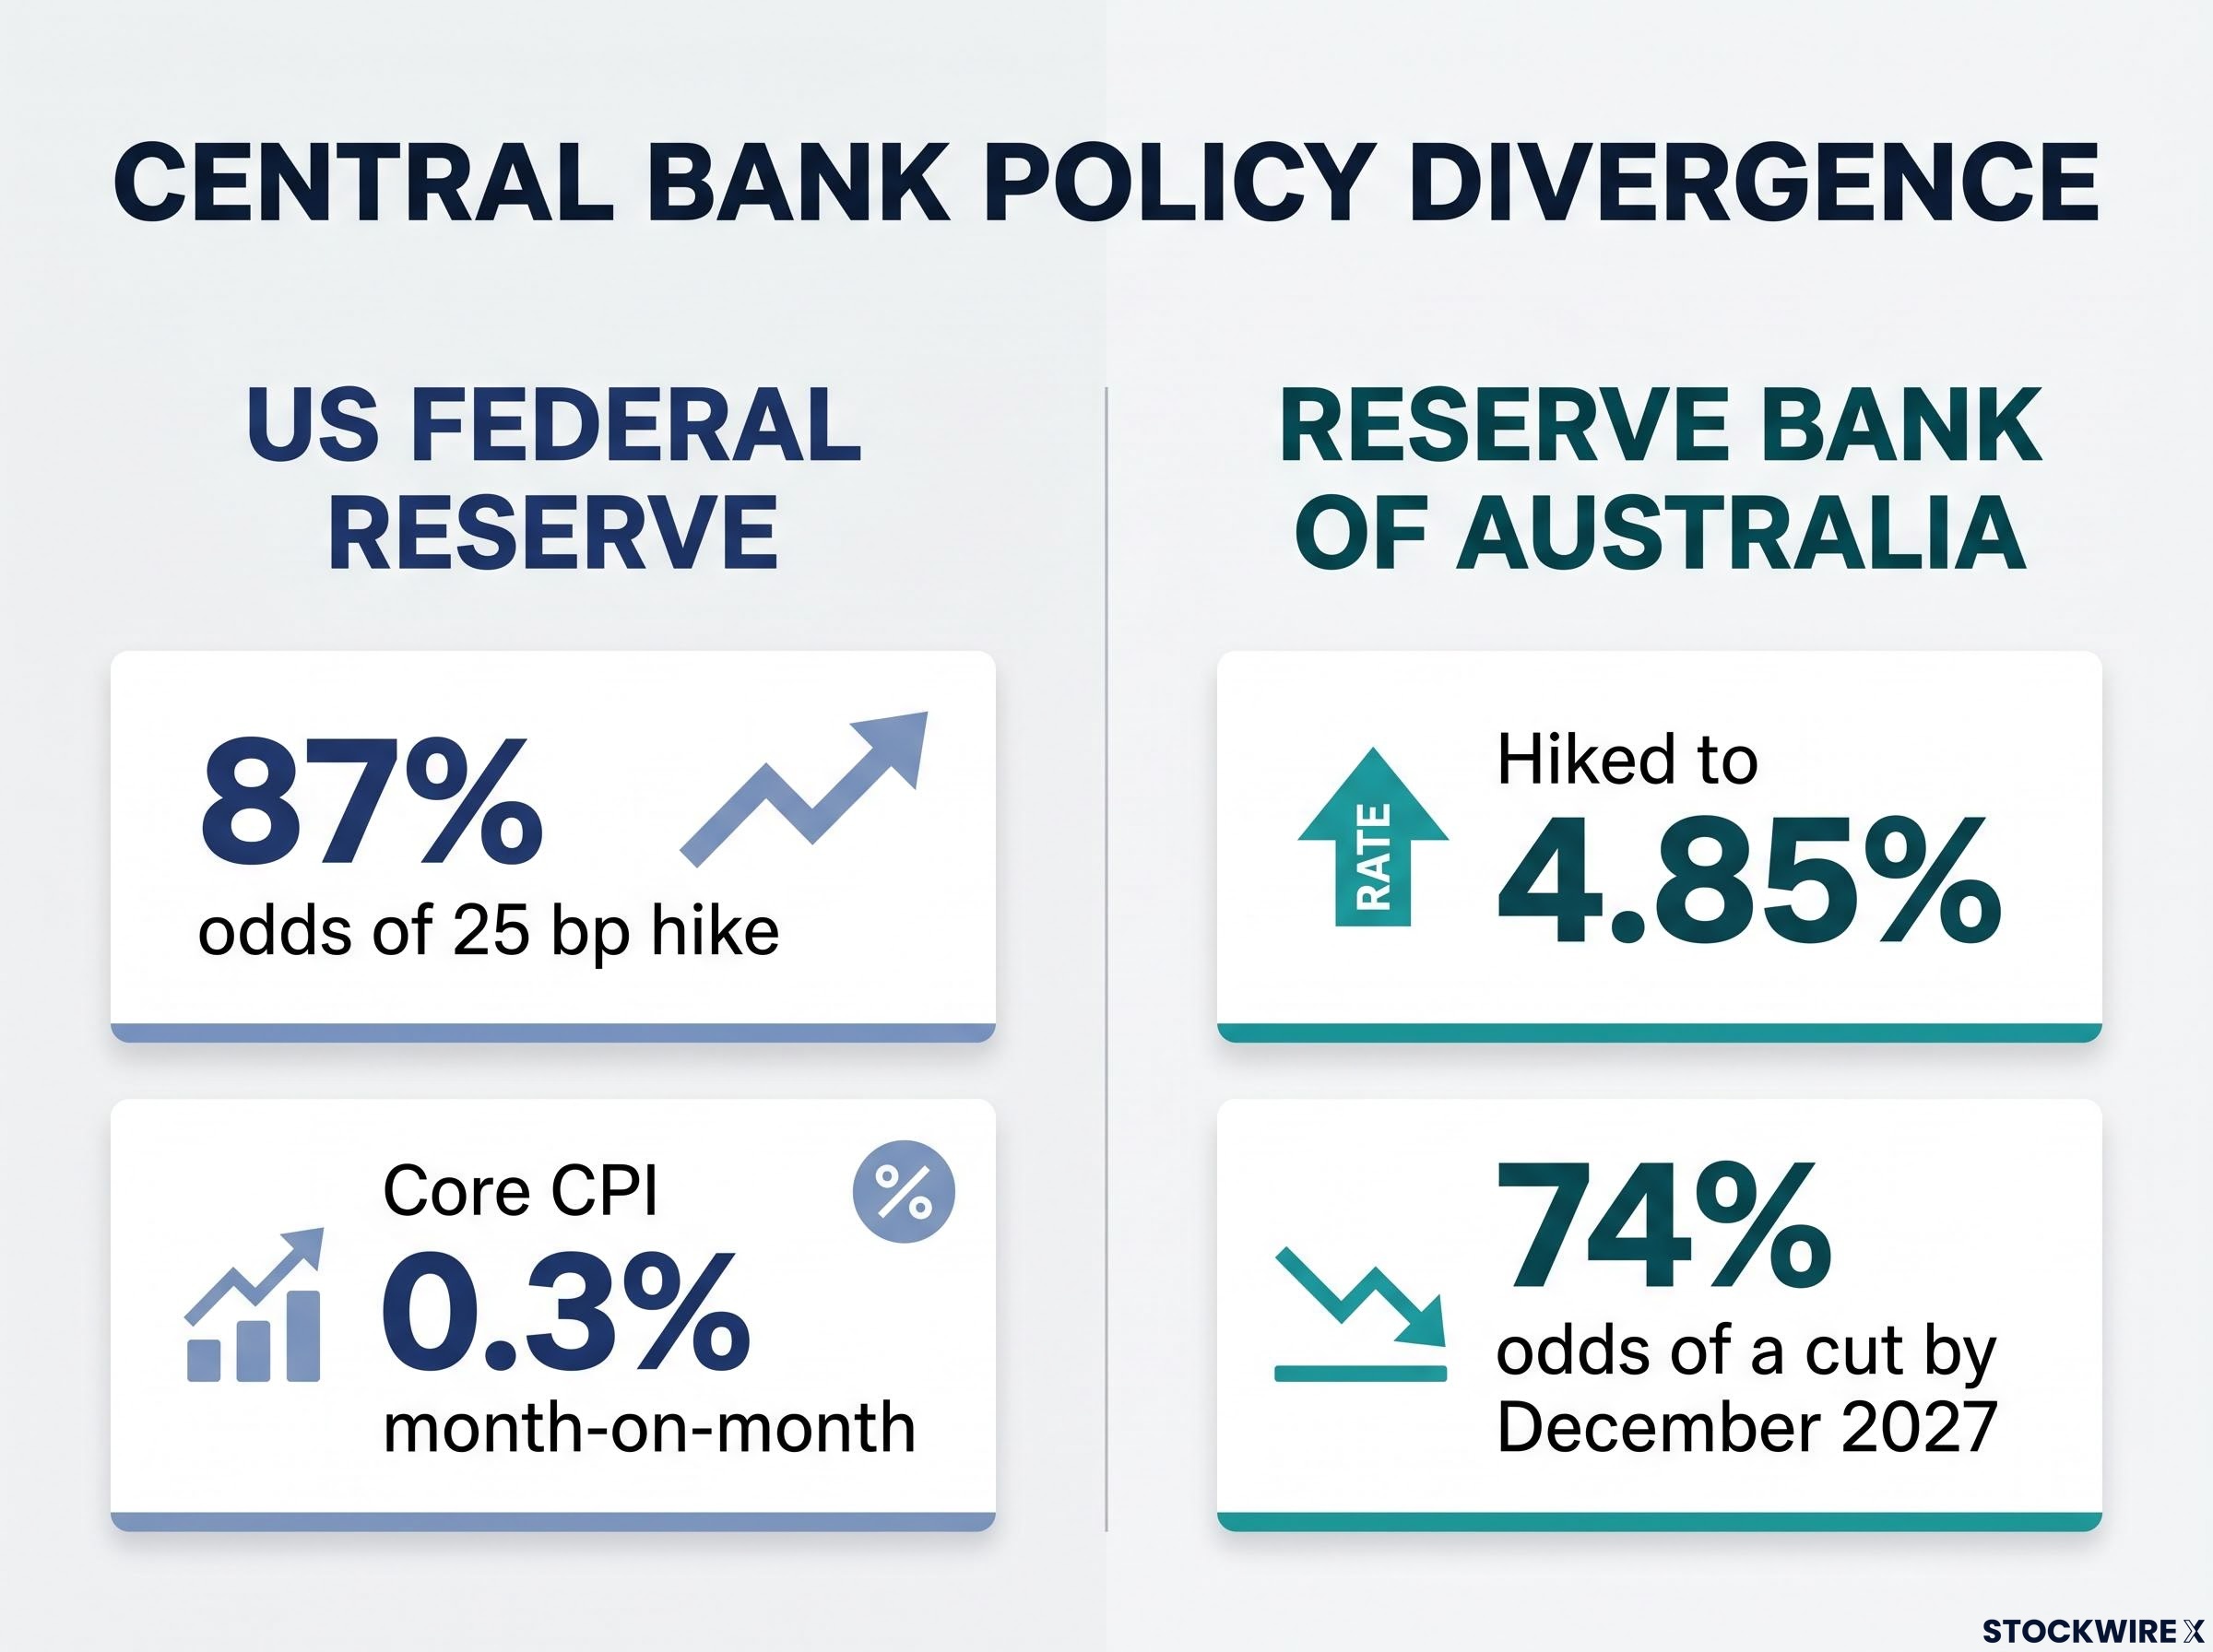
The US Federal Reserve faces an 87% chance of a 25 bp hike amid 0.3% core CPI, while the RBA has hiked to 4.85% with a 74% chance of a cut by Dec 2027.
| Central bank | Latest action and expectation | Inflation context |
|---|---|---|
| US Federal Reserve | December hike fully priced; 87% odds of 25 bp, 50 bp possible | Core CPI 0.3% month-on-month, third straight rise |
| Reserve Bank of Australia | Hiked to 4.85%; 74% odds of a cut by December 2027 | Household expectations 5.3%; midpoint of target by mid-2028 |
The inflation backdrop makes the end-of-cycle reading less tidy. The Melbourne Institute’s measure of household price expectations over the next 12 months held at 5.3% in November, well above the RBA’s 2-3% target band. The RBA itself does not expect inflation back at the middle of that band until mid-2028.
If you hold a variable-rate mortgage or are planning overseas spending, the gap between a hiking Fed and a plateauing RBA matters more than today’s cash rate. It is the direction of travel that steers the Aussie dollar and, through it, what you pay for imports.
What do banks forecast for AUD/USD, and which catalysts could change the call?
The near-term mood is bearish. Rabobank points to Fed hike pricing, and OCBC to fading rate support as RBA cuts creep into view. UOB and Bank of America go further with specific targets.
The other camp is not convinced. Standard Chartered, Westpac and Lloyds argue that yields, commodities and valuation could outlast temporary safe-haven demand.
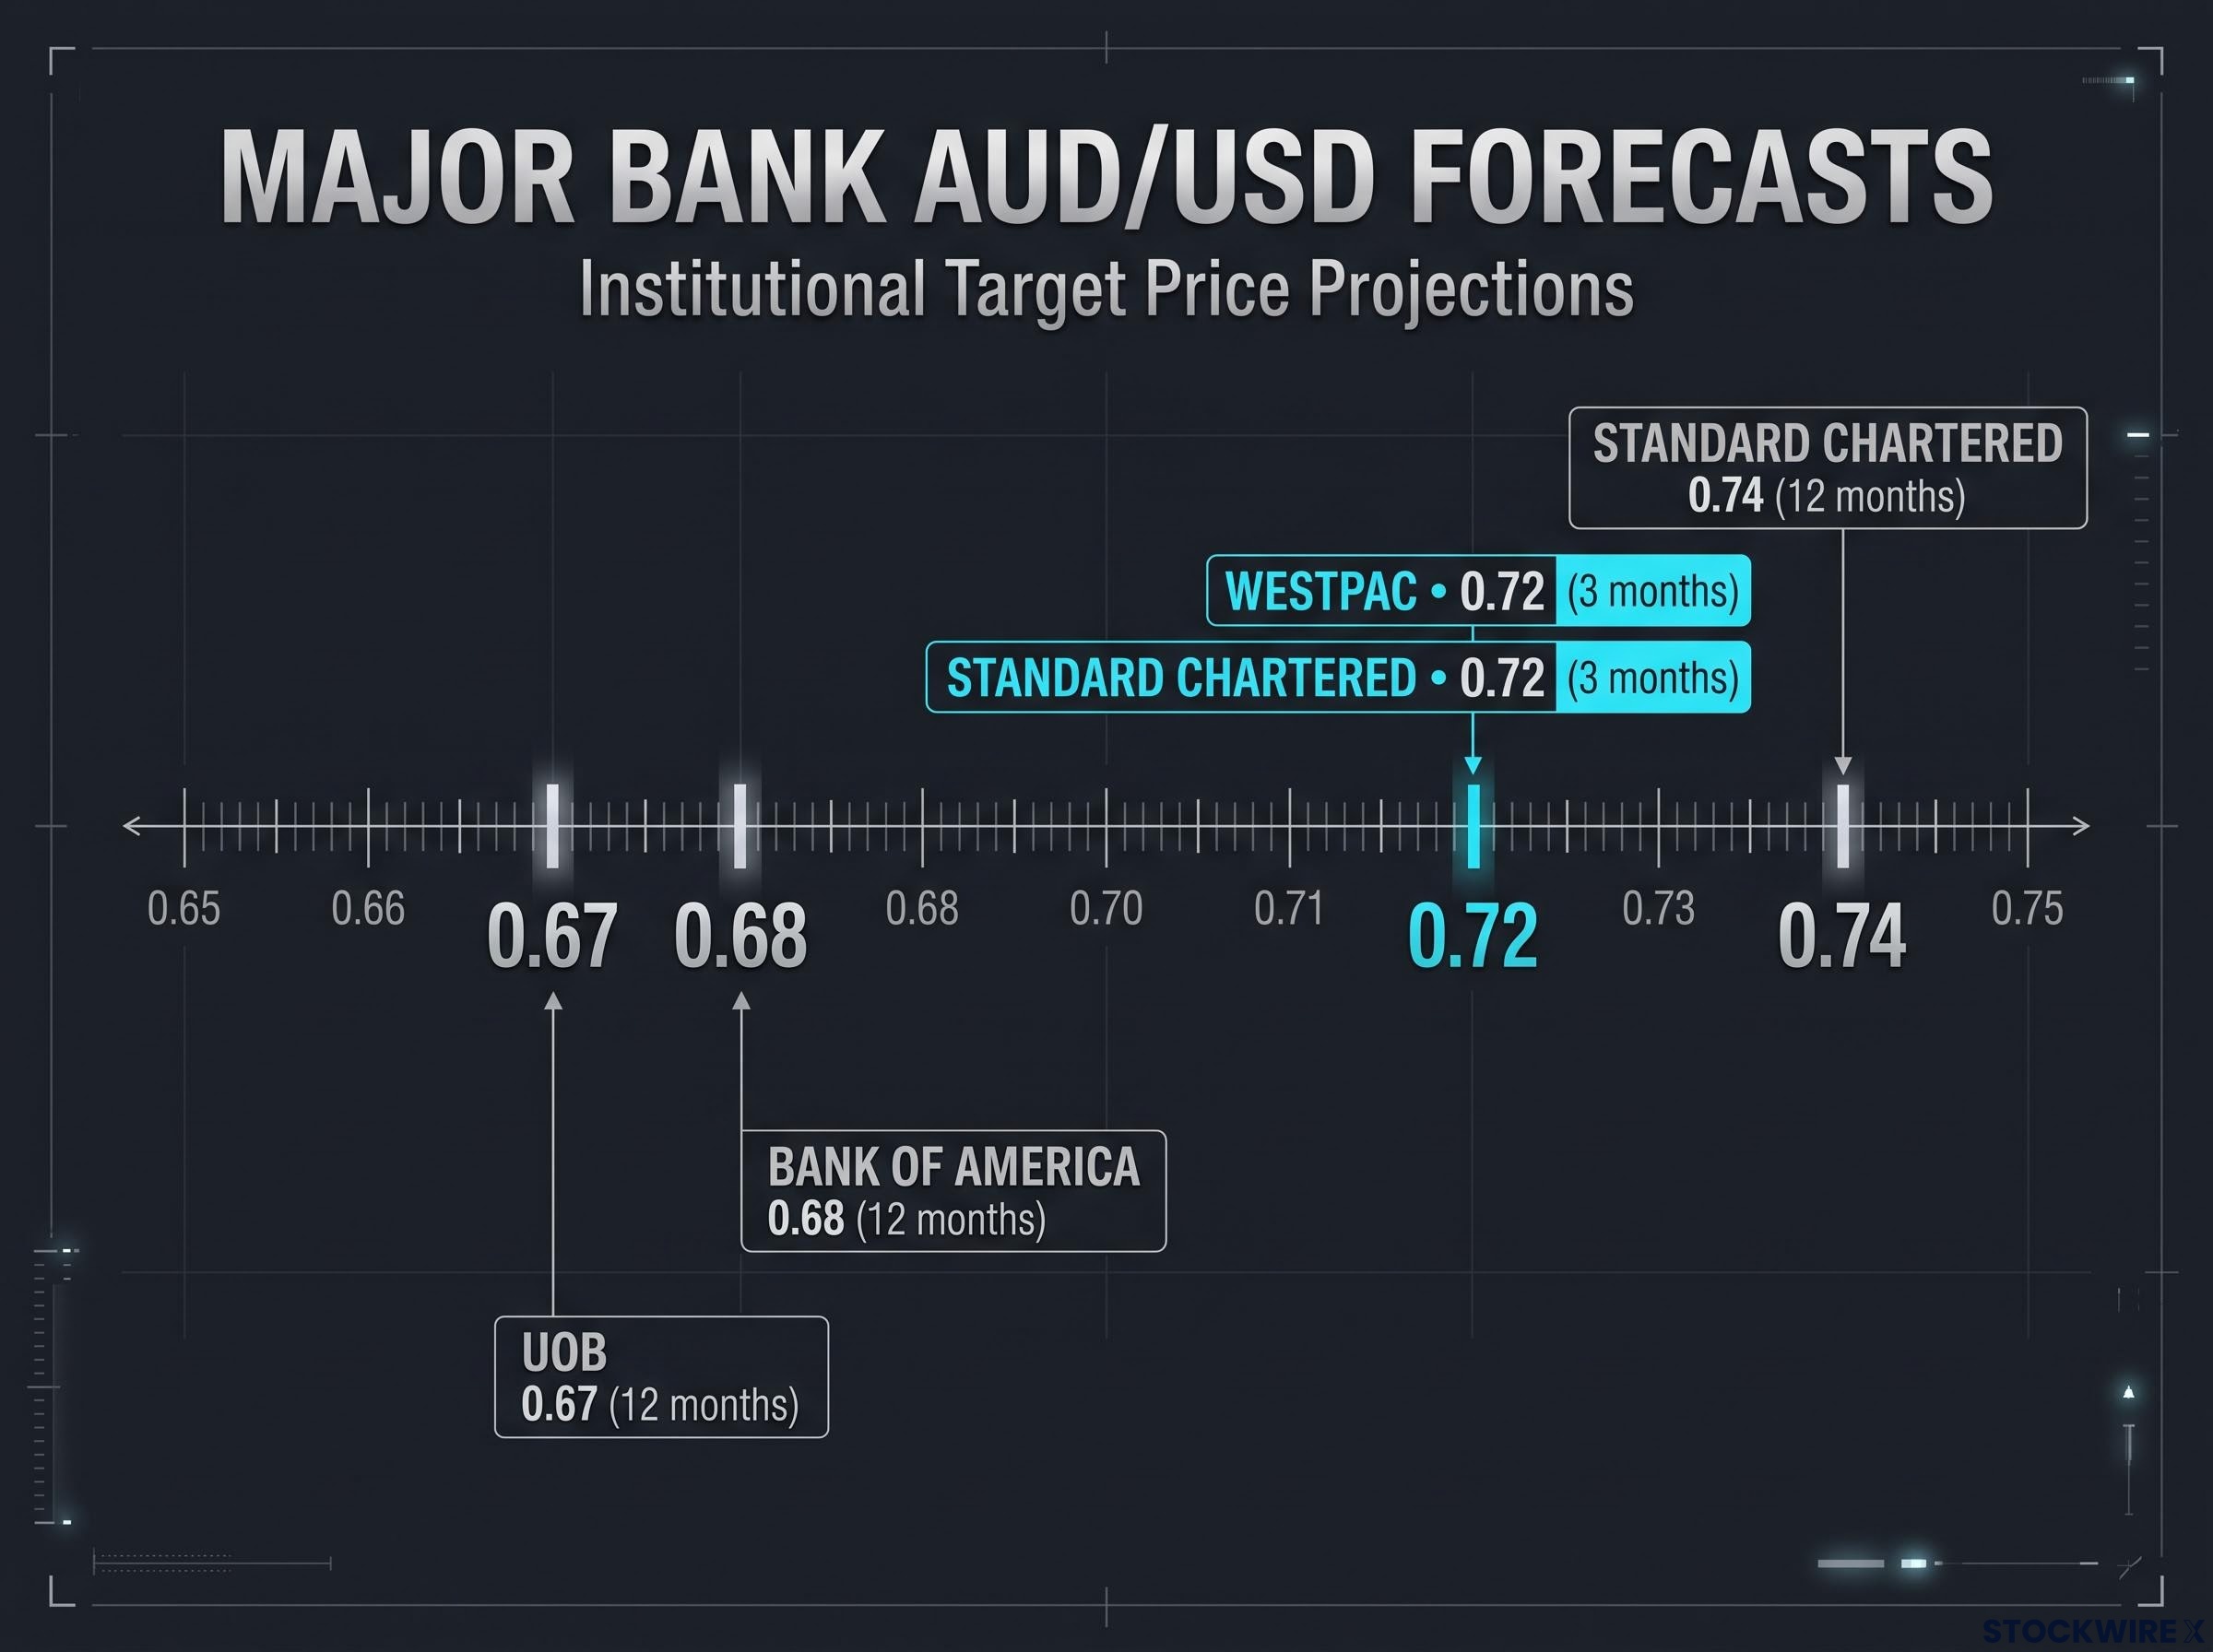
Major banks are split on AUD/USD forecasts, ranging from 0.67 by UOB to 0.74 by Standard Chartered across 3- and 12-month horizons.
| Institution | View | Target and horizon | Key reasoning |
|---|---|---|---|
| UOB | Bearish | 0.67 in 12 months | Rate differentials; Fed may keep hiking |
| Bank of America | Moderately bearish | 0.68 in 12 months | Trend-following funds point to more selling |
| Rabobank | Bearish near term | No target cited | Hawkish Fed commentary taken seriously |
| OCBC | Cautious to bearish | No target cited | Markets pricing RBA cuts by December 2027 |
| Standard Chartered | Constructive | 0.72 in 3 months, 0.74 in 12 months | Australia keeps a rate advantage if risk appetite improves |
| Westpac | Constructive | 0.72 in 3 months | Australian yields and a relatively high cash rate |
| Lloyds | Constructive at lower levels | No target cited | Yield support, commodity prices, cheap valuation |
These are bank views as of 12 November 2026, not guarantees. Past performance does not guarantee future results, and projections are subject to market conditions and various risk factors.
With major banks on both sides of 0.70, treat any single forecast as one scenario and focus on the catalysts that decide which one plays out:
- US PPI on Friday: another hot read would harden Fed hike bets.
- Further Fed speakers: any talk of a half-point move adds dollar support.
- Iran talks and Trump statements: durable easing could strip out the dollar’s safe-haven premium.
- Nvidia and tech sentiment: calmer markets could revive demand for risk currencies like the AUD.
- RBA communication: any hint of hikes beyond 4.85% would rebuild the yield case.
- December Fed meeting: the decision that settles the near-term rate gap.
Better China demand and firmer commodity prices would also ease pressure on the Aussie.
In October the rate differential was already the dominant driver for the pair, with iron ore at its weakest Dalian close since April 2025 capping any rally above 0.70.
Which signals will tell you whether the Aussie’s slide has further to run?
Thursday’s fall was a dollar-strength story first. Fed hike pricing and risk aversion did the heavy lifting, and the RBA’s apparent plateau widened the gap.
That gives you a simple three-part check. Look at the heat map for breadth: a fall against every major points to the US dollar. Read Fed and RBA wording for direction, not just the rate decision. Then watch inflation data for surprises, because hot prints have moved this market more than headlines.
The nearest scheduled test is Friday’s US PPI, followed by the December Fed meeting.
This article is for informational purposes only and should not be considered financial advice. Investors should conduct their own research and consult with financial professionals before making investment decisions.