
The Federal Reserve just hiked rates, revised its dot plot higher, and pushed front-end Treasury yields up. On paper, the dollar should be running. Instead, it spent two straight sessions falling, and it is only now clawing back ground.
That gap between what the policy backdrop implies and what markets actually delivered is where the useful analysis lives. The Dollar Index (DXY) is holding just above 100.00 as of Tuesday, 22 September 2026, with momentum shifting after a two-session slide. Three major pairs are responding in meaningfully different ways: EUR/USD is back under 1.1500, GBP/USD has retreated to the 1.3360-1.3370 range, and USD/JPY has pushed above 157.00 even as the Bank of Japan delivered its highest policy rate in 31 years.
This piece breaks down what is actually driving the dollar’s recovery, why each major pair sits where it does, and which scheduled events this week carry the most capacity to shift the setup. By the time you finish, you will have a framework for judging whether the rebound has legs or represents a positioning-driven bounce heading into a crowded calendar.
What is actually driving the dollar’s rebound
The rebound is not resting on one thing. It rests on three overlapping pillars, and the reason the move has traction is that each one reinforces the next rather than standing alone.
Start with the mechanics. The Federal Reserve delivered a fresh 25 basis point hike at its latest meeting, confirming an active tightening posture. That is the base layer.
Sitting on top of it is the more forward-looking signal: a sizeable upward revision to the dot plot, the chart that maps where individual Fed officials expect rates to head. A hike tells you what the Fed did this month. A higher dot plot tells you what it intends to keep doing, and that is the part markets price further out.
The third pillar is elevated front-end US Treasury yields, which keep dollar-denominated assets more attractive than lower-yielding alternatives.
The three Fed policy tools working simultaneously, the federal funds rate at 3.75-4.00%, quantitative tightening still shrinking the balance sheet, and forward guidance via the dot plot, compound the dollar’s support case beyond any single meeting decision.
- The 25 bp hike: confirms the Fed is still actively tightening, not pausing.
- The hawkish dot plot revision: signals fewer or later cuts, extending the higher-for-longer framework beyond the immediate meeting.
- Elevated front-end yields: support carry into the dollar in the near term.
OCBC strategist Christopher Wong, cited by FXStreet on 17 September 2026, framed the meeting bluntly.
The Fed “validated a hawkish policy path,” with front-end yields keeping the dollar supported in the near term.
The DXY held above 100.00 into the 22 September session, sitting around 100.3 during Asian hours on 21 September. There is also a supplementary driver worth naming without overstating it: a modest safe-haven bid from renewed geopolitical tension at the start of the week. A prior episode on 6 August 2026 saw the DXY rebound to roughly 99.8 after Israeli airstrikes in southern Lebanon triggered risk-off flows. That kind of bid is real, but it is secondary.
Here is what the combination tells you. Because the recovery leans on an active hike, a higher dot plot, and elevated yields, the dollar’s support is a yield differential argument, not a sentiment trade. That is more durable than a geopolitical bid, which fades fast. It is also more exposed to any US data miss that undercuts the higher-for-longer thesis. Three Fed officials were scheduled to speak on 22 September, and markets were watching for exactly that kind of signal.
When big ASX news breaks, our subscribers know first
EUR/USD and GBP/USD: divergent fundamentals, convergent weakness
Both the euro and the pound weakened against the dollar into the 22 September session. The temptation is to treat them as the same trade. They are not. Their shared direction masks two genuinely different stories, and the conditions each would need to reverse are not the same.
| Attribute | EUR/USD | GBP/USD |
|---|---|---|
| Current level (22 Sep 2026) | Below 1.1500 | 1.3360-1.3370 |
| Primary driver of weakness | Fed-versus-ECB policy divergence | Broader risk-off positioning |
| Key scheduled catalyst | ECB’s Claudia Buch speech; eurozone Consumer Confidence | August PSNB release; CBI Industrial Trends Orders |
| Nearest historical reference | ~1.137-1.138 (June 2026 DXY peak) | Risk-sentiment driven, no fixed anchor |
EUR/USD: central bank divergence in focus
EUR/USD traded below 1.1500 on 22 September, reversing two straight days of gains. The driver here is structural rather than euro-specific. As long as the Fed is seen as more hawkish than the European Central Bank, the bias in the pair skews toward dollar strength.
You can see how far that divergence can push the pair by looking back. During the June 2026 dollar rally, when the DXY reached 101.42, the euro fell to roughly 1.137-1.138. That level is the concrete downside reference if US strength extends again.
The near-term catalyst is ECB Supervisory Board member Claudia Buch, scheduled to speak on 22 September, alongside the preliminary eurozone Consumer Confidence reading. For a US-based reader with European exposure, the read is this: EUR/USD weakness is anchored in central bank divergence and unlikely to reverse materially without a shift in ECB tone or a softening of US data.
GBP/USD: risk sentiment and fiscal data in play
Sterling’s story is different. Its pullback to the 1.3360-1.3370 range on 22 September moved in step with other risk-sensitive currencies, reflecting a broader risk-off tone rather than a UK-specific breakdown.
That distinction matters for timing. Because the move is sentiment-driven, GBP/USD could recover faster than the euro if the risk-off episode fades.
The near-term wildcard is fiscal data. The August 2026 UK Public Sector Net Borrowing (PSNB) figure, the government’s monthly borrowing measure, was due on 22 September with a consensus forecast of £12.8 billion. The July reading surprised markets with a £1.8 billion deficit against expectations of a balanced budget. A large deviation from the August consensus could shift sterling momentum quickly, layering a domestic catalyst on top of the risk-sentiment story.
Why USD/JPY above 157 is the counterintuitive trade of the week
Here is the paradox. The Bank of Japan raised its policy rate by 25 basis points to 1.25% in a 7-2 vote, the highest in 31 years. And the yen weakened. USD/JPY pushed above 157.00 on 22 September rather than falling.
A rate hike usually strengthens a currency. So why did the opposite happen?
The answer is the gap between expectation and delivery. Markets had positioned for a more forceful hawkish signal, and the BoJ’s cautious communication disappointed that positioning. As TradingView put it on 18 September:
The yen tumbled because the BoJ “failed to convince traders it’s serious about rate hikes.”
The clearest evidence sits in the bond market. The policy-sensitive two-year Japanese government bond (JGB) yield actually fell around 2.5 basis points after the decision. That is the signal that matters most. A yield falling after a rate hike tells you Japanese markets read the BoJ as closing the door on near-term follow-up hikes, which removes the one mechanism that could narrow the yield differential driving yen weakness.
ING, via Mitrade, placed the yen around 157.11 per dollar, roughly one yen weaker than before the decision. XTB noted on 18 September that quotes near 157.2 broke above the 38.2% Fibonacci retracement at 157.15, drawn on the decline from 164.07 to 152.87. A Fibonacci retracement is a technical level traders use to identify where a prior move might pause or reverse.
- 157.00-157.20: the breakout and resistance zone.
- 157.15: the 38.2% Fibonacci retracement, the key near-term reference.
- 164.07: the prior swing high.
- 152.87: the prior swing low.
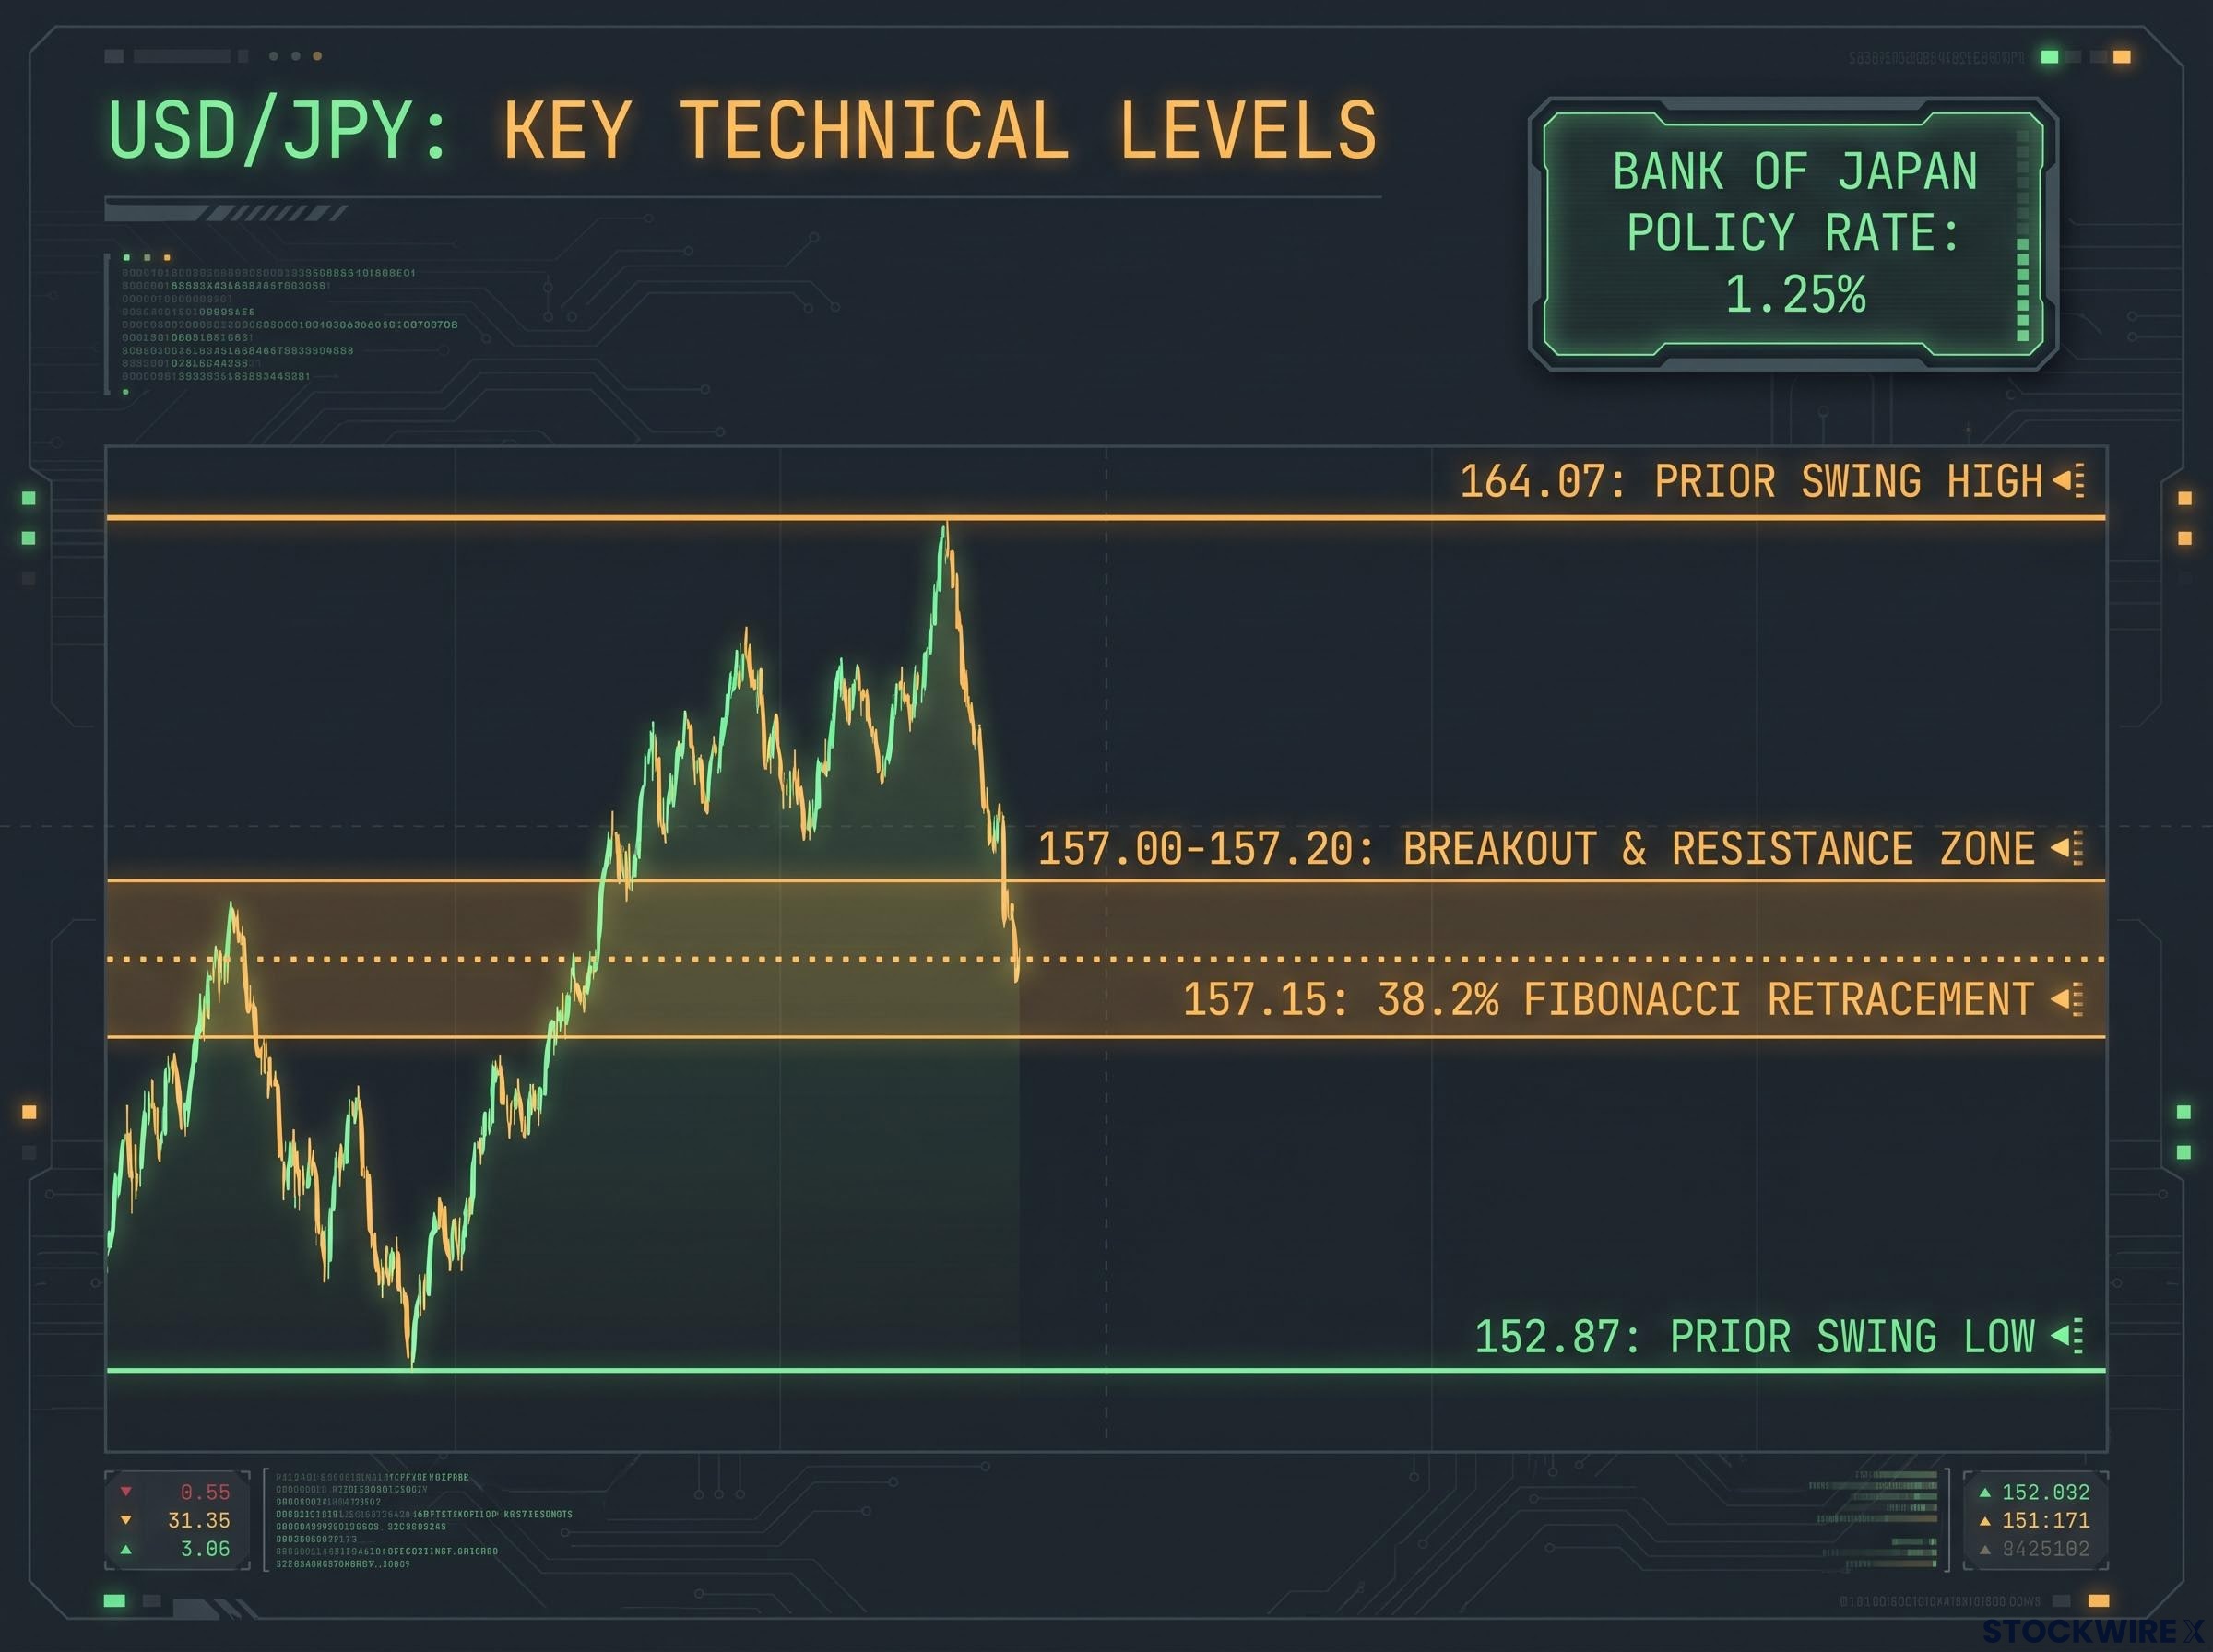
This is not the first time the pattern has played out. When the BoJ hiked to 0.75% in December 2025, USD/JPY climbed above 157.10 from around 155.80 after Governor Ueda’s press conference. The template repeats: a historic hike, cautious communication, and a wide yield gap that leaves the yen soft.
For anyone tracking carry trades or USD/JPY positioning, 157.15 is the level to watch. A sustained break above it opens room for further yen weakness. A reversal there could signal the move has run ahead of fundamentals. Japan’s advance S&P Global PMI data, due 24 September, is the next catalyst.
Where the dollar’s rate-differential argument is most vulnerable
Describing what happened is one thing. Stress-testing whether it holds is another, and this is where the setup starts to look less settled than the price action suggests.
The most cited caution comes from OCBC’s Christopher Wong. He warned that substantial Fed tightening is already priced in, meaning the marginal impact of further hawkish signalling may be limited. He pointed out that the post-meeting move in longer-dated yields was relatively modest, and that softer US data could quickly reopen the downside for the dollar.
That places the entire fundamental case on one variable: the US labour market.
The data-dependency equation for DXY
The recent data has been firmly on the dollar’s side. Initial jobless claims for the week ended 12 September fell 10,000 to a seasonally adjusted 196,000, the lowest since mid-July, according to Reuters. Continuing claims dropped 39,000 to 1.73 million for the week ended 5 September, the lowest since January 2024.
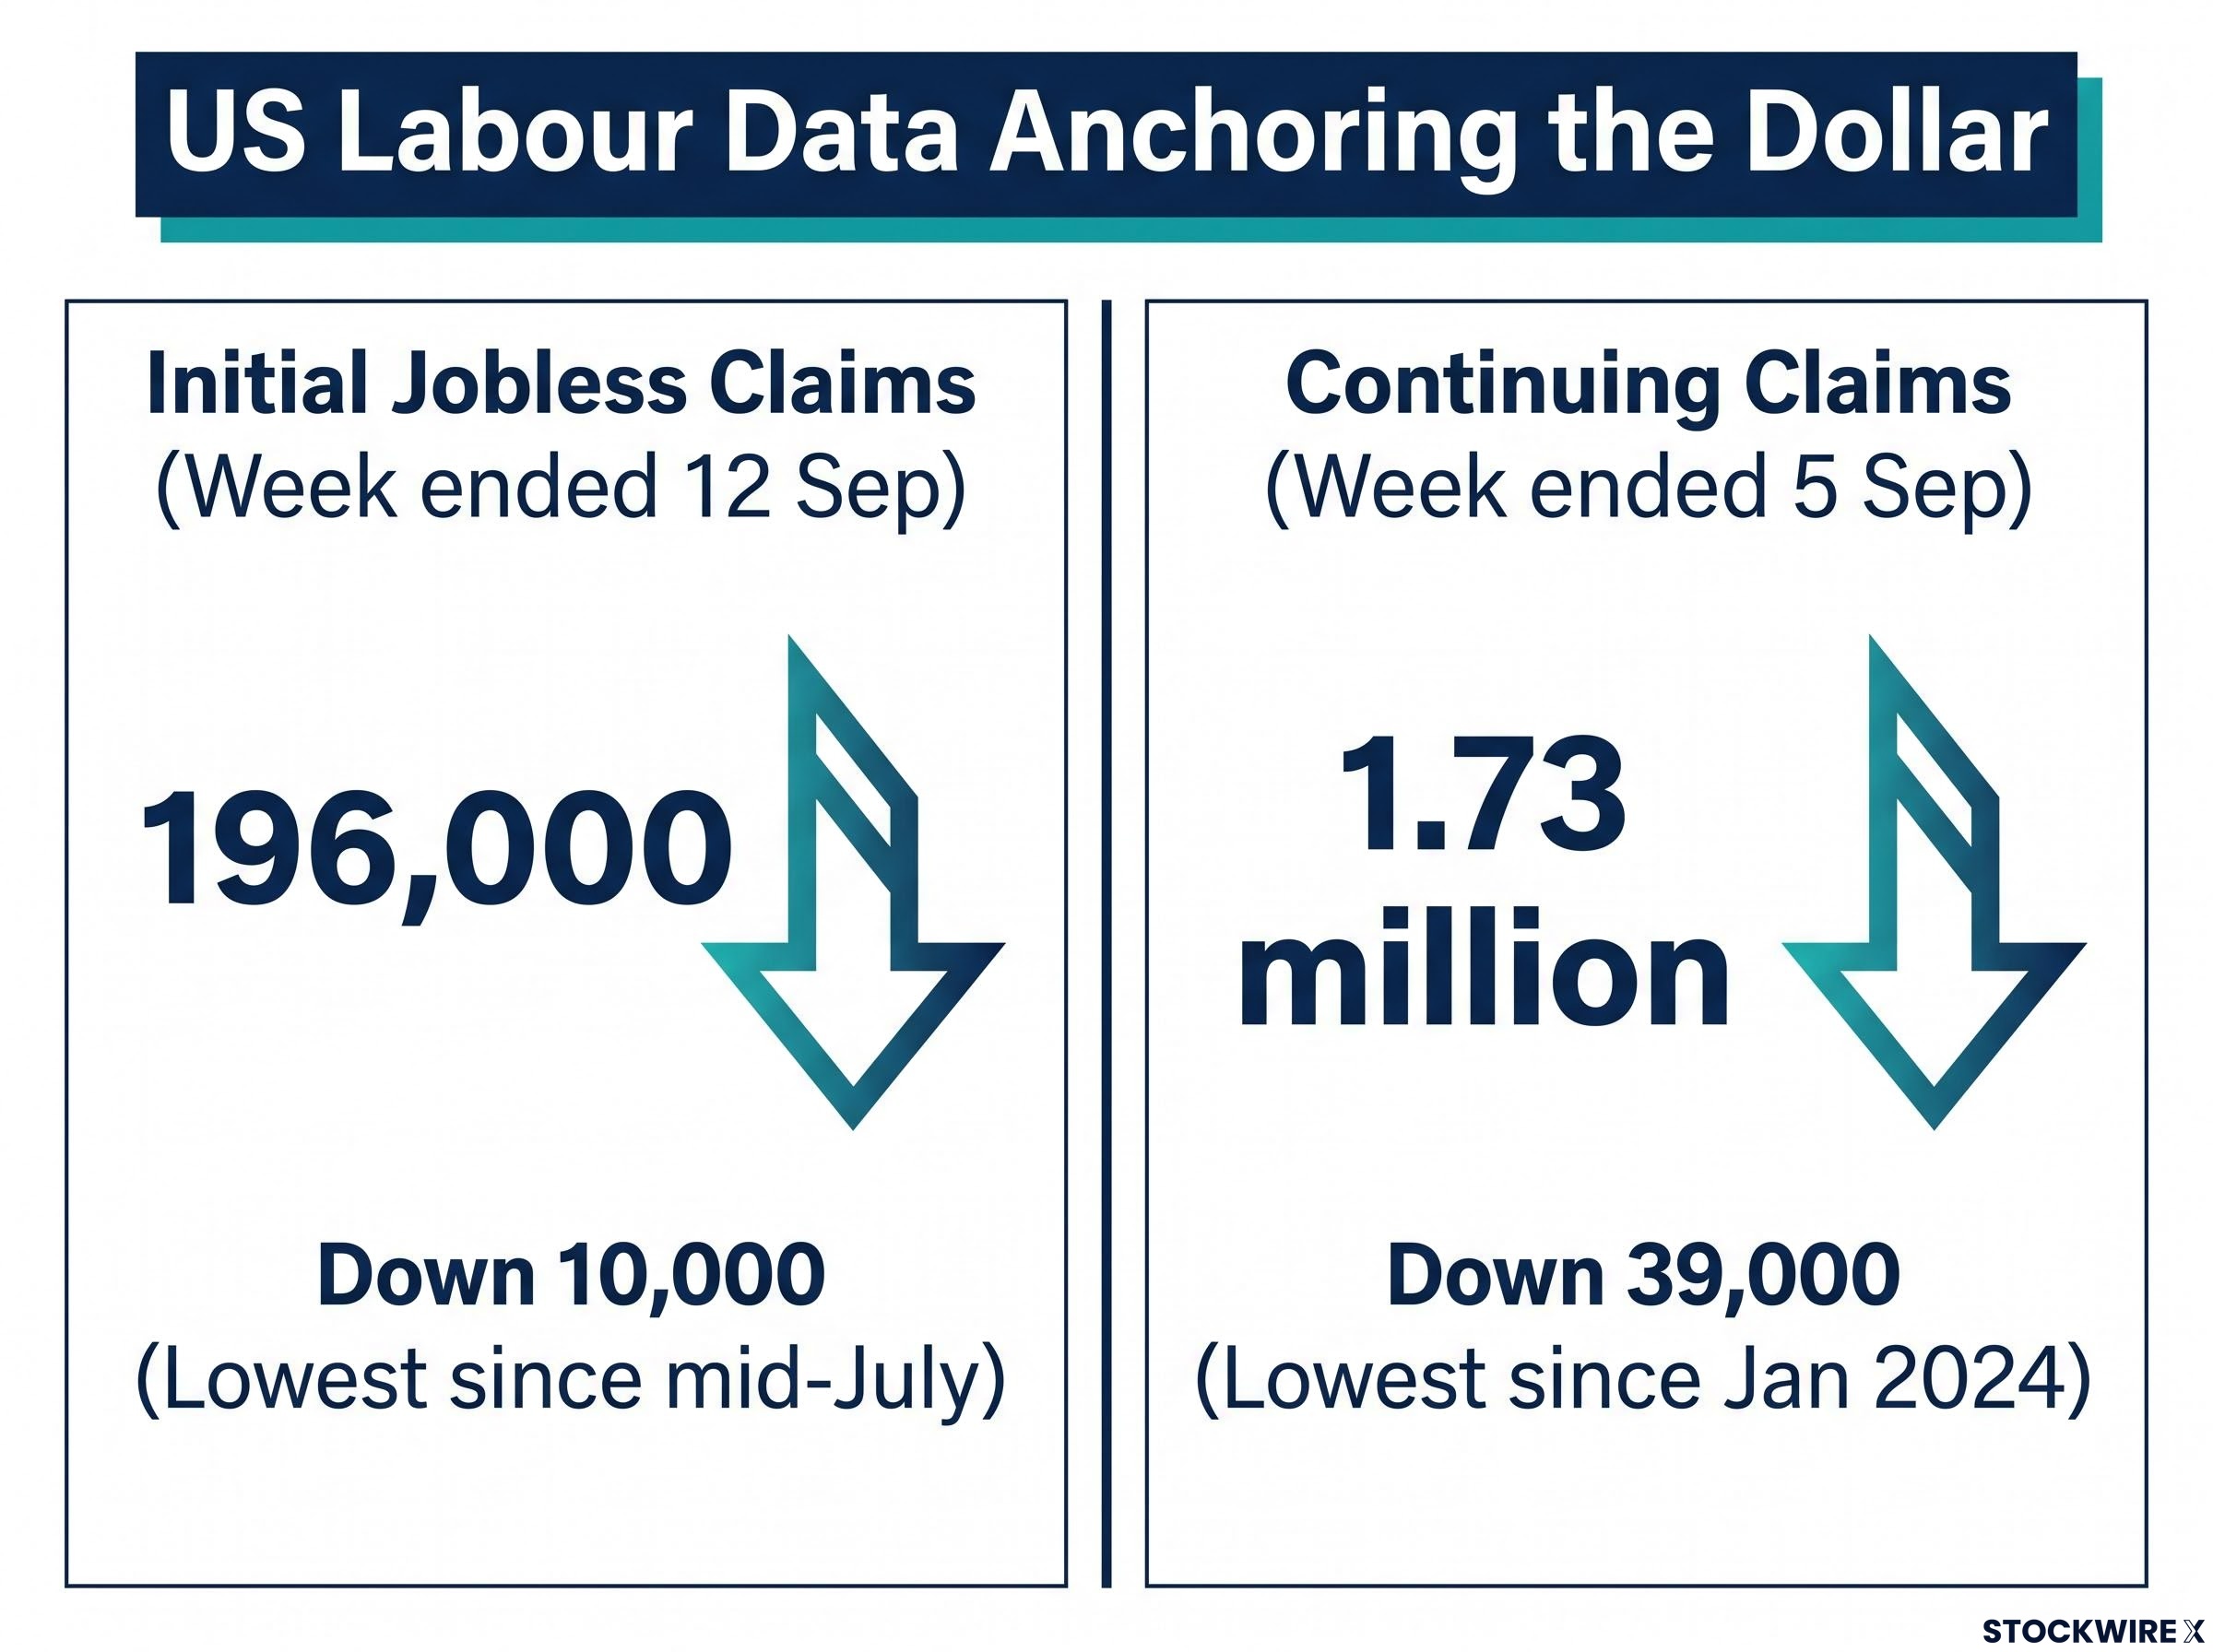
That 196,000 reading is doing significant work in the dollar bull case right now. If upcoming labour data shows any crack in that picture, the higher-for-longer thesis loses its empirical anchor, and holding the DXY above 100.00 becomes much harder.
Labour market deterioration is the specific trigger that would most quickly undercut the dollar’s fundamental support: the June 2026 payroll miss of just 57,000 against a 114,000 consensus showed how rapidly a single soft print can shift the rate-path narrative and reprice duration across the curve.
An employment-related release was scheduled for 22 September, and the technical backdrop adds a second constraint. The 101-102 region, based on the June 2026 peak of 101.42, is where prior rallies stalled.
USD/JPY-specific tail risk: what a more hawkish BoJ would change
There is one more risk that sits outside the DXY story entirely, and it applies only to the yen.
The risk of a BoJ communication shift is not hypothetical: Deputy Governor Himino’s pre-meeting declaration that the BoJ does not need complete information before acting lowered the threshold for future moves materially, meaning any reinforcement of that posture could compress the yield differential that is currently keeping USD/JPY above 157.
The current yen weakness assumes the BoJ stays cautious. If BoJ communication turns more forceful, or if Japanese authorities signal intervention to arrest the yen’s slide, the pair could reverse sharply. This is a distinct, pair-specific layer that does not touch EUR/USD or GBP/USD.
History shows how fast those reversals arrive when BoJ or Ministry of Finance tone shifts. Ranked by near-term priority, the three risk scenarios worth monitoring are:
- US labour or growth data softens, undermining the Fed’s higher-for-longer capacity and the dollar’s core support.
- The BoJ delivers more forceful hawkish guidance or an intervention signal, triggering a sharp yen reversal.
- The geopolitical risk premium dissipates, removing the fragile safe-haven bid that supplemented dollar demand.
Each pillar of the current recovery is individually vulnerable. Knowing where each is weakest is the starting point for managing exposure.
How durable is the rebound, and what the calendar reveals next
The dollar’s case reduces to a simple weighing exercise. On one side sit the three pillars: the Fed hike, the higher dot plot, and elevated front-end yields. On the other sit three vulnerabilities: pricing saturation, data dependency, and the BoJ tail risk. The verdict is conditional, not certain.
The calendar is what resolves that ambiguity. This is not a list of events to note and move past. It is the mechanism that will confirm or complicate the Fed’s higher-for-longer narrative in real time.
- Fed speakers (22 September): three officials, with any deviation from the hawkish tone carrying market-moving potential.
- UK PSNB, August release (22 September): consensus £12.8 billion, the near-term GBP catalyst.
- ECB Claudia Buch speech (22 September): the near-term EUR catalyst.
- Japanese PMI advance reading (24 September): the next major yen catalyst.
The cleanest benchmark is the gap between the DXY’s current level near 100.3 and its June 2026 peak of 101.42.
DXY technical levels carry their own interpretive layer here: as of 11 September 2026, the index sat below both the 20-EMA near 99.27 and the 61.8% Fibonacci retracement at 99.24, meaning the current push above 100.00 represents a genuine structural break rather than a move within a still-bearish regime.
The dollar’s durability above 100.00 rests on US data continuing to validate the Fed’s hawkish stance, and that validation is being tested this week.
If incoming data and Fed speakers close that gap, the bull case is confirmed. If the data disappoints and the DXY cannot hold 100.00, the two-session slide that preceded this rebound resumes on firmer footing. Watch two inputs above all others: US labour data and BoJ communication.
This article is for informational purposes only and should not be considered financial advice. Investors should conduct their own research and consult with financial professionals before making investment decisions. Past performance does not guarantee future results. Financial projections are subject to market conditions and various risk factors.