
Stock Valuation Analysis: What Tesla’s $475 Spread Teaches
5 mins ago

Tesla trades at roughly 189x forward earnings. The average traditional automaker trades closer to 7x. That gap is not a mispricing. It is a probability bet, and understanding exactly what it is a bet on is what separates disciplined investors from narrative-driven ones. Tesla’s Q1 2026 earnings beat consensus across revenue ($22.4 billion, up 16% year-over-year), EPS ($0.40 vs. $0.35 expected), and gross margin (21.7% vs. 17% projected). Despite that operational outperformance, the stock’s valuation still cannot be justified by its automotive business alone. A company can report strong results and still be expensive, or cheap, depending entirely on which future version of the company the buyer believes they are purchasing. This guide uses Tesla’s live bull and bear case scenarios to teach a repeatable methodology for stock valuation analysis of any company in business model transition, with specific attention to how entry price shapes every return outcome.
A 189x forward P/E looks absurd next to Ford’s 7x. The instinct is to call it overvalued and move on. That instinct is wrong, not because Tesla is cheap, but because the comparison itself is flawed. The two multiples measure fundamentally different things.
Ford’s P/E divides a stable share price by earnings generated almost entirely from a mature, well-understood business. The denominator reflects cars built, sold, and delivered on a predictable margin structure. Tesla’s denominator does the same arithmetic, but the numerator, the price, embeds revenue streams that do not yet exist in material form: robotaxi operations, Optimus humanoid robotics, and full self-driving licensing at scale.
For a company mid-transition, the P/E multiple functions as an implicit probability weight across several possible future business states. CFA Institute guidance recommends treating these multiples as scenario trees rather than point estimates. A buyer at 189x is not paying for today’s earnings. They are paying for a blended expectation of what Tesla might earn if some combination of autonomy, robotics, and software licensing materialises over the next decade.
The forward P/S ratio of approximately 13.8x-14.2x tells a similar story. The variance in that range reflects differing analyst assumptions about 2027 revenue growth (15%-25%), which in turn depends on how much weight each model places on transition revenue streams.
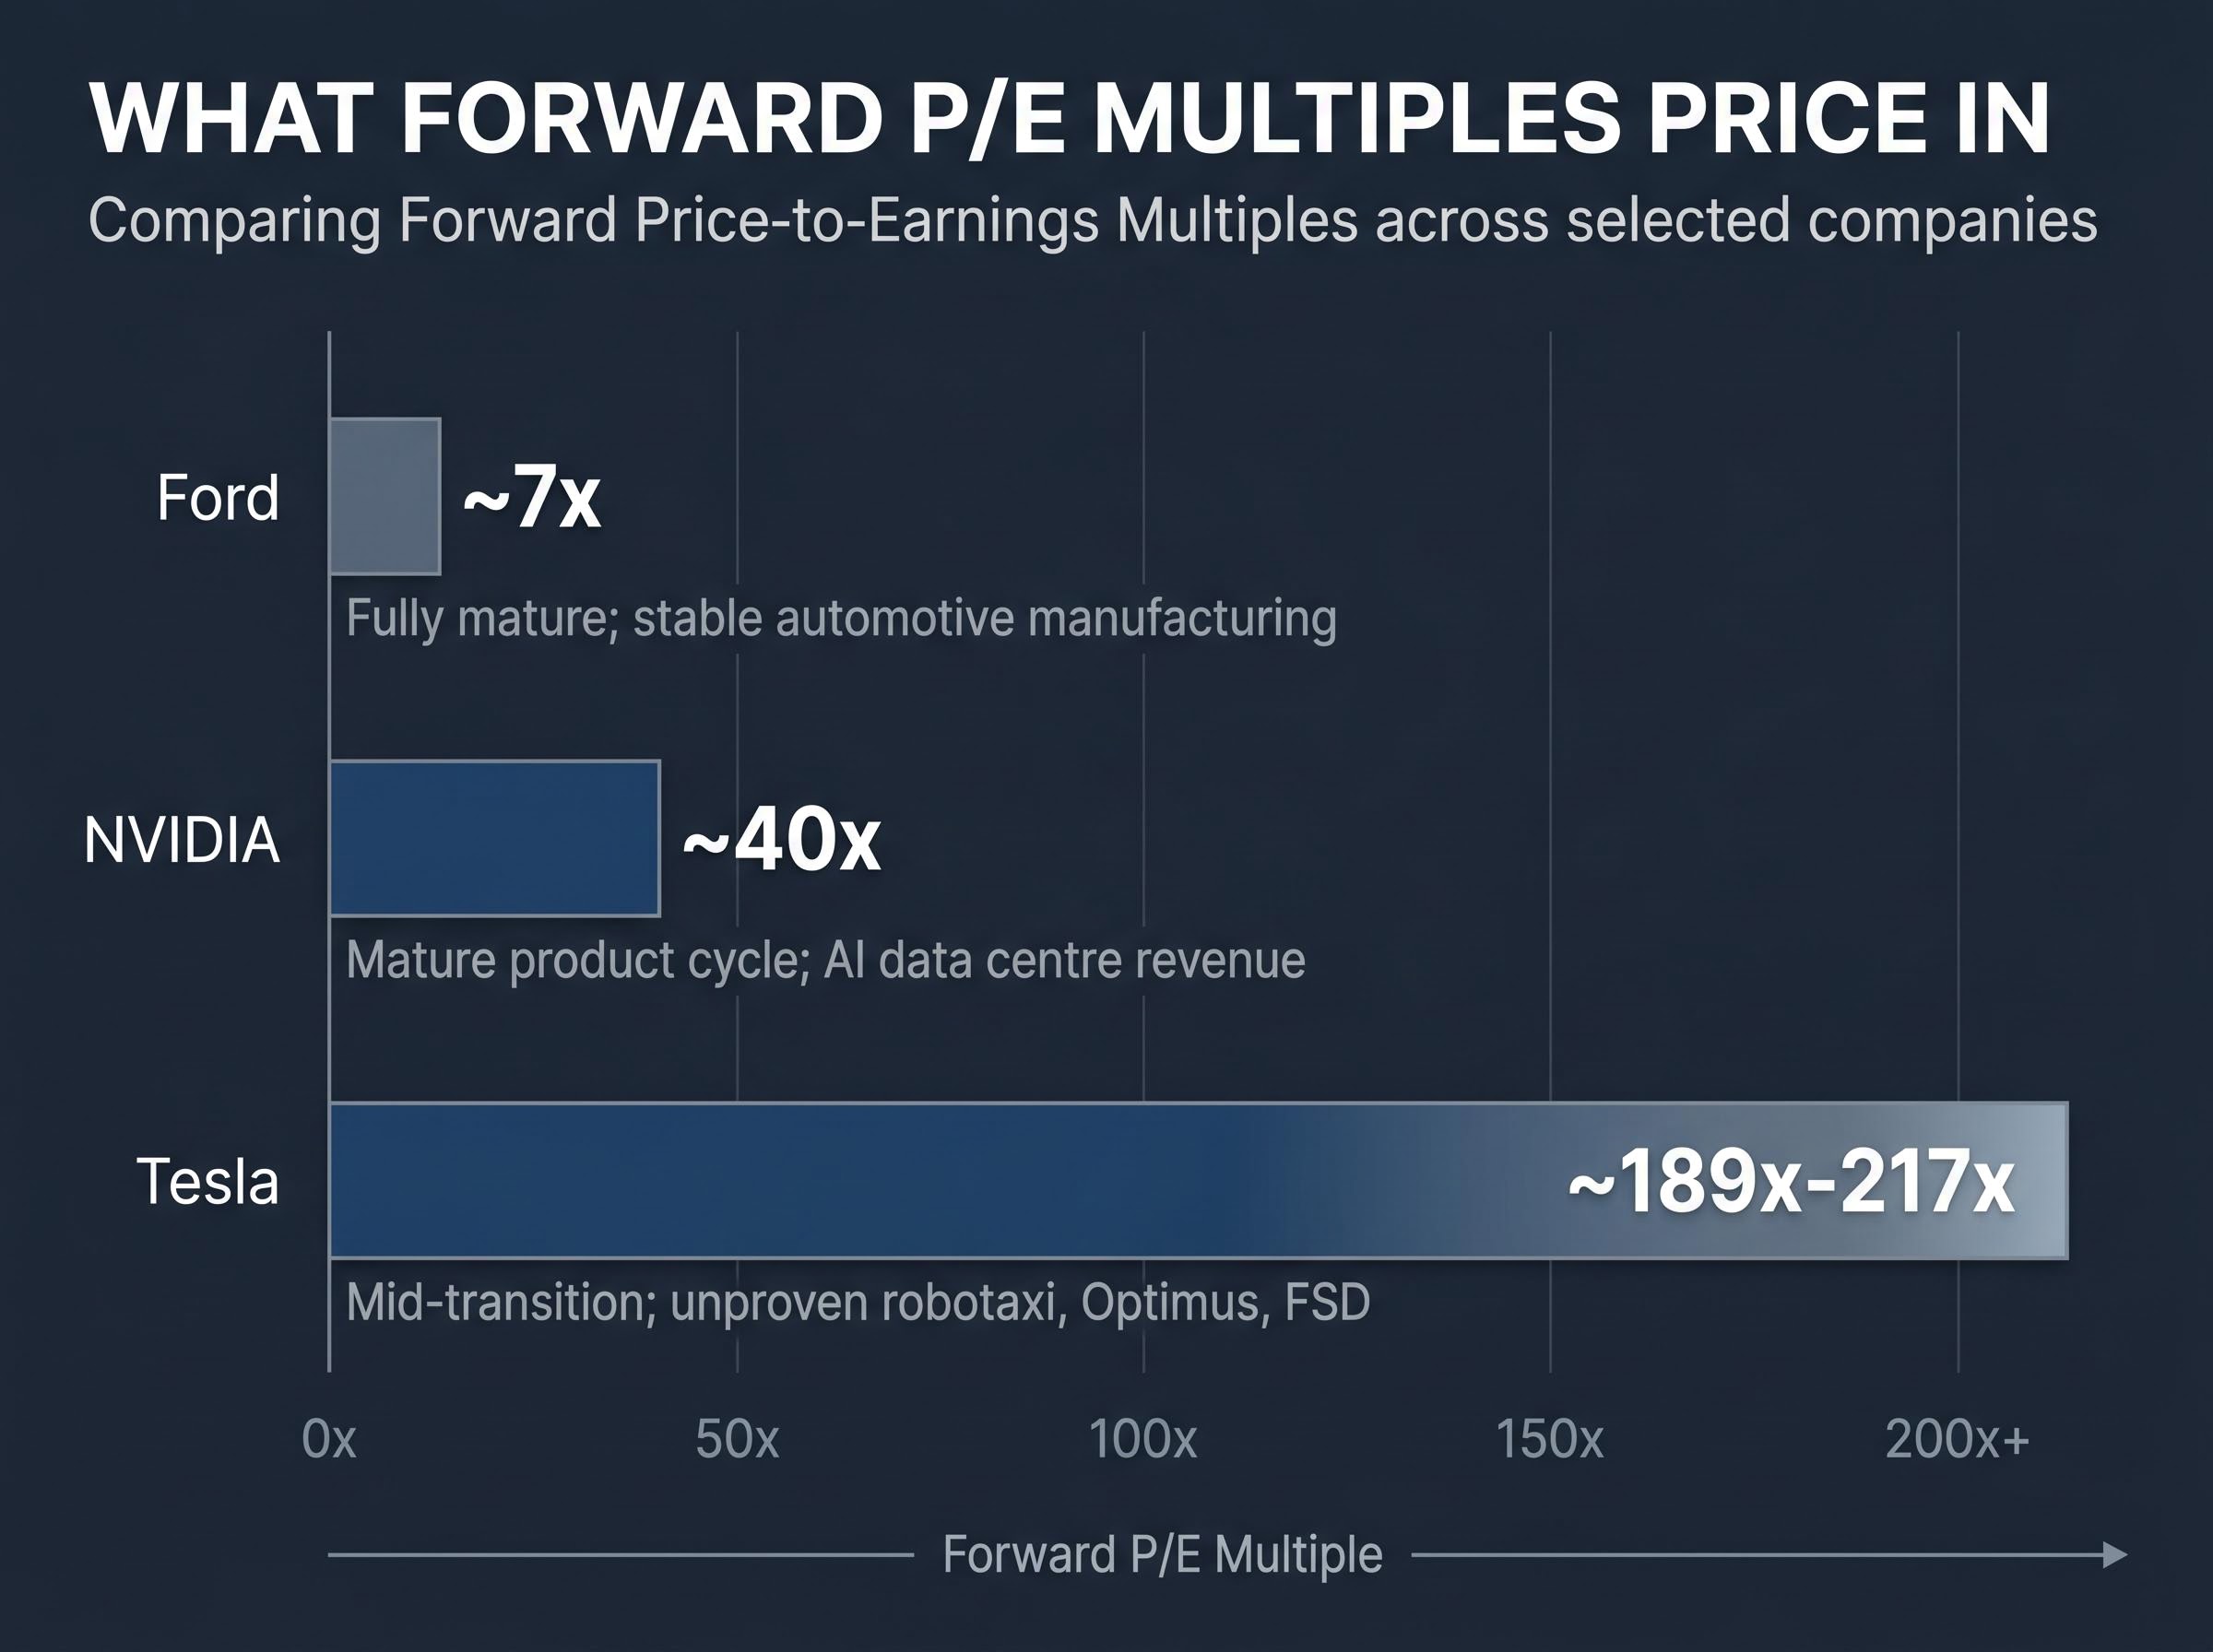
| Company | Forward P/E | What the multiple prices in | Business model maturity |
|---|---|---|---|
| Tesla | ~189x-217x | Unproven robotaxi, Optimus, and FSD licensing revenue | Mid-transition; core EV business profitable, future revenue streams speculative |
| NVIDIA | ~40x | Proven, rapidly scaling AI data centre revenue | Mature product cycle with demonstrated demand and revenue visibility |
| Ford | ~7x | Stable automotive manufacturing and fleet sales | Fully mature; limited growth premium embedded |
NVIDIA’s ~40x multiple sits between the two extremes and is instructive. It prices in rapid AI revenue growth, but that growth is already visible in quarterly results. Tesla’s multiple prices in a transformation that remains, as of May 2026, largely theoretical.
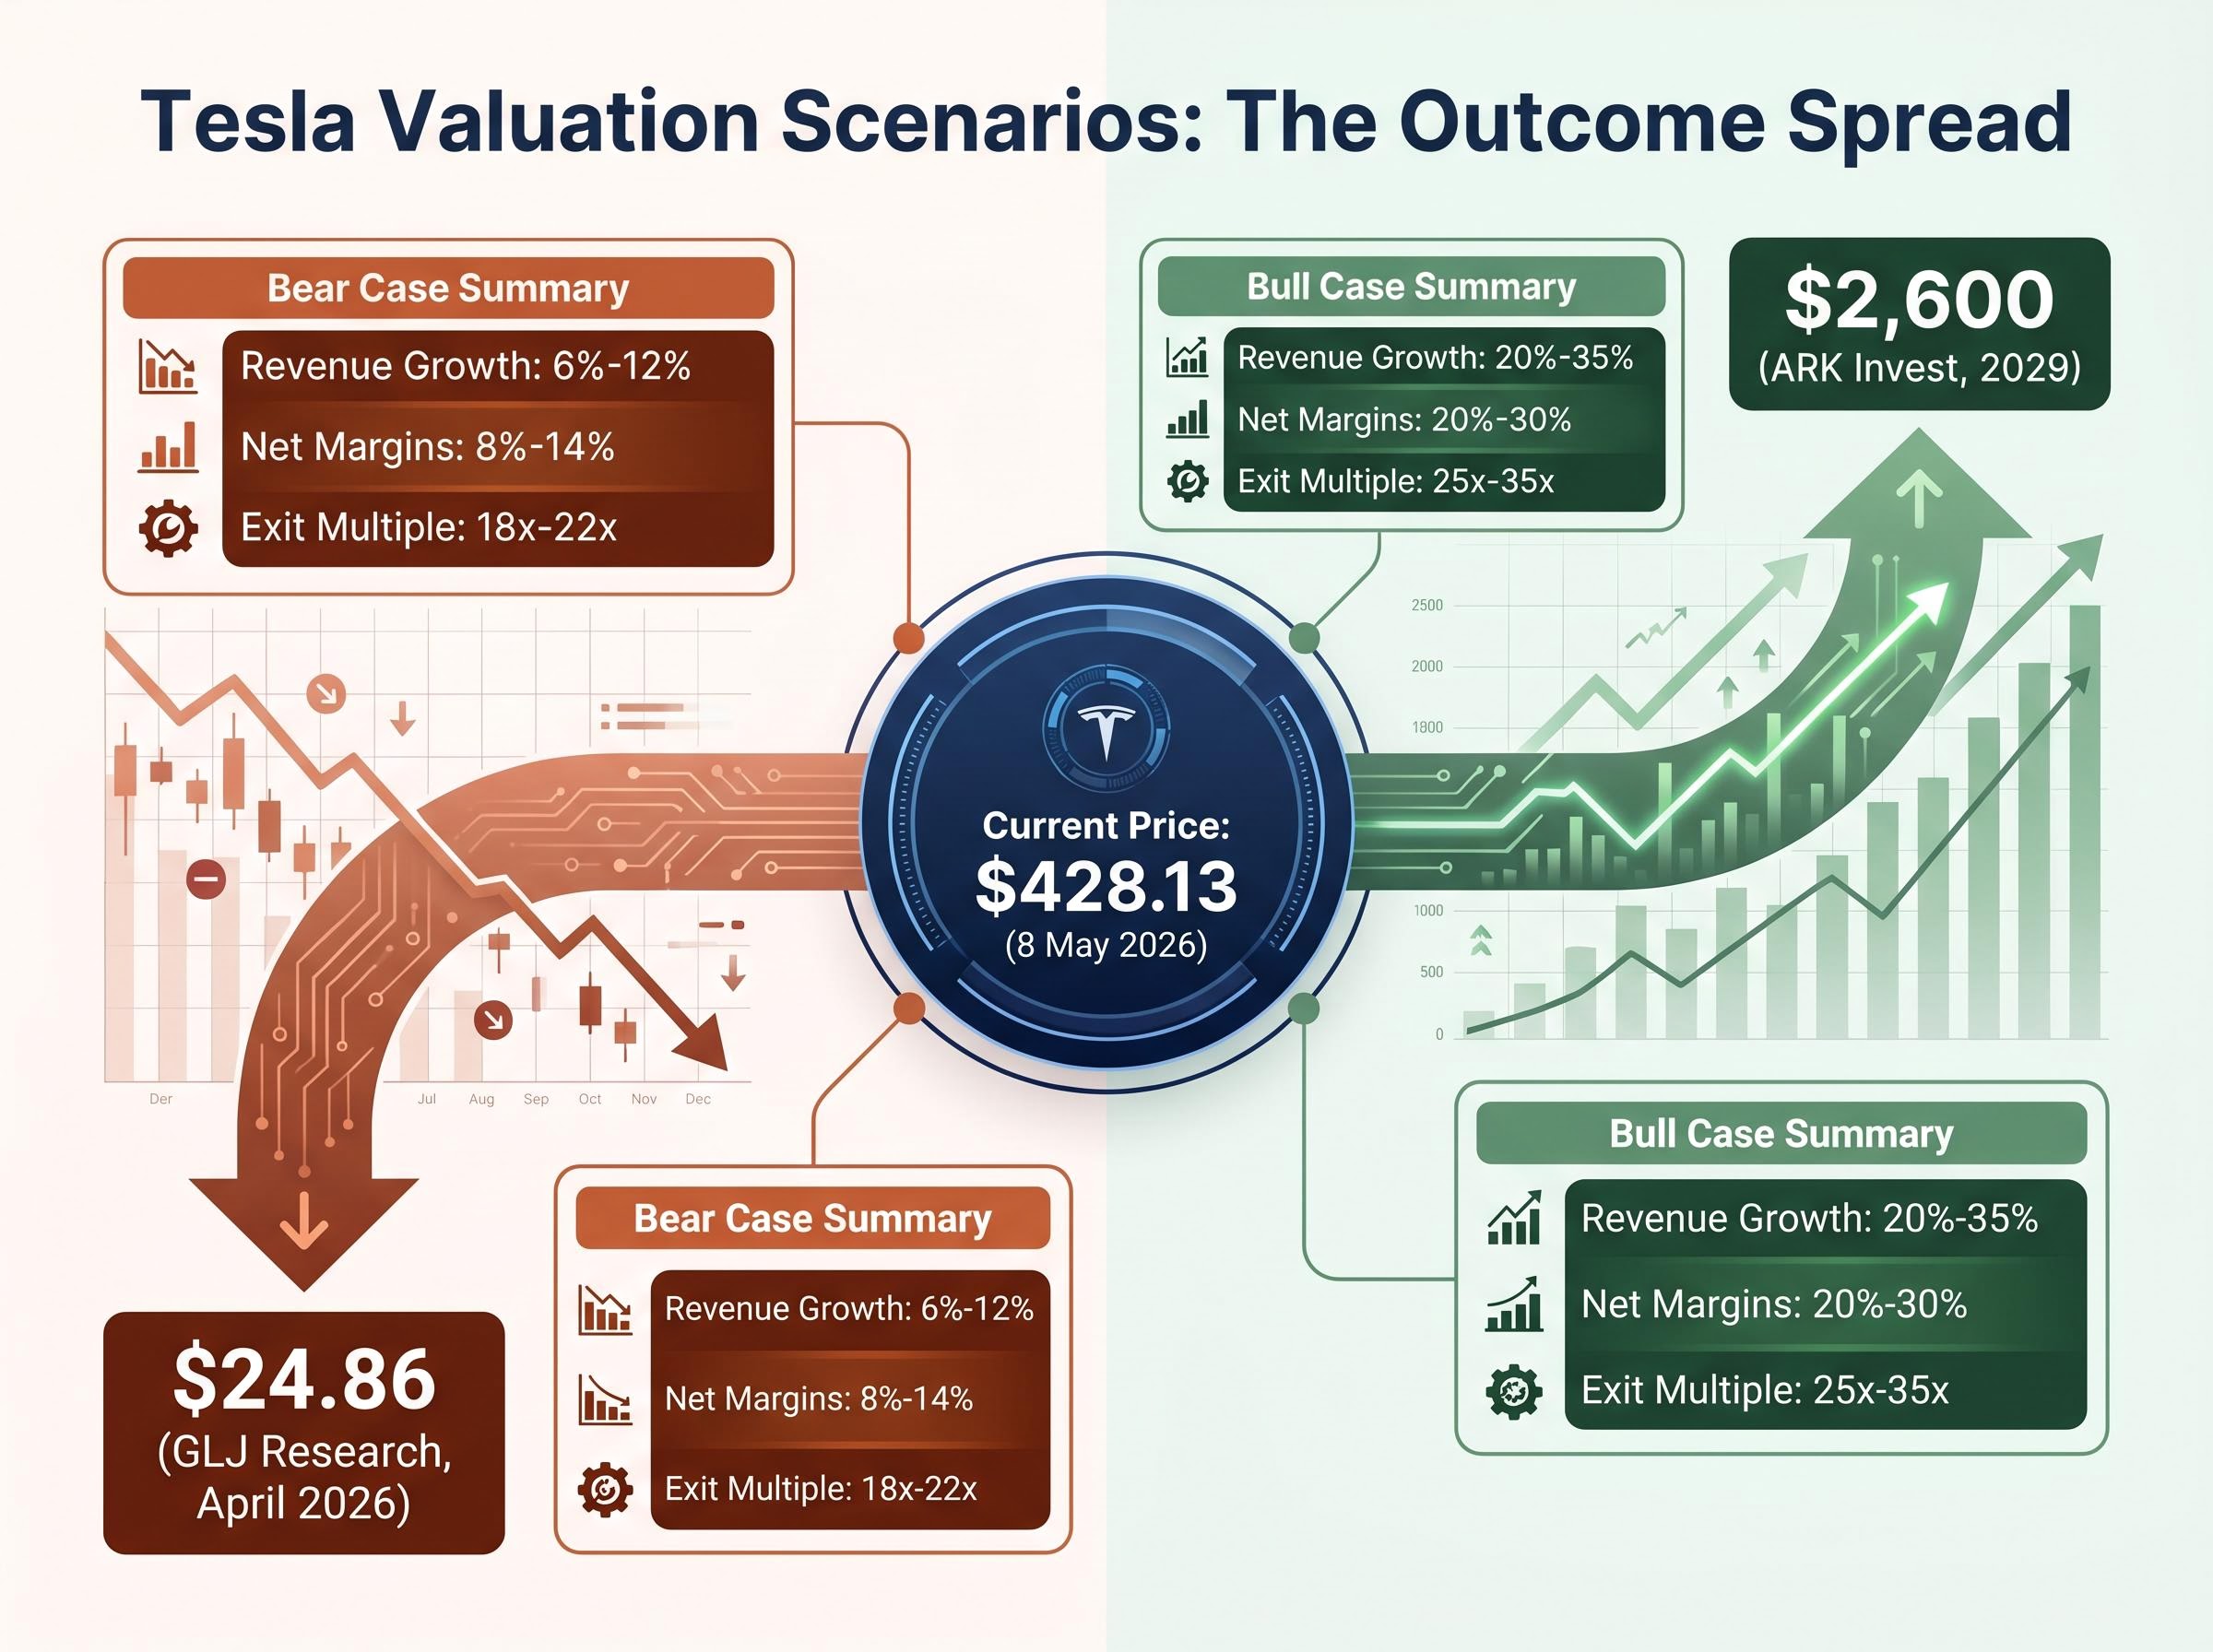
Two analysts can examine identical Tesla data and arrive at price targets of $24.86 and $2,600 respectively. That spread is not a failure of analysis. It is the honest output of a company where the outcome distribution is extraordinarily wide.
Every scenario model rests on three inputs: a revenue growth rate assumption, a net profit margin assumption, and an exit valuation multiple. Each variable compounds the others, which is why small differences in assumptions produce enormous differences in output.
The bull case inputs for Tesla look like this: revenue growth of 20%-35% (midpoint approximately 27%), net margins expanding to 20%-30% from the current 7%-10% range, and exit multiples of 25x-35x earnings. These figures assume FSD reaches Level 4 autonomy, the robotaxi fleet scales commercially, and Optimus contributes meaningful revenue by 2030. ARK Invest’s $2,600 target (a 2029 model, not a 12-month price target) sits at the far end of these assumptions.
The bear case inputs are more restrained: revenue growth of 6%-12% (midpoint approximately 9%), margins of 8%-14%, and exit multiples of 18x-22x. Under this framework, at a share price of approximately $375-$428, every projected 10-year return was negative. GLJ Research’s Gordon Johnson published a $24.86 Sell target in April 2026, anchored in assumptions that EV demand stalls, FSD faces prolonged regulatory delays, and competition compresses margins.
| Scenario | Revenue growth assumption | Net margin assumption | Exit multiple | Implied 10-year return outcome |
|---|---|---|---|---|
| Bull case | 20%-35% (midpoint ~27%) | 20%-30% | 25x-35x | Substantially positive; supports targets above $1,000 |
| Bear case | 6%-12% (midpoint ~9%) | 8%-14% | 18x-22x | Negative at entry prices above ~$375 |
The consensus 12-month analyst target of approximately $398-$413 implies 3%-7% downside from the $428.13 close on 8 May 2026.
Target dispersion as a risk signal is underutilised by retail investors; when the gap between the highest and lowest analyst price targets on a single stock spans hundreds of percentage points, that spread is not noise in the data but a direct measure of irreducible scenario uncertainty, and treating it as such changes how an investor sizes and monitors the position.
The $24.86-to-$2,600 analyst target range is itself the most important data point in this analysis. It signals that the market has not reached consensus on which company Tesla will become, and every investor buying at the current price is implicitly choosing a position within that range.
Discounted cash flow analysis is not a precision instrument. It is a discipline tool. Its value lies in forcing every optimistic narrative into a falsifiable number, which is exactly what transition-stage valuations require.
One refinement of the DCF approach worth applying to any high-multiple transition stock is reverse DCF methodology, which inverts the calculation: rather than projecting future cash flows to arrive at a price, it starts with the current price and works backward to identify the growth rate and margin expansion that are already embedded in it, revealing exactly how much execution the market has already paid for.
The NYU Stern DCF methodology developed by Aswath Damodaran treats the discount rate as the single variable most sensitive to assumption error, a point directly relevant to Tesla given that small changes in WACC produce hundreds of dollars of difference in implied fair value at a company operating with this level of earnings uncertainty.
The mechanics are accessible. A DCF model projects a company’s future free cash flow (the cash left after operating expenses and capital investment), discounts those cash flows back to today’s value using a rate that reflects the investment’s risk, and adds a terminal value that captures the business’s long-run worth beyond the explicit forecast period.
The result is striking in its implication. Conservative DCF inputs produce an implied fair value roughly equal to Tesla’s current share price of $428.13. The market has already priced in significant execution on the core business. There is no margin of safety under these assumptions. Any upside from here requires bull-case assumptions, specifically robotaxi, Optimus, or AI revenue materialising on an aggressive timeline, to prove correct.
Morningstar analyst Seth Goldstein arrives at a fair value estimate of $400 and recommends a Buy threshold of approximately $280-$320, representing a 20%-30% discount below fair value. At $428, the current price sits above even the fair value estimate, let alone the margin-of-safety threshold.
Tesla’s individual valuation premium does not sit in isolation; broader market valuation signals, including the Buffett Indicator reaching 223.6% as of May 2026 and a deteriorating equity earnings yield relative to Treasury yields, create a macro backdrop in which the absence of a margin of safety in individual high-multiple names carries compounded risk.
One additional pressure point deserves attention. Tesla’s CFO guided for more than $25 billion in capital expenditure for 2026 during the Q1 earnings call. That level of investment is expected to produce negative free cash flow in the near term, meaning the $15 billion FCF projection for 2027 itself carries execution risk.
Past performance does not guarantee future results. Financial projections are subject to market conditions and various risk factors.
The numbers in a scenario model are only as credible as the real-world evidence behind them. Here, the evidence introduces friction that the bull case must absorb.
Waymo (an Alphabet subsidiary) is already operating at Level 4 autonomy commercially in multiple U.S. cities, with no safety driver in the vehicle. Tesla, as of May 2026, is still operating under supervised testing conditions in every U.S. state where it has a presence. The company expanded supervised FSD testing to Dallas and Houston in March 2026, but no unsupervised commercial approvals exist in any jurisdiction.
The California regulatory situation illustrates the gap between narrative and reality. Tesla does not hold an unsupervised deployment permit in California. In February 2026, the company sued the California DMV over a false advertising ruling related to FSD marketing claims. That legal dispute highlights the distance between public messaging on autonomy and the regulatory permissions actually in hand.
Execution risk calibration sits outside the formal scenario model and must be assessed as a separate step; the gap between Waymo’s 2 million completed paid rides and Tesla’s absence from unsupervised commercial deployment is precisely the kind of real-world evidence that should move probability weights between scenarios rather than being absorbed into a single-point growth rate assumption.
The California DMV autonomous vehicle deployment permits framework distinguishes between supervised testing authorisations and full deployment permits that allow driverless commercial operation, a distinction that matters materially when evaluating how close any company is to generating robotaxi revenue at scale.
On the robotics front, Figure AI and Boston Dynamics represent credible, well-funded competition for Tesla’s Optimus programme. The humanoid robotics market is unlikely to produce a winner-take-all outcome, which compresses the probability that Tesla’s projected 2027 commercial deployment timeline translates into dominant market share.
In 2019, Elon Musk projected that Tesla would have one million robotaxis on the road by end of 2020. As of May 2026, the company has yet to launch a single unsupervised commercial robotaxi service in any market.
These statements are speculative and subject to change based on market developments and company performance.
The same company, with identical future prospects, produces radically different investor outcomes depending solely on the entry price. This is the variable that turns a correct thesis into a good investment, or a correct thesis into a loss.
Consider Tesla’s own price history. A buyer who acquired shares at approximately $100 a few years prior holds the same asset as a buyer at $428.13. Both own a claim on the same robotaxi potential, the same Optimus programme, the same FSD software. But the buyer at $100 has already absorbed more than 300% in gains as a cushion against execution delays. The buyer at $428 has none.
NYU Stern professor Aswath Damodaran has estimated that Tesla’s current price embeds approximately 70% probability of the bull-case scenario materialising. A buyer at today’s price is not making a tentative bet on transition. They are making a high-confidence wager that unproven revenue streams will arrive largely on schedule.
The practical tool for managing this exposure is probability-weighted target construction, which forces explicit assumptions rather than intuitions.
If the weighted target falls below the current market price, the position lacks a margin of safety regardless of how compelling the bull-case narrative feels. Forward analyst EPS estimates project more than 5x growth from current levels, but those estimates require the transition to succeed on schedule.
Morningstar guidance suggests limiting exposure to high-uncertainty transition stocks to approximately 5% of a retail investor’s portfolio.
The methodology demonstrated throughout this guide is portable. The inputs change; the process does not. For any high-multiple stock where the current price is pricing in a transformation that has not yet happened, the following five-step framework applies:
Tesla’s Q1 2026 results anchor the point: $22.4 billion in revenue, 21.7% gross margin, and $0.40 EPS represent beats across every consensus estimate. The automotive business is performing. Yet the $350-$450 DCF range under conservative inputs means a buyer at $428 has essentially no cushion built into the price.
When the bear case produces no positive returns and the bull case requires unproven transitions to materialise on schedule, the margin of safety is not thin. It is absent.
The methodology taught here, scenario construction, DCF anchoring, probability weighting, and entry price sensitivity, is the durable output. Tesla is the vehicle, not the destination.
The most likely outcome for Tesla may sit between the extremes: partial execution on autonomy and robotics while the core EV business continues to grow. Returns in that middle path would land somewhere between GLJ’s $24.86 and ARK’s $2,600, and a framework that assigns explicit probability to this scenario is more useful than binary thinking.
Before buying any high-multiple stock, a disciplined investor should be able to write down the specific assumptions embedded in the current price and assess honestly whether those assumptions carry a probability of materialising that justifies the absence of a margin of safety. If the answer requires conviction that unproven technology will arrive on a timeline its own creator has repeatedly missed, the price is doing the hoping for the investor.
This article is for informational purposes only and should not be considered financial advice. Investors should conduct their own research and consult with financial professionals before making investment decisions.
Stock valuation analysis is the process of estimating a company's intrinsic worth by examining financial metrics, future cash flow projections, and scenario assumptions. For transition-stage companies like Tesla, it is especially critical because traditional multiples like P/E ratios reflect speculative future revenue streams rather than current earnings power.
A DCF model projects a company's future free cash flow, discounts those cash flows back to present value using a risk-adjusted rate (WACC), and adds a terminal value for long-run worth. Applied to Tesla under conservative inputs, a projected 2027 free cash flow of roughly $15 billion, a 10% WACC, and a 15x terminal multiple produce an implied fair value range of approximately $350-$450 per share.
The margin of safety is the gap between a stock's estimated fair value and its current market price, acting as a buffer against execution risk. At Tesla's May 2026 price of $428.13, conservative DCF inputs produce a fair value roughly equal to the current price, meaning there is effectively no margin of safety and any upside requires bull-case assumptions to prove correct.
Assign explicit probabilities to each scenario (for example, 25% bull case, 45% base case, 30% bear case), multiply each scenario price target by its assigned probability, then sum the weighted values to produce a probability-adjusted target. If the resulting weighted target falls below the current market price, the position lacks a margin of safety regardless of how compelling the bull-case narrative appears.
Ford's forward P/E reflects earnings from a mature, predictable automotive business, while Tesla's numerator (its share price) embeds revenue streams that do not yet exist in material form, including robotaxi operations, Optimus robotics, and FSD software licensing. Comparing the two multiples treats fundamentally different probability bets as equivalent measures, which distorts any conclusion about relative value.


