On 30 September 2026, roughly $5.36 million in bullish call premium swept into Micron Technology options across seven separate prints. On that same day, the options market was pricing the smallest expected earnings move in Micron shares in roughly two years. Those two facts do not comfortably sit together, and the gap between them is the puzzle worth solving.
Micron then delivered. Q4 FY2026 revenue came in at $54.23 billion against a consensus range of $50.45 billion to $51.49 billion, and adjusted earnings per share reached $33.42, ahead of the $31.16 figure cited in research coverage. It was the company’s tenth consecutive quarterly earnings beat.
Here is the thing: the beat is almost beside the point. The real question is what the options tape was telling you before the print, and why that signal is far harder to read than a headline dollar figure makes it look. After this, you will be able to tell a well-built earnings options trade from a long-shot using the same data, understand why cheap implied volatility matters more than raw call volume, and know why Micron’s beat streak is not the reassuring statistic it appears to be.
What $67.50 of implied move actually tells you about Micron options pricing
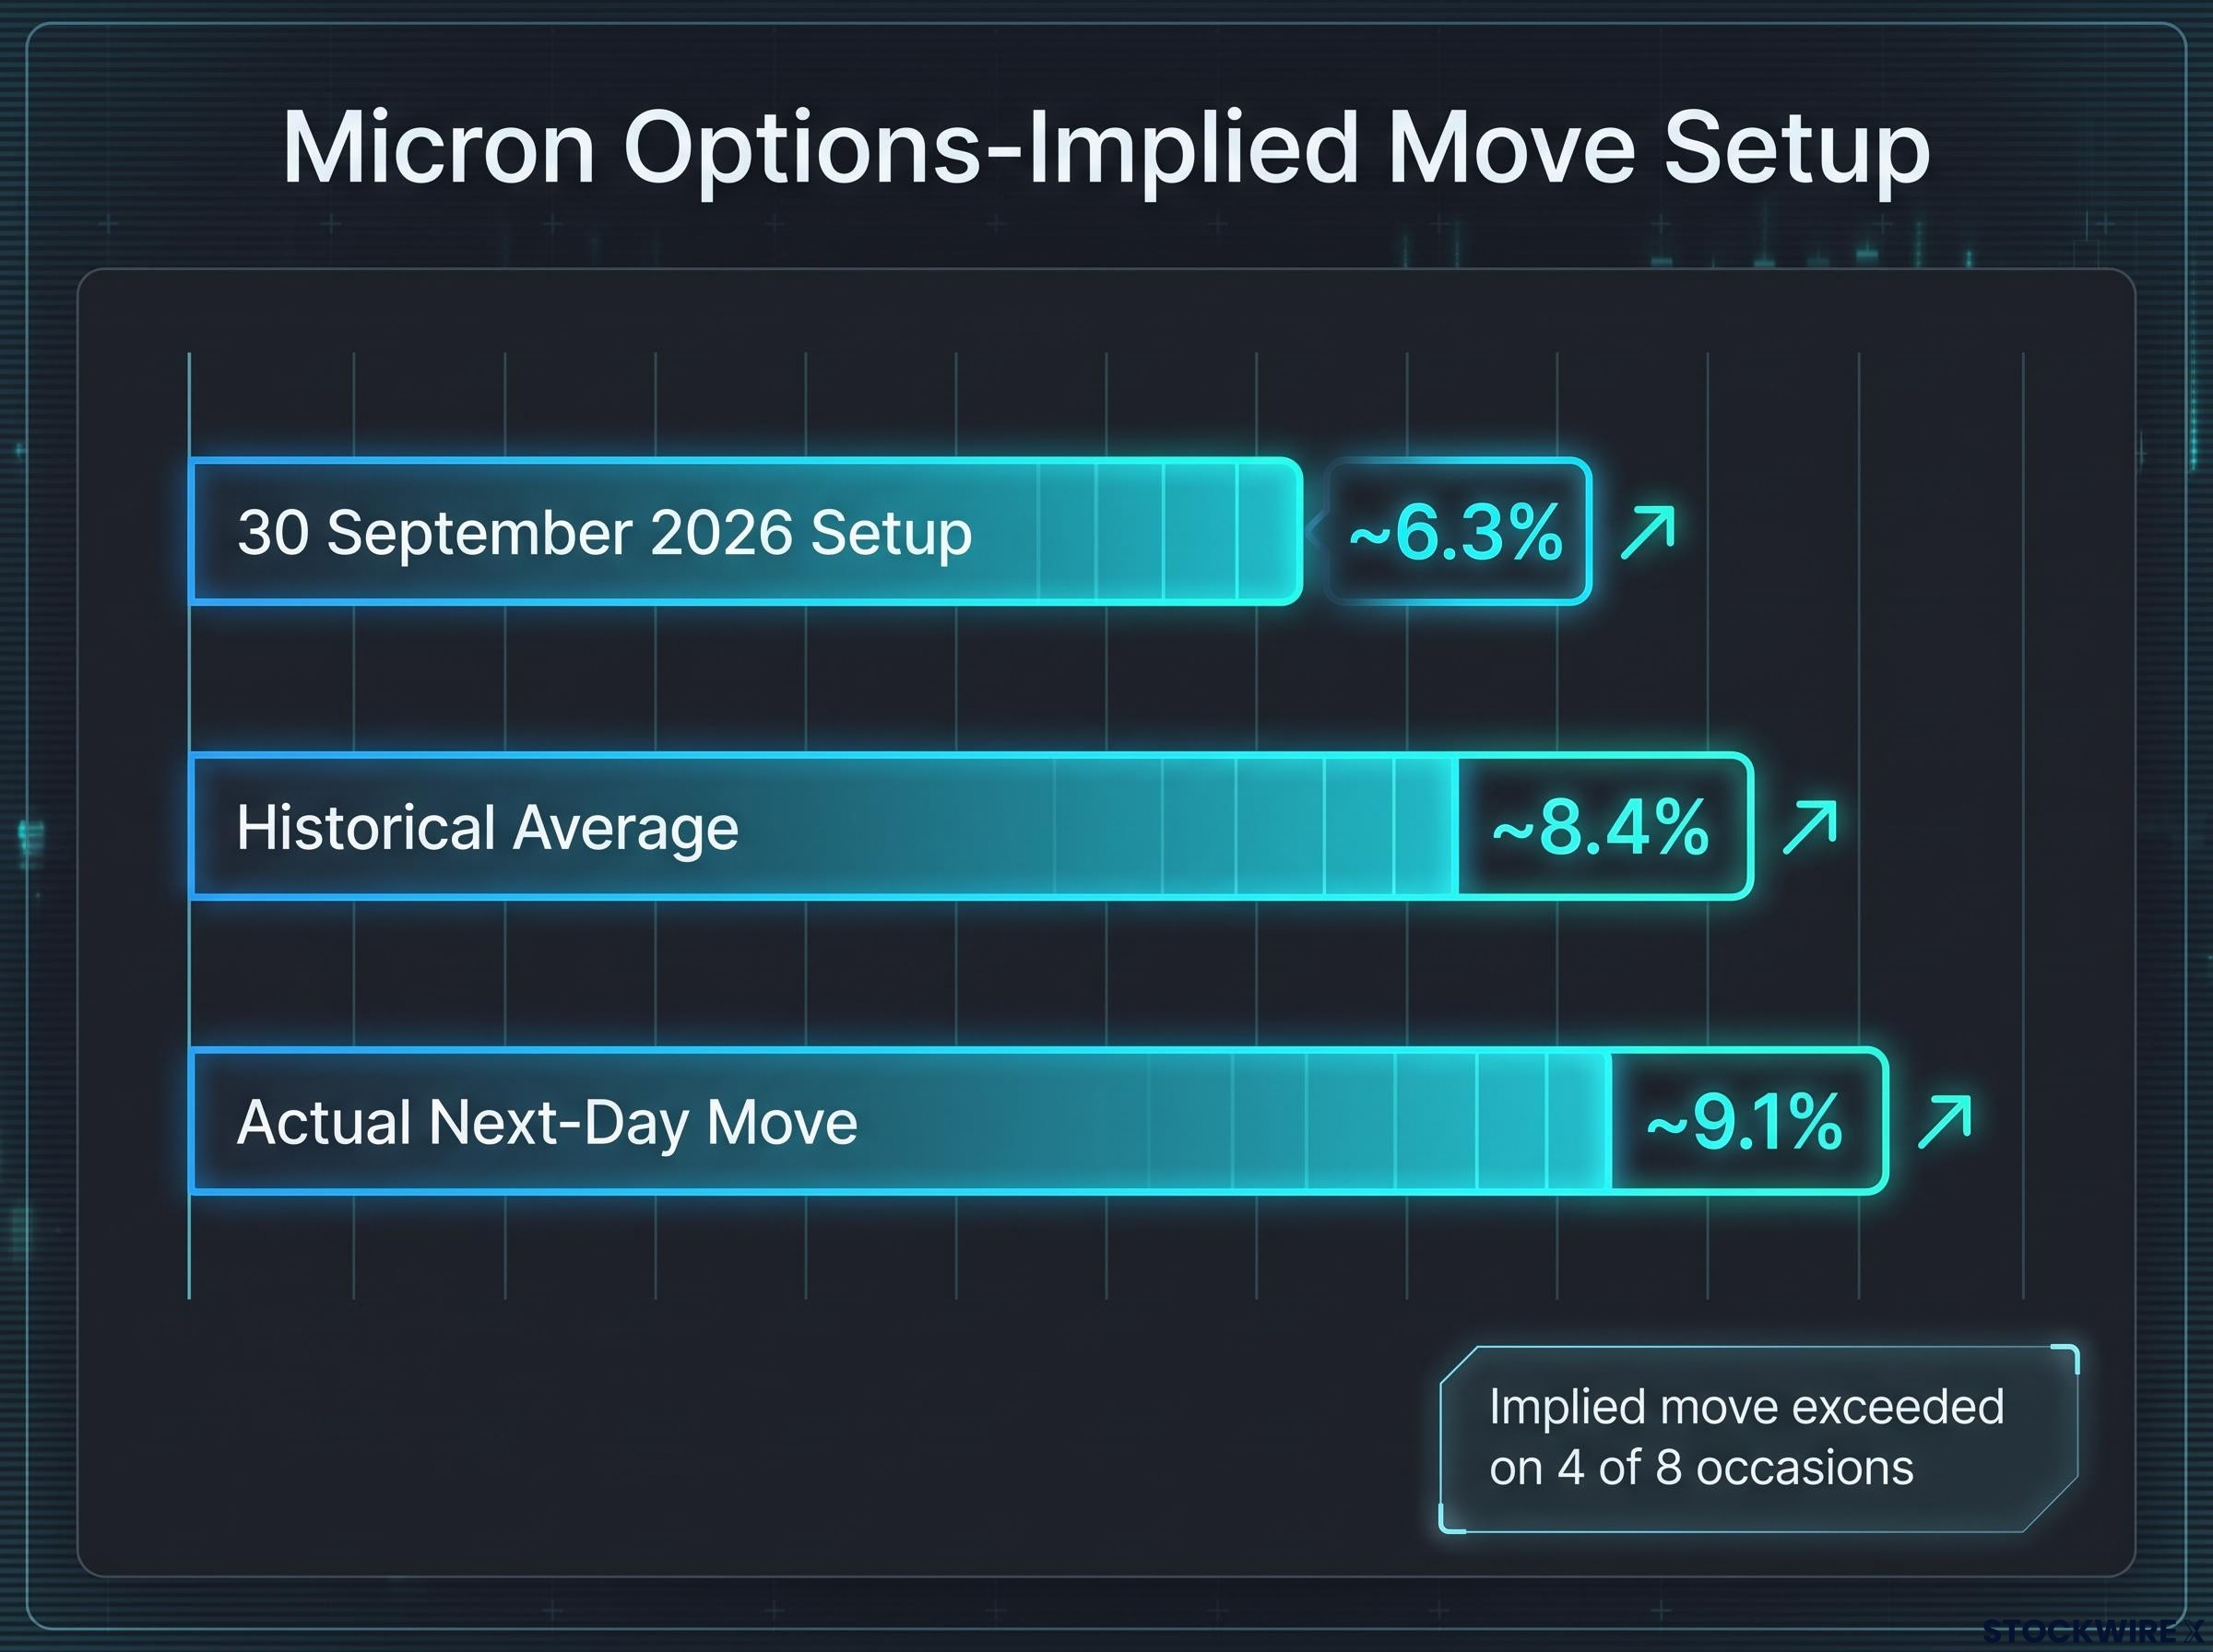
Before any of the call flow makes sense, you need to read one number: the implied move. Heading into the Q4 FY2026 print, Micron options were pricing an expected swing of roughly $67.50, or about 6.3%, in either direction around the earnings event.
That figure comes from the cost of a near-expiry at-the-money straddle, which is simply the price of buying both a call and a put at the current share price. The more traders pay for that combination, the larger the move they expect. In plain terms, the implied move is the market’s consensus guess at how far the stock travels by expiration, up or down.
The cost of a near-expiry at-the-money straddle is the market’s aggregated probability estimate for future price movement, and implied volatility basics explain exactly how that single number flows downstream into every Greek, probability percentage, and strategy selection framework visible on your options chain.
Why does this matter to you? Because the implied move is the baseline against which every single options trade gets judged as cheap, expensive, or fair. Without it, the $5.36 million in call premium that followed is just a big number with no reference point.
Historical average implied move: roughly 8.4%. The 30 September implied move: roughly 6.3%. The gap is the setup.
A 6.3% implied move was notably light for Micron. Across the prior eight earnings reports, options had priced an average expected move of roughly 8.4%. This was the smallest options-priced earnings expectation for the stock in about two years. For you, that discount means the market was offering event exposure in Micron at historically cheap prices before the print, which changes the risk-reward maths for call buyers no matter what they thought about the fundamentals.
(A separate figure of 7.3% was cited by Business Insider ahead of the same report. It was not independently confirmed, so the 6.3% figure, which carries supporting historical data, is the one used here.)
How the historical comparison changes the way you read the tape
Here is where the pattern sharpens. Across those same prior eight reports, Micron’s actual average next-day move was roughly 9.1%, while options had priced only 8.4%. The stock has tended to move further than the market expected.
Micron also exceeded its implied move on four of the prior eight occasions, a coin flip. The historical data does not tell you direction. It tells you the market has repeatedly underpriced Micron’s realised volatility, which makes a below-average implied move an unusually interesting starting point rather than a reason for comfort.
| Measure (prior 8 reports) | Options-implied move | Actual next-day move |
|---|---|---|
| Historical average | ~8.4% | ~9.1% |
| Implied move exceeded | 4 of 8 occasions | |
| 30 September 2026 setup | ~6.3% | See drift history below |
When big ASX news breaks, our subscribers know first
Two very different bets inside the same bullish flow
Sort the seven call prints out on a table and something becomes obvious: the “bullish call flow” headline is hiding two completely different trades with completely different requirements to pay off.
The first bucket is near-dated. Roughly $1.3 million went into October 2nd $1,150 calls, with a breakeven near $1,180, about 3% above the pre-earnings share price. Another $564,000 hit October 2nd $1,100 calls, breakeven around $1,131, roughly 5.2% higher. A further $984,000 went into October 9th $1,080 calls, breakeven near $1,100.
Those three trades share a profile. Their strikes sit within or just outside the 6.3% implied move, their expirations are short, and they were executed at or above the ask. That combination is conventional event positioning: a straightforward directional bet on a post-earnings pop, bought while implied volatility was cheap.
The second bucket is a different animal entirely. Roughly $2.51 million was deployed across three sweeps and one split into October 16th $1,300 calls, breakeven around $1,311. That requires the stock to climb about 21.8% from pre-earnings levels.
A 21.8% move is not an earnings reaction. It is roughly three times the implied move. For that trade to work, you need not just a good quarter but a wholesale reassessment of the memory-chip sector itself.
| Expiration | Strike | Premium | Breakeven | Required move |
|---|---|---|---|---|
| 2 October | $1,150 | ~$1.3M | ~$1,180 | ~3% |
| 2 October | $1,100 | ~$564K | ~$1,131 | ~5.2% |
| 9 October | $1,080 | ~$984K | ~$1,100 | modest |
| 16 October | $1,300 | ~$2.51M | ~$1,311 | ~21.8% |
Three features defined the near-dated bucket as event positioning rather than speculation:
- Strikes within or just outside the implied move range
- Short-dated expirations clustered around the print
- Execution at or above the ask price
For you, the lesson is that treating the $5.36 million headline as one directional signal is a mistake. The near-dated trades are considered event positioning. The $1,300 calls are a leveraged sector thesis that needs conditions well beyond a good earnings print.
Why large call flow is not the directional signal it appears to be
A sophisticated trader looking at this tape would not take all-at-ask call buying at face value. They would already be applying a filter, and so should you.
Filtering unusual options activity for genuine institutional conviction requires checking four structural markers: net-long versus hedged premium positioning, strike ladder distribution, session spread of execution, and the presence or absence of offsetting flow on the other side of the book.
There are three structural reasons even large, aggressive call flow can mislead:
- Hedging and structured trades. A big call purchase can be the long leg of a buy-write or a customer hedge against a short stock position. The raw flow looks bullish, but the net position may be nothing of the sort.
- Volatility trading, not direction. Some traders buy calls or straddles to bet on the size of the move, not its direction, aiming to profit from realised volatility exceeding what was implied. That flow is agnostic to whether the stock rises or falls.
- IV crush. After an earnings event, implied volatility routinely collapses. A call buyer can be right on direction and still lose money as the volatility component of the option’s price evaporates.
Micron’s own tape supports a measured reading. The pre-earnings call/put ratio was roughly 8:5 with normal overall volume, which points to a modest bullish tilt rather than extreme speculation.
Prediction markets assigned a 96% probability to a Micron beat before the report. When a beat is that widely expected, the question is not whether Micron delivered. It is whether delivery was enough.
The Polymarket figure matters because it shows how fully priced-in a strong quarter already was. Contrast this with a genuine positive case. Ahead of Nvidia’s May 2023 earnings, heavy call flow coincided with cheap-ish implied volatility and a real fundamental surprise, and the stock jumped more than 20% the next day. That is what aligned flow, underpriced volatility, and a fresh surprise look like together.
For you, the practical takeaway is that call flow at the ask is necessary but not sufficient. It needs corroboration from trade structure, volatility pricing, and fundamental context before it earns a place in your thesis.
The beat that keeps not working: Micron’s post-earnings drift history
Look at what actually happens to Micron shares after earnings, and a pattern emerges from the numbers on its own.
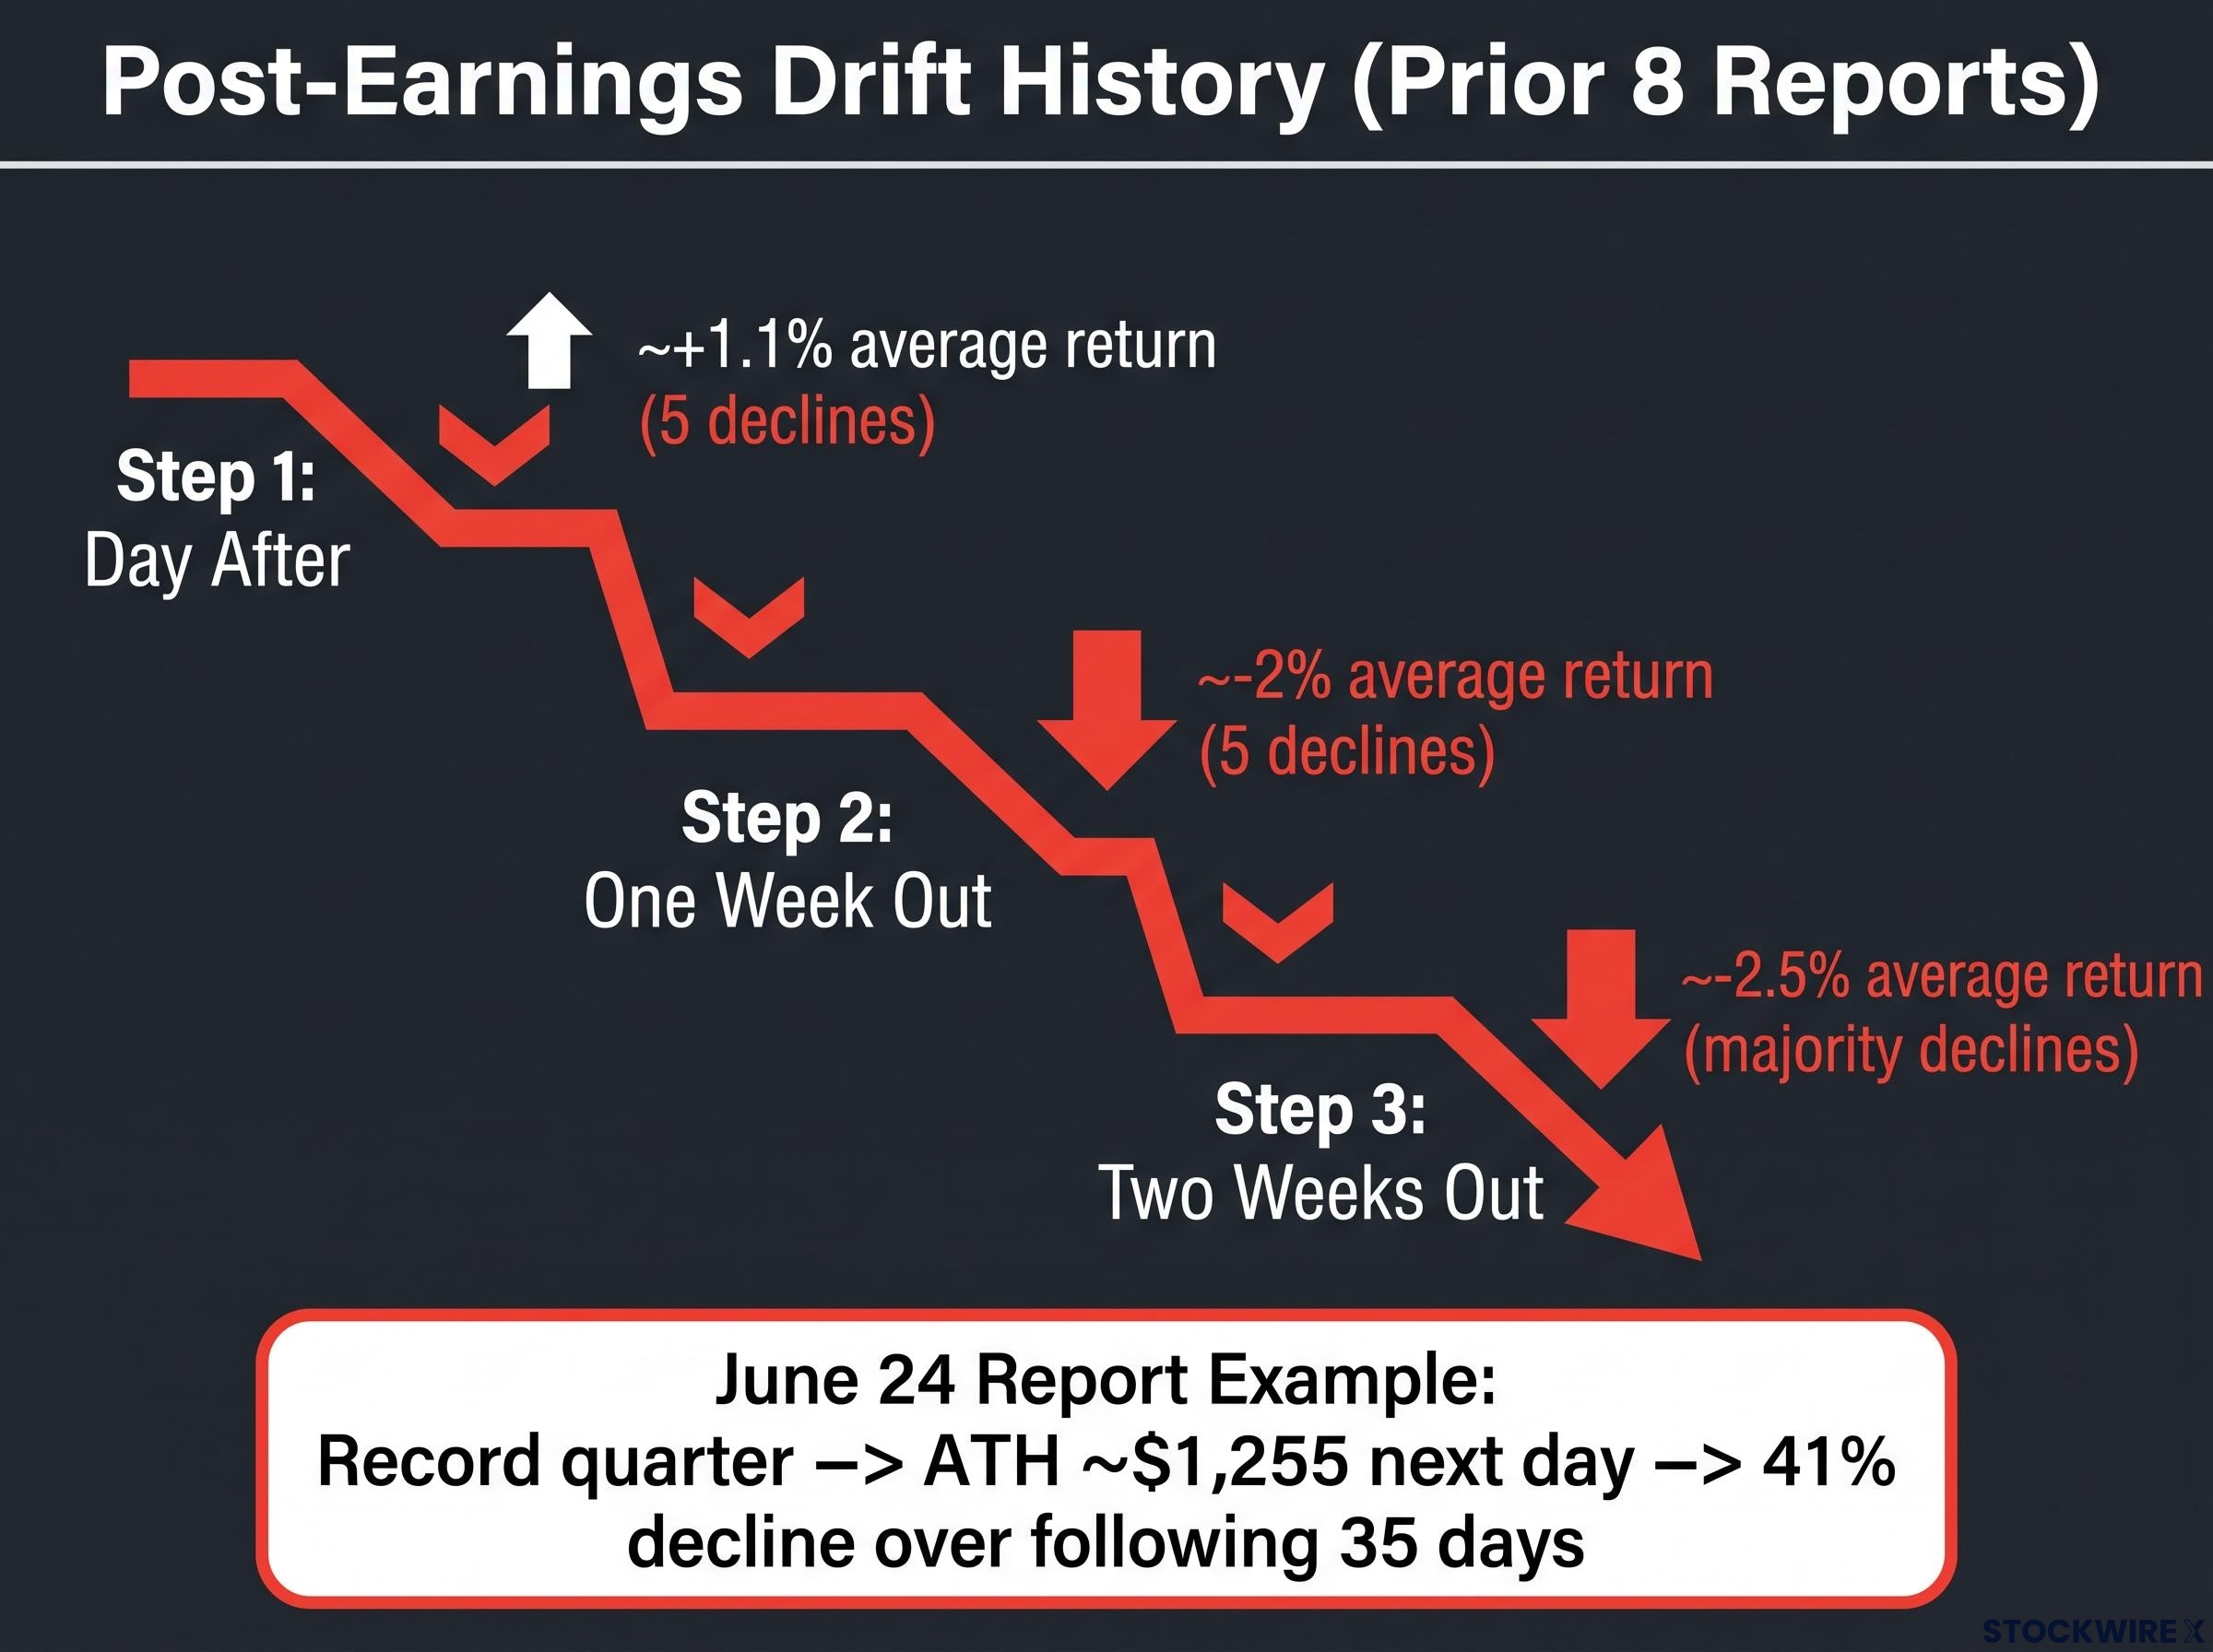
Across the prior eight reports, the day-after reaction averaged a gain of just 1.1%, and the stock finished lower in five of those eight instances. One week out, the average return was roughly negative 2%, again lower in five of eight cases. Two weeks out, it deteriorated to roughly negative 2.5%.
The post-earnings-announcement drift research compiled across more than five decades of market data consistently finds that stocks tend to continue moving in the direction of an earnings surprise for weeks after the announcement, a dynamic that helps explain why Micron’s average one-week return of roughly negative 2% following beats is a feature of the market structure rather than a coincidence.
| Window after earnings | Average return | Declines (of 8 reports) |
|---|---|---|
| Day after | ~+1.1% | 5 |
| One week | ~-2% | 5 |
| Two weeks | ~-2.5% | Majority |
The prior quarter makes the pattern vivid. The June 24 report was a record quarter, and the stock hit an all-time high near $1,255 the next day.
Priced-in expectations, not the absolute quality of the reported quarter, are the primary driver of post-earnings price reactions: with 84% of S&P 500 companies beating EPS estimates in Q1 2026 against a 10-year average of 76%, markets have structurally learned to anticipate beats, which reduces their power to generate incremental price appreciation.
A record quarter. An all-time high of roughly $1,255 the next day. Then a 41% decline over the following 35 days. The beat was real. The rally was not durable.
The Q4 FY2026 reaction fit the template. After-hours moves ranged from about positive 0.16% to positive 2% across different outlets, a muted response relative to the size of the beat. For you, this reframes the whole exercise. The question stops being “did Micron beat?” and becomes “what does a beat actually buy you in sustained price appreciation?” The historical answer is: less than almost anyone expects.
Four reasons a beat does not buy sustained upside
These are observable market dynamics, not warnings:
- Priced-in optimism. When investors are already positioned long into the print, a beat becomes a liquidity event for trimming, not a fresh catalyst.
- Buy-the-rumour, sell-the-news. In high-beta momentum names, traders build positions as upgrades accumulate, then sell once the catalyst confirms.
- Capex and cycle scepticism. Heavy spending plans invite doubt about how long peak margins can last, capping enthusiasm even on strong numbers.
- Institutional repositioning. Large funds routinely rebalance factor and sector exposure after strong prints, producing systematic selling unrelated to fundamentals.
How to read the sector re-rating thesis embedded in the $1,300 calls
The $2.51 million in October 16th $1,300 calls is the tape’s most ambitious and most interesting element. It deserves to be taken on its own terms first.
The bull case is a genuine memory-chip re-rating. Management has guided that AI-driven DRAM demand stays tight through at least 2028. Gross margins reached the high-80s percent range in Q4 FY2026. And analysts had already stacked their price targets well above pre-earnings levels:
DRAM supply dynamics underpinning the AI demand thesis are more durable than a single quarterly beat suggests: DRAM contract prices surged 90-95% in Q1 2026 and a further 58-63% in Q2 2026, and HBM capacity at major producers was sold out through 2026-2027 well before Q4 FY2026 results landed.
- Citigroup: $1,300
- Stifel: $1,500
- Baird: $1,520
- Wells Fargo: $1,525
- JP Morgan: $1,540
- TD Cowen: $1,600
- Street consensus: roughly $1,515
Against that, the structural risks are real. Memory is a historically cyclical business prone to boom and bust. Capex intensity raises free-cash-flow and oversupply concerns. The optimistic AI-demand assumptions embedded in those targets may not hold. And a rotation out of high-beta semiconductors can de-rate the stock regardless of fundamentals.
Ground it back in the framework. The $1,300 calls, requiring 21.8% appreciation and a breakeven near $1,311, are a sector thesis, not an earnings trade, even if they happen to be time-stamped around a print. The ten-quarter beat streak is reassuring but does not change that.
Before treating that position as a signal worth following, evaluate three conditions:
- Sustained AI demand holding through the projected window to at least 2028
- No material industry supply response that compresses DRAM pricing
- No macro shock or sector rotation that de-rates high-beta semiconductors
For you, the honest question is not whether Micron will have a good quarter. It is whether you believe the re-rating case on a multi-month timeframe and risk profile.
What the Micron tape teaches you about every high-profile earnings event
Strip the Micron specifics away and you are left with a repeatable process you can run on the next Nvidia, AMD, or TSMC print.
Three lessons carry forward. Cheap implied volatility matters more than raw call volume: the 6.3% implied move against an 8.4% historical average was the quantifiable edge that made the near-dated positioning rational regardless of outcome. Trade structure, meaning strike, expiration, and execution, is the filter that separates event positioning from sector speculation. And post-earnings drift history, an average one-week return of roughly negative 2%, is a standing argument against assuming a beat equals sustained upside.
The $5.36 million in premium was context for scale, but scale alone did not determine the signal. Structure did.
The signal was not $5.36 million in calls. The signal was $5.36 million in calls at historically cheap implied volatility, with the structure to tell you which bets were event positioning and which were sector speculation.
Run this checklist before you treat large pre-earnings call flow as directional:
- What is the implied move relative to historical norms?
- Are the large call prints clustered within or well outside the implied move range?
- What execution pattern do the trades show: at the ask, split across sweeps, or single prints?
- What does the stock’s post-earnings drift history look like across multiple time windows?
Building the habit of running that checklist every quarter is what separates reactive trading from genuine event-driven analysis.
This article is for informational purposes only and should not be considered financial advice. Investors should conduct their own research and consult with financial professionals before making investment decisions. Past performance does not guarantee future results, and forward-looking statements are speculative and subject to change based on market developments.