A 140-strike IBIT call expiring in January 2028 currently costs less than one dollar per share. That single contract is a bet on Bitcoin reaching roughly 225,000 USD. And despite how far-fetched that target sounds against today’s prices, 32,529 contracts of open interest already sit on it.
The options chain attached to BlackRock’s iShares Bitcoin Trust has quietly become one of the most liquid public data sources for reading how the market prices extreme Bitcoin scenarios. With Bitcoin trading near 77,000 USD in September 2026 and IBIT holding over 60 billion USD in assets, this is not fringe speculation. The implied probabilities embedded in these contracts reflect a genuine cross-section of institutional positioning.
Here is the practical skill you will walk away with: how to look at a long-dated IBIT options chain, convert any strike price into a Bitcoin price equivalent, and read the implied probabilities for what they actually are. Spoiler: they are risk-neutral market pricing, not forecasts. Knowing the difference is what separates a useful sentiment signal from a badly misread crystal ball.
What IBIT actually is, and why options traders use it as a Bitcoin proxy
Everything in this article rests on one number: the conversion ratio between an IBIT share and a whole Bitcoin. Grasp that, and the rest of the options chain becomes arithmetic rather than mystery.
IBIT is a spot Bitcoin exchange-traded fund. It holds actual Bitcoin, not futures contracts, which means each share tracks Bitcoin’s live spot price closely rather than dragging along the basis and roll costs that futures-based products carry.
Each IBIT share represents approximately 0.000566 Bitcoin. That is why IBIT closed at 43.77 USD on 11 September 2026 (per CNBC and Yahoo Finance) while Bitcoin spot sat at roughly 77,193 USD on 12 September 2026 (per CoinGecko and Kraken). The two move in near lockstep.
This tight backing is exactly why institutional options activity has gravitated to IBIT rather than a futures-based alternative like BITO. The spot holding produces cleaner price discovery, and the ETF wrapper makes Bitcoin exposure accessible to funds and platforms that cannot hold crypto directly. With 60.62 billion USD in assets as of 11 September 2026 (YCharts), the fund is deep enough to support serious options markets. Launch day alone saw 353,716 contracts traded, placing IBIT options in the top 1% of all options products by volume.
Bitcoin proxy vehicles each introduce a distinct layer between the investor and Bitcoin’s spot price: IBIT does so through the spot-backed ETF wrapper, while leveraged corporate structures like MSTR amplify that exposure through fixed-obligation capital stacks that do not exist for ETF holders.
The conversion ratio is the tool you will use in every section that follows. It lets you translate any strike price into a Bitcoin target, which is what stops you being confused when a call priced under a dollar turns out to represent a bet on Bitcoin doubling.
| IBIT Share Price | Bitcoin Equivalent | Context |
|---|---|---|
| $43.77 | ~$77,000 | Current price, 11 Sep 2026 |
| $71.80 | ~$126,000 | IBIT all-time high |
| $140.00 | ~$225,000 | Jan 2028 far-OTM call strike |
When big ASX news breaks, our subscribers know first
How to read the IBIT options chain for Bitcoin price scenarios
Now put the ratio to work. The January 21, 2028 expiration is the ideal live example because it runs long and carries real depth, so you can actually convert a strike into a Bitcoin target yourself rather than take it on faith.
Here is what that expiration offers as of 12 September 2026 (OptionCharts):
- Roughly 500 days to expiry
- Total open interest of 380,413 contracts
- A put-call open interest ratio of 0.66
- Implied volatility at the expiration level of 47.03%
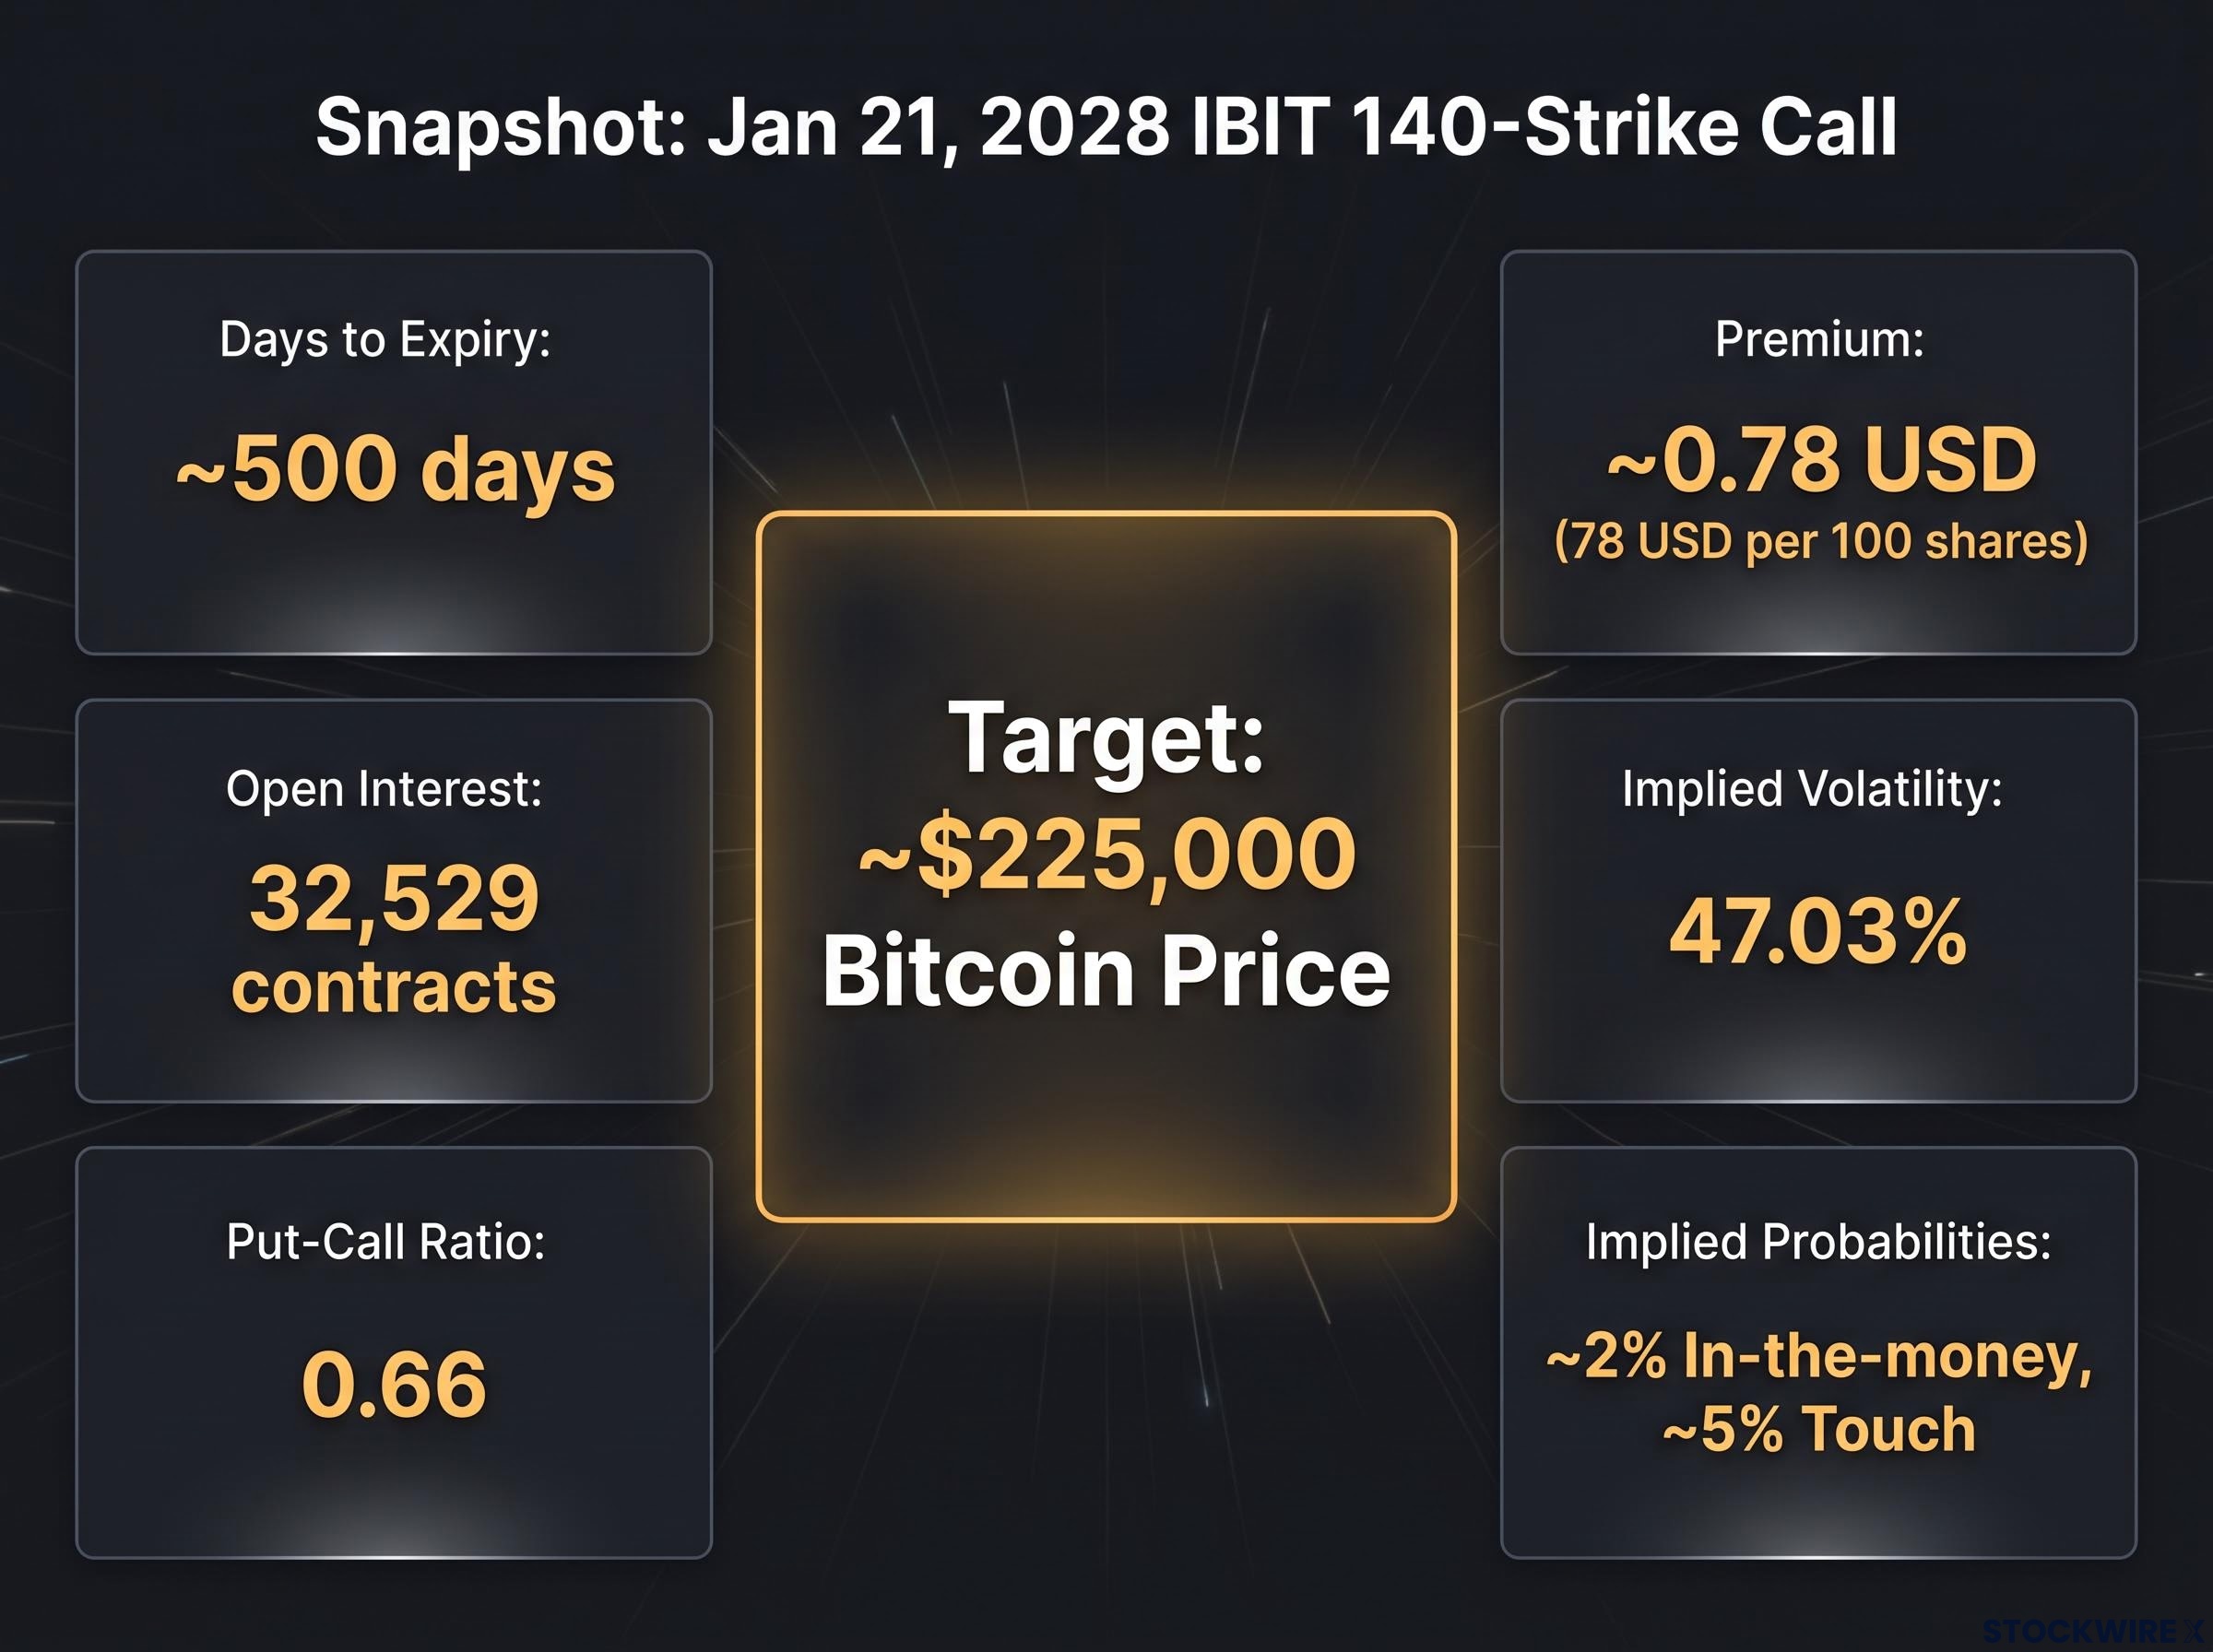
Take the 140-strike call. It last traded at approximately 0.78 USD per share, which is 78 USD to control 100 shares, with 32,529 contracts of open interest. Apply the conversion ratio: a 140 USD IBIT share price maps to a Bitcoin price of roughly 225,000 USD. So this is a bet, held in size, on Bitcoin nearly tripling from here within about 500 days.
The 140-strike snapshot 32,529 contracts of open interest on a call costing roughly 78 USD to control 100 shares, targeting a Bitcoin price around 225,000 USD.
The chain spans a whole range of extreme targets, not just one. The 100-strike call carries roughly 20,000 contracts of open interest (per tastytrade channel analysis), and the June 2028 cycle, at around 645 days out, caps at the 100 strike, while January 2028 reaches all the way to 140.
Read those two facts together and you get a picture of the positioning. A put-call ratio of 0.66 means more calls than puts are open, which reads as cautious but not bearish at the aggregate level. Yet large open interest sitting on far-out call strikes tells you there is a meaningful speculative tail reaching for extreme upside. The chain is a readable map of where money has been placed, once you know how to convert the strikes.
What “implied probability” actually means, and why it is not a forecast
The number you will most want to take literally is the one you should trust least. The 140-strike IBIT call carries an estimated in-the-money probability of approximately 2% at expiration, and roughly 5% for the price merely touching that level at any point during the 500-day cycle (per tastytrade channel analysis). It is tempting to read that as “the market thinks there is a 2% chance Bitcoin hits 225,000 USD.” That reading is wrong.
Risk-neutral probability vs. real-world probability
Options prices embed what are called risk-neutral probabilities. These are not the same as physical, real-world probabilities of an event happening.
A risk-neutral probability is the figure the market needs in order to make an options transaction fair, given the current implied volatility of 47.03% and the prevailing discount rate. It is a pricing quantity, not an unbiased estimate of what will actually occur.
Implied volatility is itself a risk-neutral construct: it is reverse-engineered from live market prices rather than drawn from historical data, so the 47.03% figure on the January 2028 IBIT expiration tells you what the market collectively prices as expected movement magnitude, not what movement will actually arrive.
MIT’s risk-neutral pricing framework formalises why the probability embedded in an options price is a mathematical quantity derived from no-arbitrage conditions, not a statistical estimate of real-world likelihood, a distinction that becomes especially important when the underlying asset has heavy-tailed returns like Bitcoin.
The distinction that matters most Risk-neutral probabilities are what the market prices, not what the market predicts. Treating one as the other is a category error.
Two things push the risk-neutral figure away from real-world odds. First, the standard pricing models assume a log-normal distribution of returns, the smooth bell-curve shape used in Black-Scholes. Bitcoin’s returns are heavy-tailed, meaning extreme moves happen far more often than a bell curve implies. A single-volatility model systematically understates that tail.
Second, traders demand compensation for risk, which distorts the tails further. Bybit’s research into a comparable target, a 10.3% implied probability of Bitcoin reaching 150,000 USD by end-2026, was explicit that this was “market pricing rather than a forecast,” and warned that options markets may be conservatively positioned relative to macro and regulatory developments.
So the 2% figure is not the market’s verdict on whether Bitcoin reaches 225,000 USD. It is the price of risk under a model with known limitations, applied to an asset with known non-normal behaviour. Read it as a sentiment gauge and it is genuinely useful. Read it as a prediction and you have misunderstood what it is.
Why IBIT dominates Bitcoin options liquidity, and what that means for signal quality
If the implied probabilities are a sentiment tool, the next question is whether this particular market’s sentiment is worth reading. It is, and the reason has less to do with sheer size and more to do with who is trading and how deep the book runs.
Four structural features give IBIT its liquidity advantage:
- It holds spot Bitcoin, so its options can hedge direct exposure cleanly, unlike BITO’s futures-basis structure.
- Its AUM has climbed past 60 billion USD, drawing market-maker and institutional flow that deepens the book.
- Nasdaq has filed with the SEC to raise IBIT options position limits tenfold, a formal recognition of the underlying depth.
- The result is a self-reinforcing loop: tighter spreads and greater depth attract more flow, which tightens spreads further.
The scale is concrete. IBIT’s 30-day average options volume runs at 862,462 contracts per day (OptionCharts), and recent single sessions have pushed past a million, with 1,003,861 contracts changing hands on 11 September 2026 (OptiView).
Why the depth matters 862,462 average daily contracts, with single-session peaks above one million. A market this deep is far harder to distort than a thin one.
That depth is the point for you as a reader of the signal. A thin options market can be shoved around by a single large flow, producing implied probabilities that reflect one participant’s hedge rather than any genuine consensus. A market trading hundreds of thousands of contracts a day is much harder to move, so its prices are more likely to reflect an aggregated cross-section of views.
None of this makes IBIT the only surface worth watching. Deribit’s futures and options remain an important reference, and institutional desks cross-check multiple venues rather than treating IBIT as gospel. But when it comes to publicly accessible, spot-backed Bitcoin options depth, IBIT is the deepest pool available.
What large open interest at extreme strikes does and does not tell you
Here is the trap. The instinct is to read 32,529 contracts on the 140-strike as 32,529 votes of confidence that Bitcoin will reach 225,000 USD. The same open interest number, though, can be generated by very different participants holding very different views.
Far-out-of-the-money open interest is a mixture, not a headcount of bulls. There are four broad explanations:
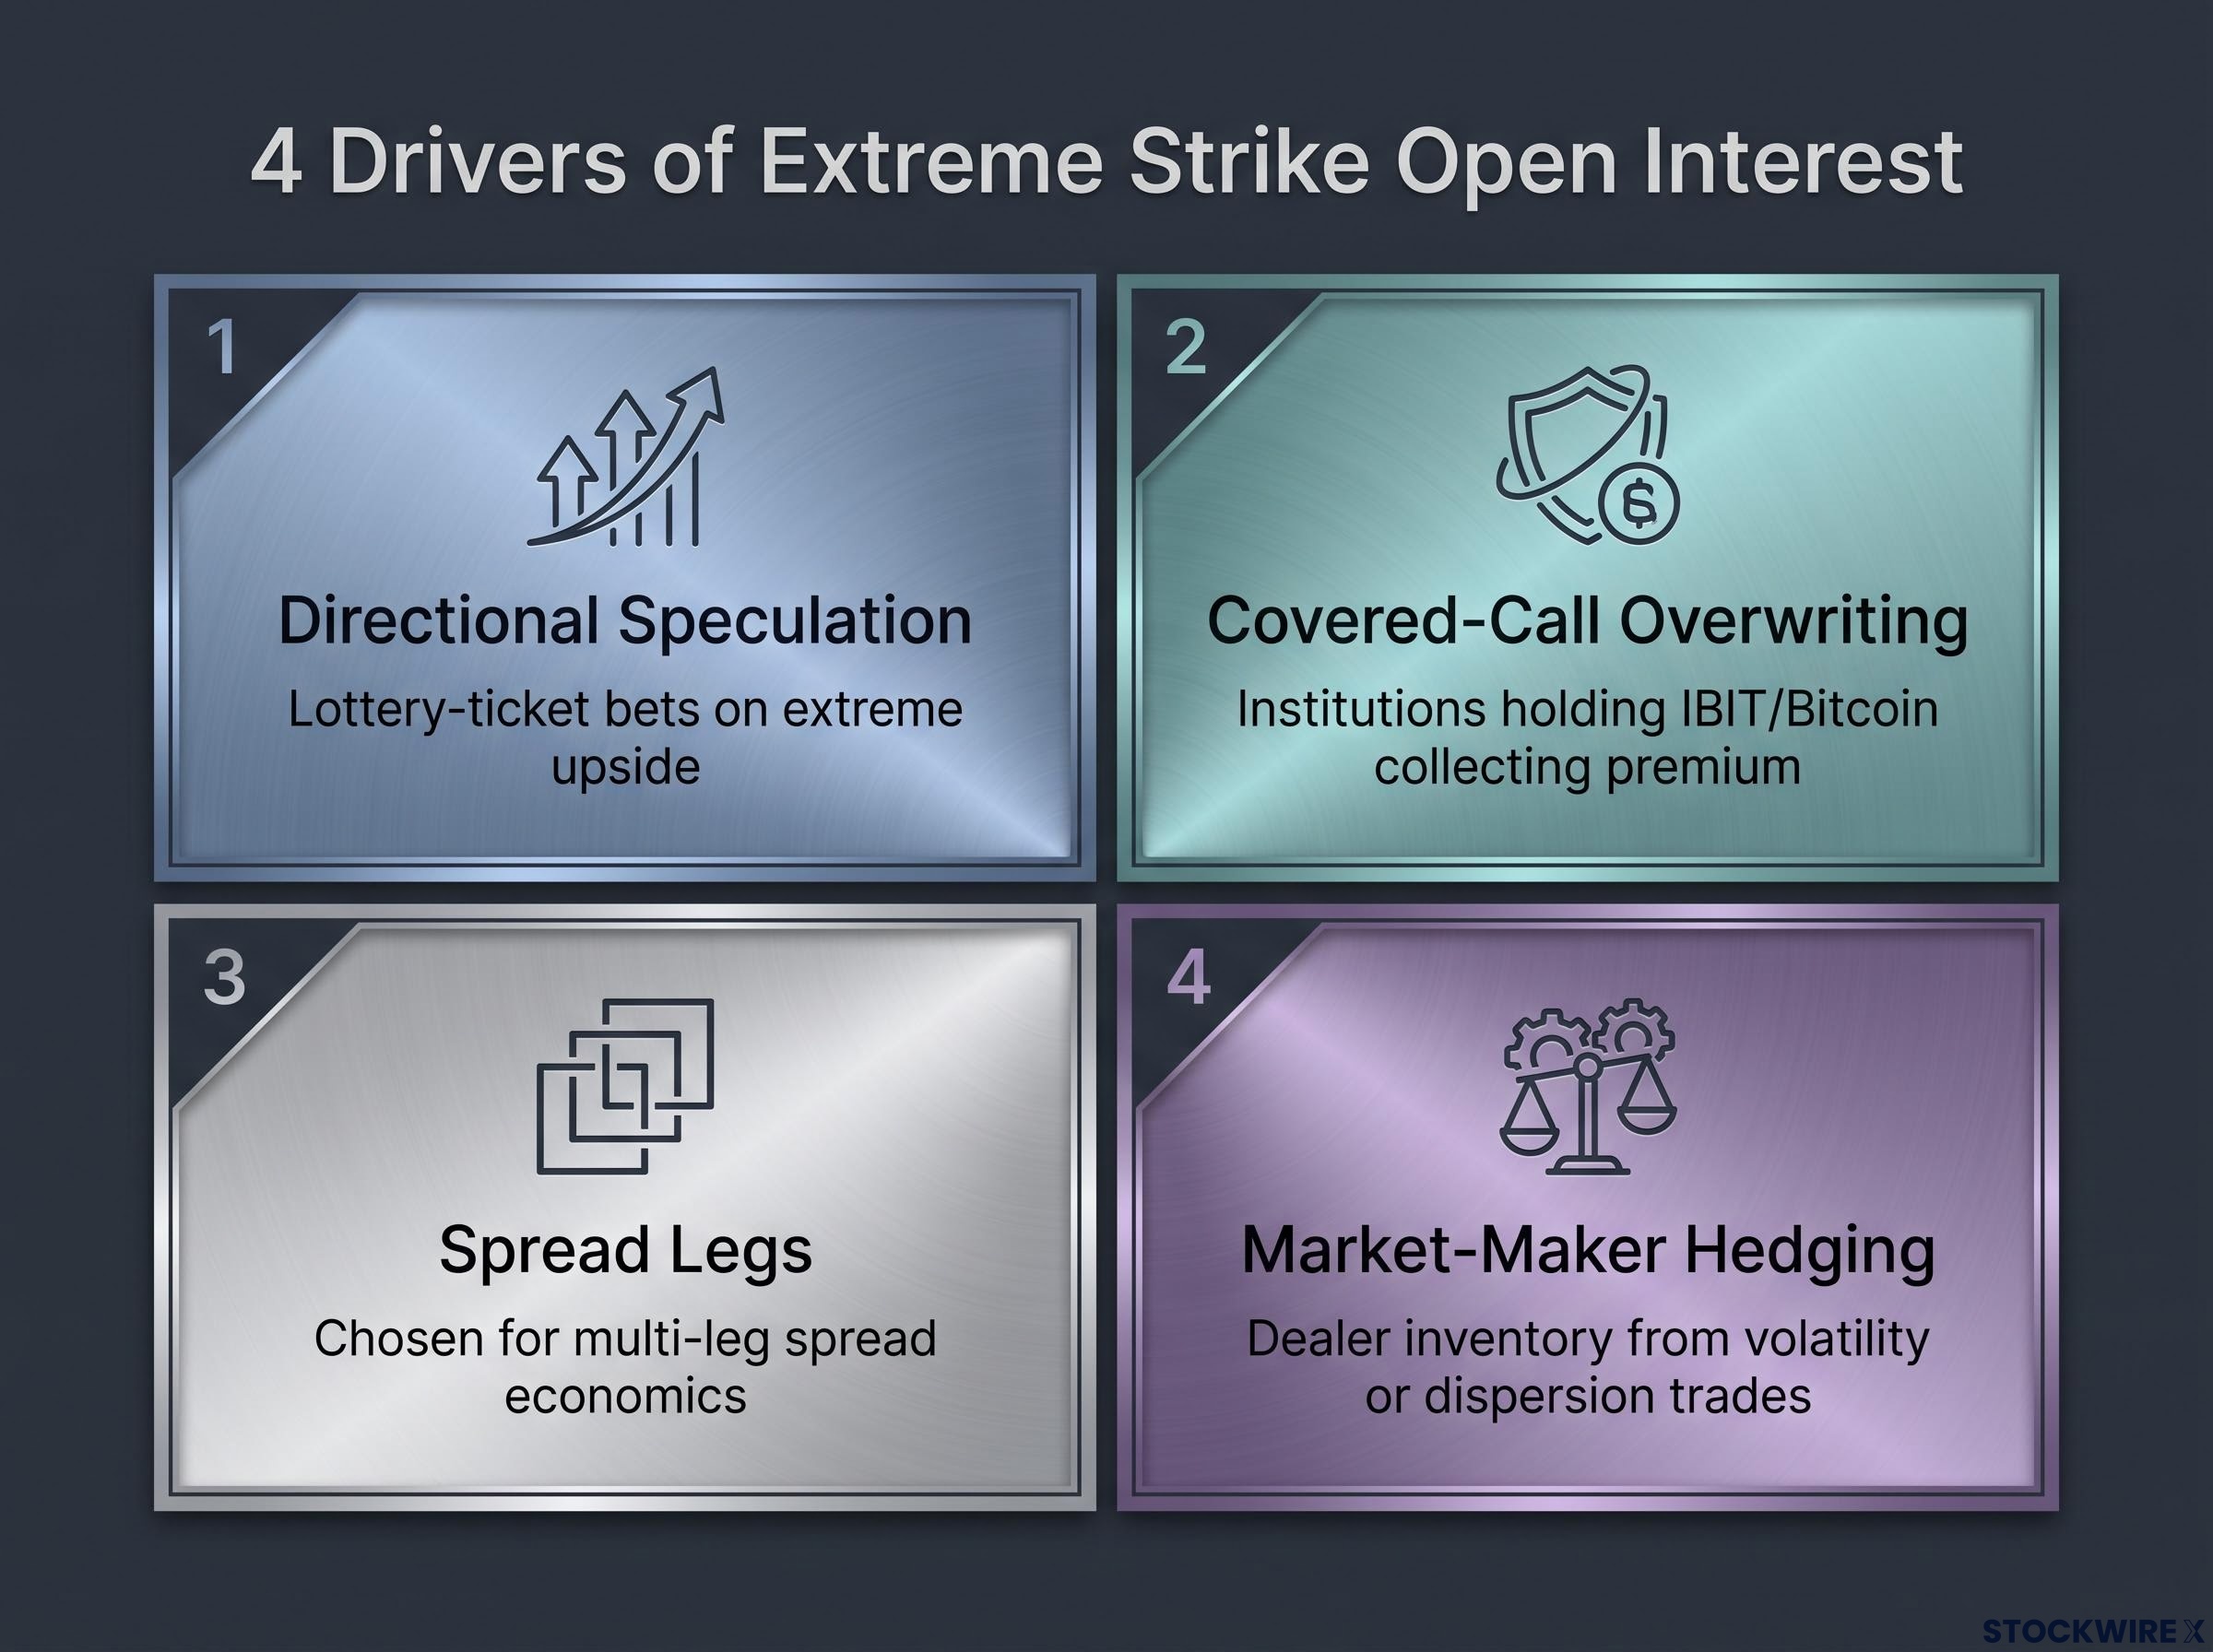
- Directional speculation. Far-OTM calls are cheap per contract, so some of that open interest is lottery-ticket bets on extreme upside via IBIT. This is the interpretation people jump to, and it is only one part of the story.
- Covered-call overwriting. Institutions holding large IBIT or Bitcoin positions may sell far-OTM calls to collect premium. That creates sizable open interest at high strikes without any belief the level will be reached.
- Spread legs. A high-strike call may be one leg in a multi-leg structure, where the strike was chosen for spread economics rather than as a standalone view on 225,000 USD.
- Market-maker hedging. A meaningful share of extreme-strike open interest is dealer inventory from volatility or dispersion trades, where the strike is model-driven rather than opinion-driven.
How to use open interest alongside other signals
The corrective is to look at the rest of the chain. The January 2028 put-call open interest ratio of 0.66 already tempers the bullish read, and stress episodes show how misleading raw open interest can be.
Put-call ratios, skew, and expected-move brackets are the three cross-checks that prevent a single open-interest figure from dominating the read; each one adds a different dimension to what the aggregate book is actually saying about directional sentiment.
In one documented IBIT sell-off, options volume surged to nearly 1.1 million contracts, with roughly 144 million USD of 187 million USD in premium concentrated in puts, and 19 of the 20 most-traded contracts being puts (figures flagged as unverified in the research). That was hedging demand, not a directional stampede, yet it lit up the volume and open-interest data.
Saxo Bank and Bitwise both stress the same discipline: combine open interest with put-call ratios, implied volatility skew, and term structure to separate genuine conviction from risk management. For you, the takeaway is simple. Open interest at any single extreme strike is one data point within the full chain, not a tally of believers.
Reading IBIT options as a sentiment tool, not a crystal ball
Pull the threads together and a calibrated posture emerges. IBIT options data is neither noise to dismiss nor a forecast to trust blindly. It is a rich signal that answers some questions well and others not at all.
The limitations stack up across everything covered here. Black-Scholes log-normal assumptions understate Bitcoin’s heavy tails. Risk-neutral pricing is not real-world probability. Volatility compression can artificially depress the implied odds of large moves, and Bitwise has documented periods where IBIT implied volatility sat in the 1st-2nd percentile of historical levels across multiple tenors. And far-OTM open interest is ambiguous by nature.
Here is a practical three-part framework for using the chain without over-reading it:
- Treat the implied probability as a floor, not a forecast. The ~2% in-the-money and ~5% touch probabilities on the 140-strike tell you how the risk-neutral market prices an extreme outcome under a model, against 47.03% implied volatility. Real-world odds may sit higher.
- Cross-reference the aggregate positioning. Check the put-call ratio and skew to judge whether the book is defensive or speculative. The 0.66 ratio reads as cautious but not bearish, which colours how you weigh the call-side interest.
- Read strike-level open interest as a clustering map. The 32,529 contracts and ~0.78 USD premium on the 140-strike show where speculative and hedging interest concentrates. Treat it as a map of where money sits, not a consensus price target.
Used this way, IBIT’s options chain is more informationally dense than almost any other publicly accessible Bitcoin-linked instrument. It will not tell you where Bitcoin is going. It will tell you, with useful precision, how a deep pool of institutional capital is currently pricing long-horizon Bitcoin scenarios, and that is a signal worth reading.
For readers wanting to model how the 140-strike call’s sensitivity to IBIT price moves will shift as the January 2028 expiration approaches, our dedicated guide to delta in options explains how moneyness and time together polarise directional exposure in the final weeks of a contract.
This article is for informational purposes only and should not be considered financial advice. Investors should conduct their own research and consult with financial professionals before making investment decisions. Past performance does not guarantee future results. Financial projections are subject to market conditions and various risk factors, and probability estimates discussed here are speculative and subject to change based on market developments.