The US stock market is now worth nearly three times the entire US economy. As of 30 September 2026, the Buffett indicator, which divides the total value of US stocks by GDP, sits at roughly 297%. That is the highest reading in the measure’s recorded history, higher even than the dot-com peak and the 2021 high.
A number that extreme is not an invitation to admire how far the market has run. It is a question about where your next dollar should go. If US equities are priced for near perfection, the sensible move is to ask where else a rational investor can put capital to work.
This is not a prediction that American stocks are about to collapse. It is a valuation-gap story, and the gap is wide. US stocks trade at 23.4× forward earnings while international developed markets sit around 15-17× and emerging markets near 12×, one of the widest spreads in decades.
What follows here is a practical map. You will understand why the valuation gap exists, which international regions and market segments are pricing in the most opportunity, and which specific global value ETFs give you access to each slice.
How overvalued is the US market, and why does the starting price matter?
Start with the single figure that frames everything else.
Buffett indicator: approximately 297% (30 September 2026) Total US stock market value divided by US GDP, measured using the Wilshire 5000 and FRED nominal GDP data. This classification is “Strongly Overvalued” and marks the highest level in the indicator’s history.
That one metric is useful, but it tells you the market is expensive without telling you much about structure. The fuller picture comes from forward price-to-earnings multiples, which measure how much investors are paying today for each dollar of expected future earnings.
Here is where the US sits across three readings:
The US market valuation signals now converging, including the Buffett Indicator at roughly 2.4 standard deviations above its long-run trend, an unfavourable equity earnings yield versus Treasury yield spread, and Berkshire Hathaway’s $373 billion cash reserve, point in the same direction and reinforce why starting price matters so much to long-run return expectations.
- Buffett indicator: approximately 297%, the highest ever recorded
- MSCI USA forward P/E: 23.4× as of 31 December 2025, roughly 16% above its 10-year average
- MSCI US Growth forward P/E: approximately 26×, the most expensive layer of the market
For context, the 26-year median forward P/E for US stocks is around 17×. The market is not a little above its own history. It is sitting near the 99.7th percentile, meaning almost every historical starting point was cheaper than today.
Why does a starting price matter so much? Because over long horizons, starting valuation is one of the most reliable predictors of future returns. Pay a high price, and you statistically lock in lower long-run returns, regardless of how good the underlying companies are.
The forecasts reflect this. Seven-year asset class projections suggest US large and small-cap equities may deliver negative returns in both normal and low-interest-rate scenarios, with US deep value stocks expected to return roughly zero.
A 99.7th-percentile reading tells you that nearly every comparable starting point in history produced below-average long-run returns. That is precisely why institutional allocation models are routing capital away from US large-cap right now.
This reframes your central question. The useful thing to ask is not whether the US market is going to crash. It is what your expected return looks like from a price this high, and whether cheaper markets offer you a better starting point.
When big ASX news breaks, our subscribers know first
Where the valuation gap is widest across international markets
The best way to see the opportunity is to look at the full valuation map and let the spread speak for itself.
| Market / Index | Forward P/E | Historical Percentile | Spread vs US |
|---|---|---|---|
| US (MSCI USA) | 23.4× | 99.7th | Baseline |
| US Growth (MSCI US Growth) | ~26× | Elevated | More expensive |
| Europe (MSCI Europe) | ~15× | 74th-81st | ~8 points cheaper |
| European Value | ~12× | Below broad index | ~11 points cheaper |
| Emerging Markets (MSCI EM) | ~12.25× | Below developed | ~11 points cheaper |
| Non-US Developed Small-Cap | ~14× | Below US | ~9 points cheaper |
| Japan Small-Cap Value | ~14× | Below US | ~9 points cheaper |
Scan that table and the pattern is hard to miss. The broad MSCI Europe index trades around 15×, roughly 6% above its own 10-year average, while emerging markets sit near 12.25×.
Non-US developed markets are not cheap in absolute terms. They currently trade between the 74th and 81st historical percentiles, a real premium to their own history. But that is a long way below the US reading at the 99.7th percentile.
The gap between 23.4× in the US and 12× in European value or emerging markets is not a minor style preference. It reflects how much future growth each market is pricing in, and staying US-only means paying a steep implicit premium on the assumption that American exceptionalism continues indefinitely.
Why European and emerging market value stocks trade at a deeper discount than their broad indexes
The headline index number actually understates the discount available to you. Broad international indexes include large-cap growth and quality companies that trade at a premium within their own regions, which pulls the average multiple up.
Strip those out and the cheapest layer is cheaper still. European value stocks specifically trade around 12× forward earnings, well below the broad 15× MSCI Europe reading.
That cheapness is concentrated in specific sectors. European value clusters in financials, energy, and industrials, areas where earnings are either recovering or actively being restructured, which is what drives that 12× multiple.
The structural reform thesis behind Japan’s value opportunity
Cheap stocks are only an opportunity if something is pushing them toward fair value. In Japan, that something is unusually concrete.
Japanese small-cap value trades at roughly 14× forward earnings. On its own, that figure could describe a value trap, a market that is cheap because it deserves to be. What separates Japan is a deliberate campaign of institutional pressure reshaping how companies treat shareholders.
The Tokyo Stock Exchange has driven a corporate governance reform push with three distinct mechanisms:
- Companies trading below book value are required to submit formal capital improvement plans explaining how they will lift their valuations
- Share buybacks are actively encouraged, returning cash to shareholders rather than letting it sit idle on balance sheets
- Cross-shareholdings, the old practice of companies holding each other’s shares to cement relationships, are being unwound to free up capital
Each of these pushes capital back toward investors. That is the mechanism a value investor wants to see, because it gives the cheap multiple a reason to re-rate.
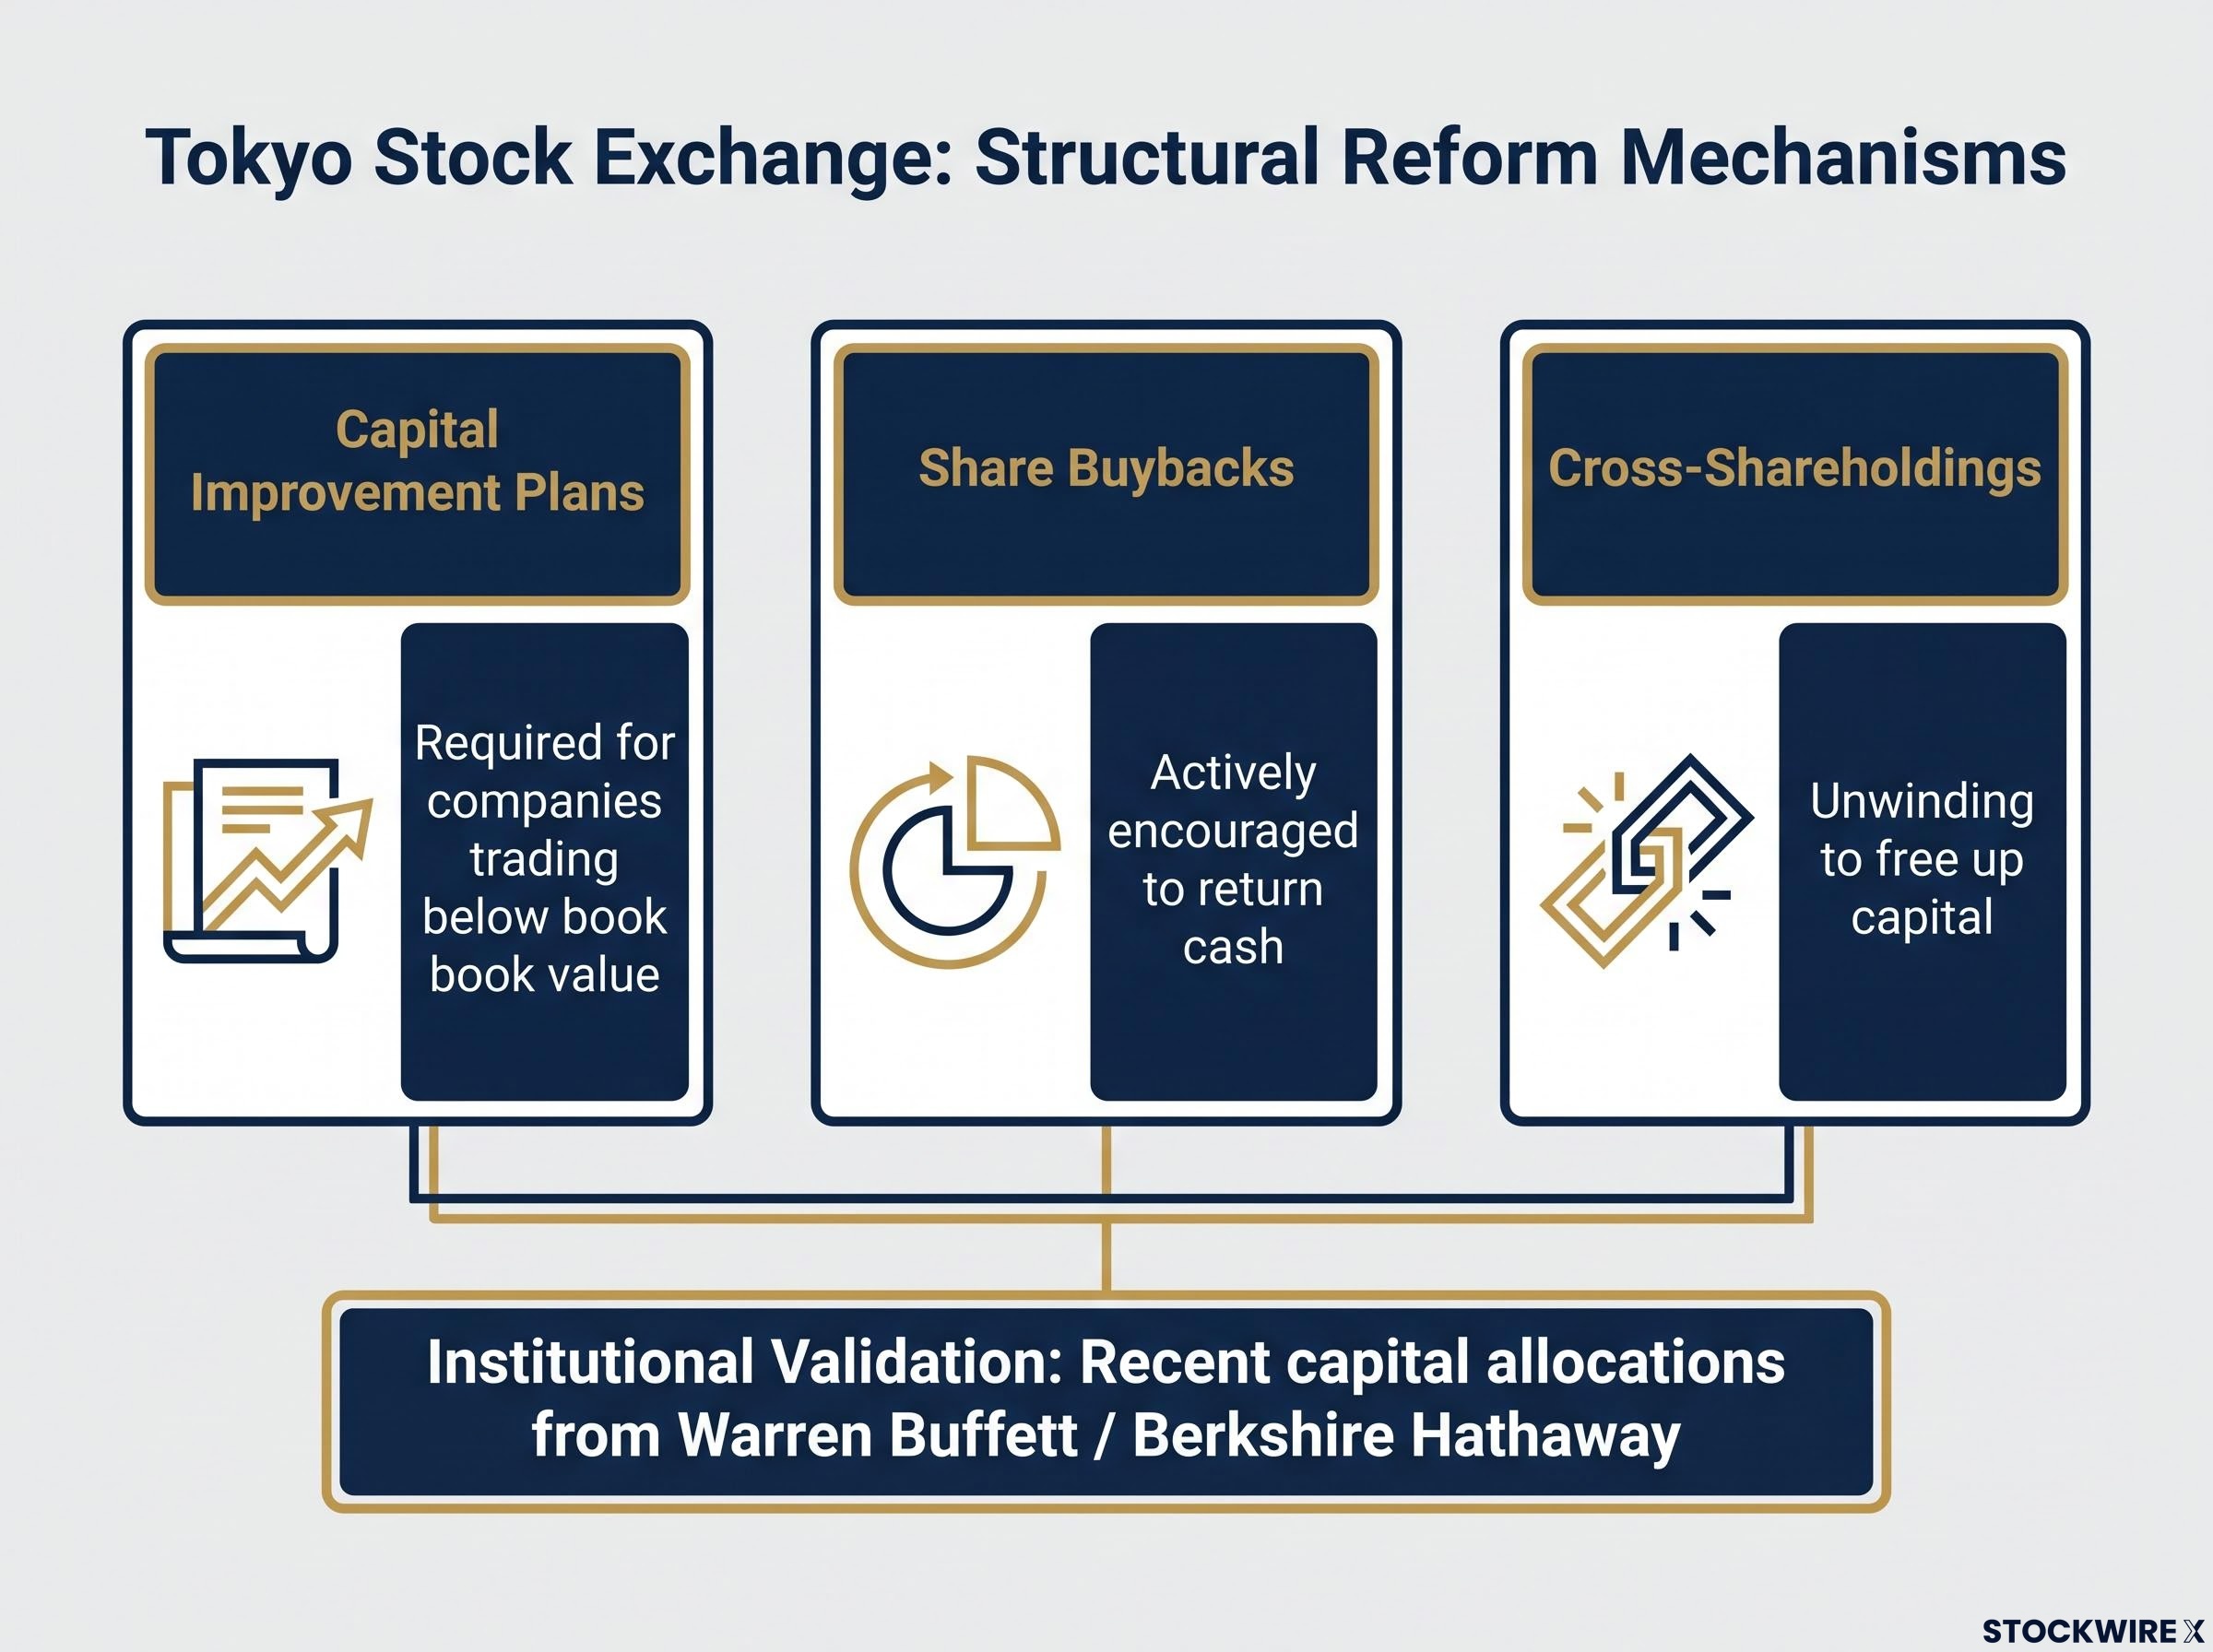
Institutional validation from Berkshire Hathaway Warren Buffett and Berkshire Hathaway have made recent capital allocations into Japanese equities, framed as part of the group’s leadership transition strategy. When one of the world’s most patient value investors builds a position during a succession handover, it signals a long-term conviction rather than a short-term trade.
Japan’s structural re-rating has already produced measurable results beyond the theoretical reform case: TOPIX average price-to-book has risen from 1.1x to 1.5x since 2023, average return on equity has climbed from 8.4% to approximately 9-10%, and Berkshire Hathaway’s stakes in Japan’s five major trading houses now exceed 10% each with a total portfolio value above $30 billion.
There is also a margin story underneath the valuation. US profit margins are historically elevated, largely because of technology dominance, and global competition is expected to push them back toward historical norms over time.
Japanese and European margins sit on the other side of that equation. They have structural room to improve through restructuring and better capital discipline, which supports stronger relative earnings growth.
The reform programme is the hinge of the entire Japan case. It is the difference between Japan being cheap for permanent structural reasons and Japan being cheap with an identifiable force pushing companies to return capital. That distinction is what tells you the opportunity may have staying power beyond a one-off re-rating.
Three ETFs that give US investors access to global value today
Knowing where the discounts sit is only useful if you can act on it. Three liquid ETFs cover the main slices of the global value opportunity, and each one does a different job.
| Ticker | Focus | Expense Ratio | Key Holdings | Notable Metric |
|---|---|---|---|---|
| EFV | Broad developed-market value ex-US | 0.31% | Nestle, Mitsubishi, Shell | ~$30.77B net assets; 1-yr return 26.64% |
| EWJV | Japan value, single country | 0.15% | Toyota, SoftBank, Mizuho | Direct TSE reform exposure |
| AVDV | International small-cap value, active | Marginally above 0.15% | Perseus Mining, Seal Insurance | Profitability screen on value selection |
The iShares MSCI EAFE Value ETF (EFV) is the natural starting point. It gives you broad, liquid exposure to large and mid-cap developed-market value companies outside the US, with an expense ratio of 0.31% and roughly $30.77 billion in net assets as of April 2026.
Its recent record has been strong. EFV posted a 1-year total return of 26.64%, a 3-year of 21.40%, a 5-year of 13.19%, and a 10-year of 10.39% through 31 August 2026, with a year-to-date return of +17.6%. Holdings like Nestle, Shell, and HSBC give you diversified exposure across the developed world.
The iShares MSCI Japan Value ETF (EWJV) is the concentrated tool. If you specifically want to express the Japan reform thesis, this single-country vehicle does it at just 0.15%, holding names like Toyota, Panasonic, SoftBank, and Mizuho.
The Avantis International Small Cap Value ETF (AVDV) is the active option. It targets small-cap non-US companies trading at low valuations but screens for healthy profitability on top, so cheapness alone does not earn a position. Its expense ratio sits marginally above EWJV’s 0.15%, and holdings include Perseus Mining and Seal Insurance.
The choice between them is not about which is best. It is about which slice you want: broad developed value with EFV, Japan reform with EWJV, or a small-cap factor tilt with AVDV. The right pick depends on the gaps in your existing portfolio.
For investors who want to pressure-test EFV, EWJV, or AVDV against a structured framework before committing capital, our comprehensive walkthrough of ETF due diligence covers the seven-step evaluation process across mandate, holdings, costs, distributions, liquidity, and provider quality, including how tracking difference and bid-ask spread affect real-world returns beyond the headline expense ratio.
A note on currency exposure across all three funds
One detail applies to all three. EFV, EWJV, and AVDV are unhedged, meaning your return combines the local equity return with the change in the foreign currency against the US dollar.
That cuts both ways. If the dollar weakens from its historically elevated levels, you pick up a currency tailwind on top of the equity gain. But currency moves also add volatility, so you need to account for that swing when sizing the position in your portfolio.
What the risks look like before you rotate
The valuation case is compelling, but a complete picture means understanding what could go wrong. Each of these risks is manageable once you can see it clearly.
- US exceptionalism: The US retains genuine structural advantages, including world-leading technology ecosystems, deep capital markets, flexible regulation, and historically higher and more stable return on equity. These may justify a persistent valuation premium, so the gap may never fully close.
- Value traps: Cheap foreign indexes are often weighted toward secularly challenged sectors such as legacy financials, traditional energy, and state-influenced utilities. A low multiple can reflect permanently impaired earnings rather than mispricing.
- Currency drawdown: Because these funds are unhedged, a sustained period of US dollar strength can produce severe drawdowns that erase the valuation advantage entirely.
- Tax friction: International value funds hold higher-dividend, mature companies, which triggers foreign withholding taxes on those dividends. US taxable investors can only partially reclaim them, and IRAs generally cannot reclaim them at all.
- Timing and behavioural risk: Value and international rotations are frequently early by years. US growth could keep outperforming on the back of AI and technology shifts, testing your discipline while you wait.
The tax point deserves specific attention if you hold in a taxable account. Foreign withholding tax on international value dividends is a real drag that reduces your net yield advantage, so you should calculate your after-tax expected return, not just the headline P/E discount, before allocating.
The combination risk is also worth watching. Stacking EFV, AVDV, and EWJV together can quietly over-concentrate you in Japan, financials, and industrials all at once, and active funds like AVDV carry higher tracking error relative to a simple value benchmark.
The behavioural risk is the one that catches most investors International value rotations are frequently early by years, and the most common reason people fail to capture the valuation-gap return, even when the thesis eventually proves correct, is that they sell during the extended interim underperformance before mean reversion arrives. Discipline, not analysis, is usually the binding constraint.
Understanding these risks does not weaken the case. It equips you to size an allocation that fits your tax situation, your existing concentration, and your tolerance for sitting through a long stretch of underperformance.
Where the opportunity sits today and how to size it
Pull the data together and the picture is straightforward. The spread between US and international value forward P/E multiples is at or near multi-decade extremes, and history suggests some compression is likely over a seven-to-ten-year horizon, even though the exact timing is impossible to call.
The supporting forces are real. Seven-year institutional forecasts project substantially higher returns for international value, emerging markets, and Japanese equities than for US large-cap. The Tokyo Stock Exchange reform push is an ongoing mechanism rather than a single event, and a dollar that mean-reverts from elevated levels would add a currency tailwind on top.
Here is a practical way to approach the decision:
- Assess your current US equity concentration against your stated target allocation. Most American investors are heavily US-weighted through home country bias.
- Identify which slice fits your gap: broad developed value through EFV, Japan reform through EWJV, or a small-cap factor tilt through AVDV.
- Establish a phased entry schedule, spreading purchases across two to four quarters to manage both timing risk and your own discipline.
For an investor who is already US-heavy, which describes most Americans, adding an international value allocation is less a speculative bet and more a diversification act. It reduces single-country and single-sector concentration while capturing a historically documented discount.
For readers wanting to understand how industrial policy divergence and regional bloc formation compound the valuation-gap case for diversification, our full explainer on geopolitical fragmentation risk examines how revenue geography, supply-chain affiliations, and jurisdictional exposure interact with the country and sector labels that standard portfolio analysis relies on.
This article is for informational purposes only and should not be considered financial advice. Investors should conduct their own research and consult with financial professionals before making investment decisions.
Past performance does not guarantee future results. Financial projections are subject to market conditions and various risk factors, and the forward-looking scenarios described here are speculative and subject to change based on market developments.