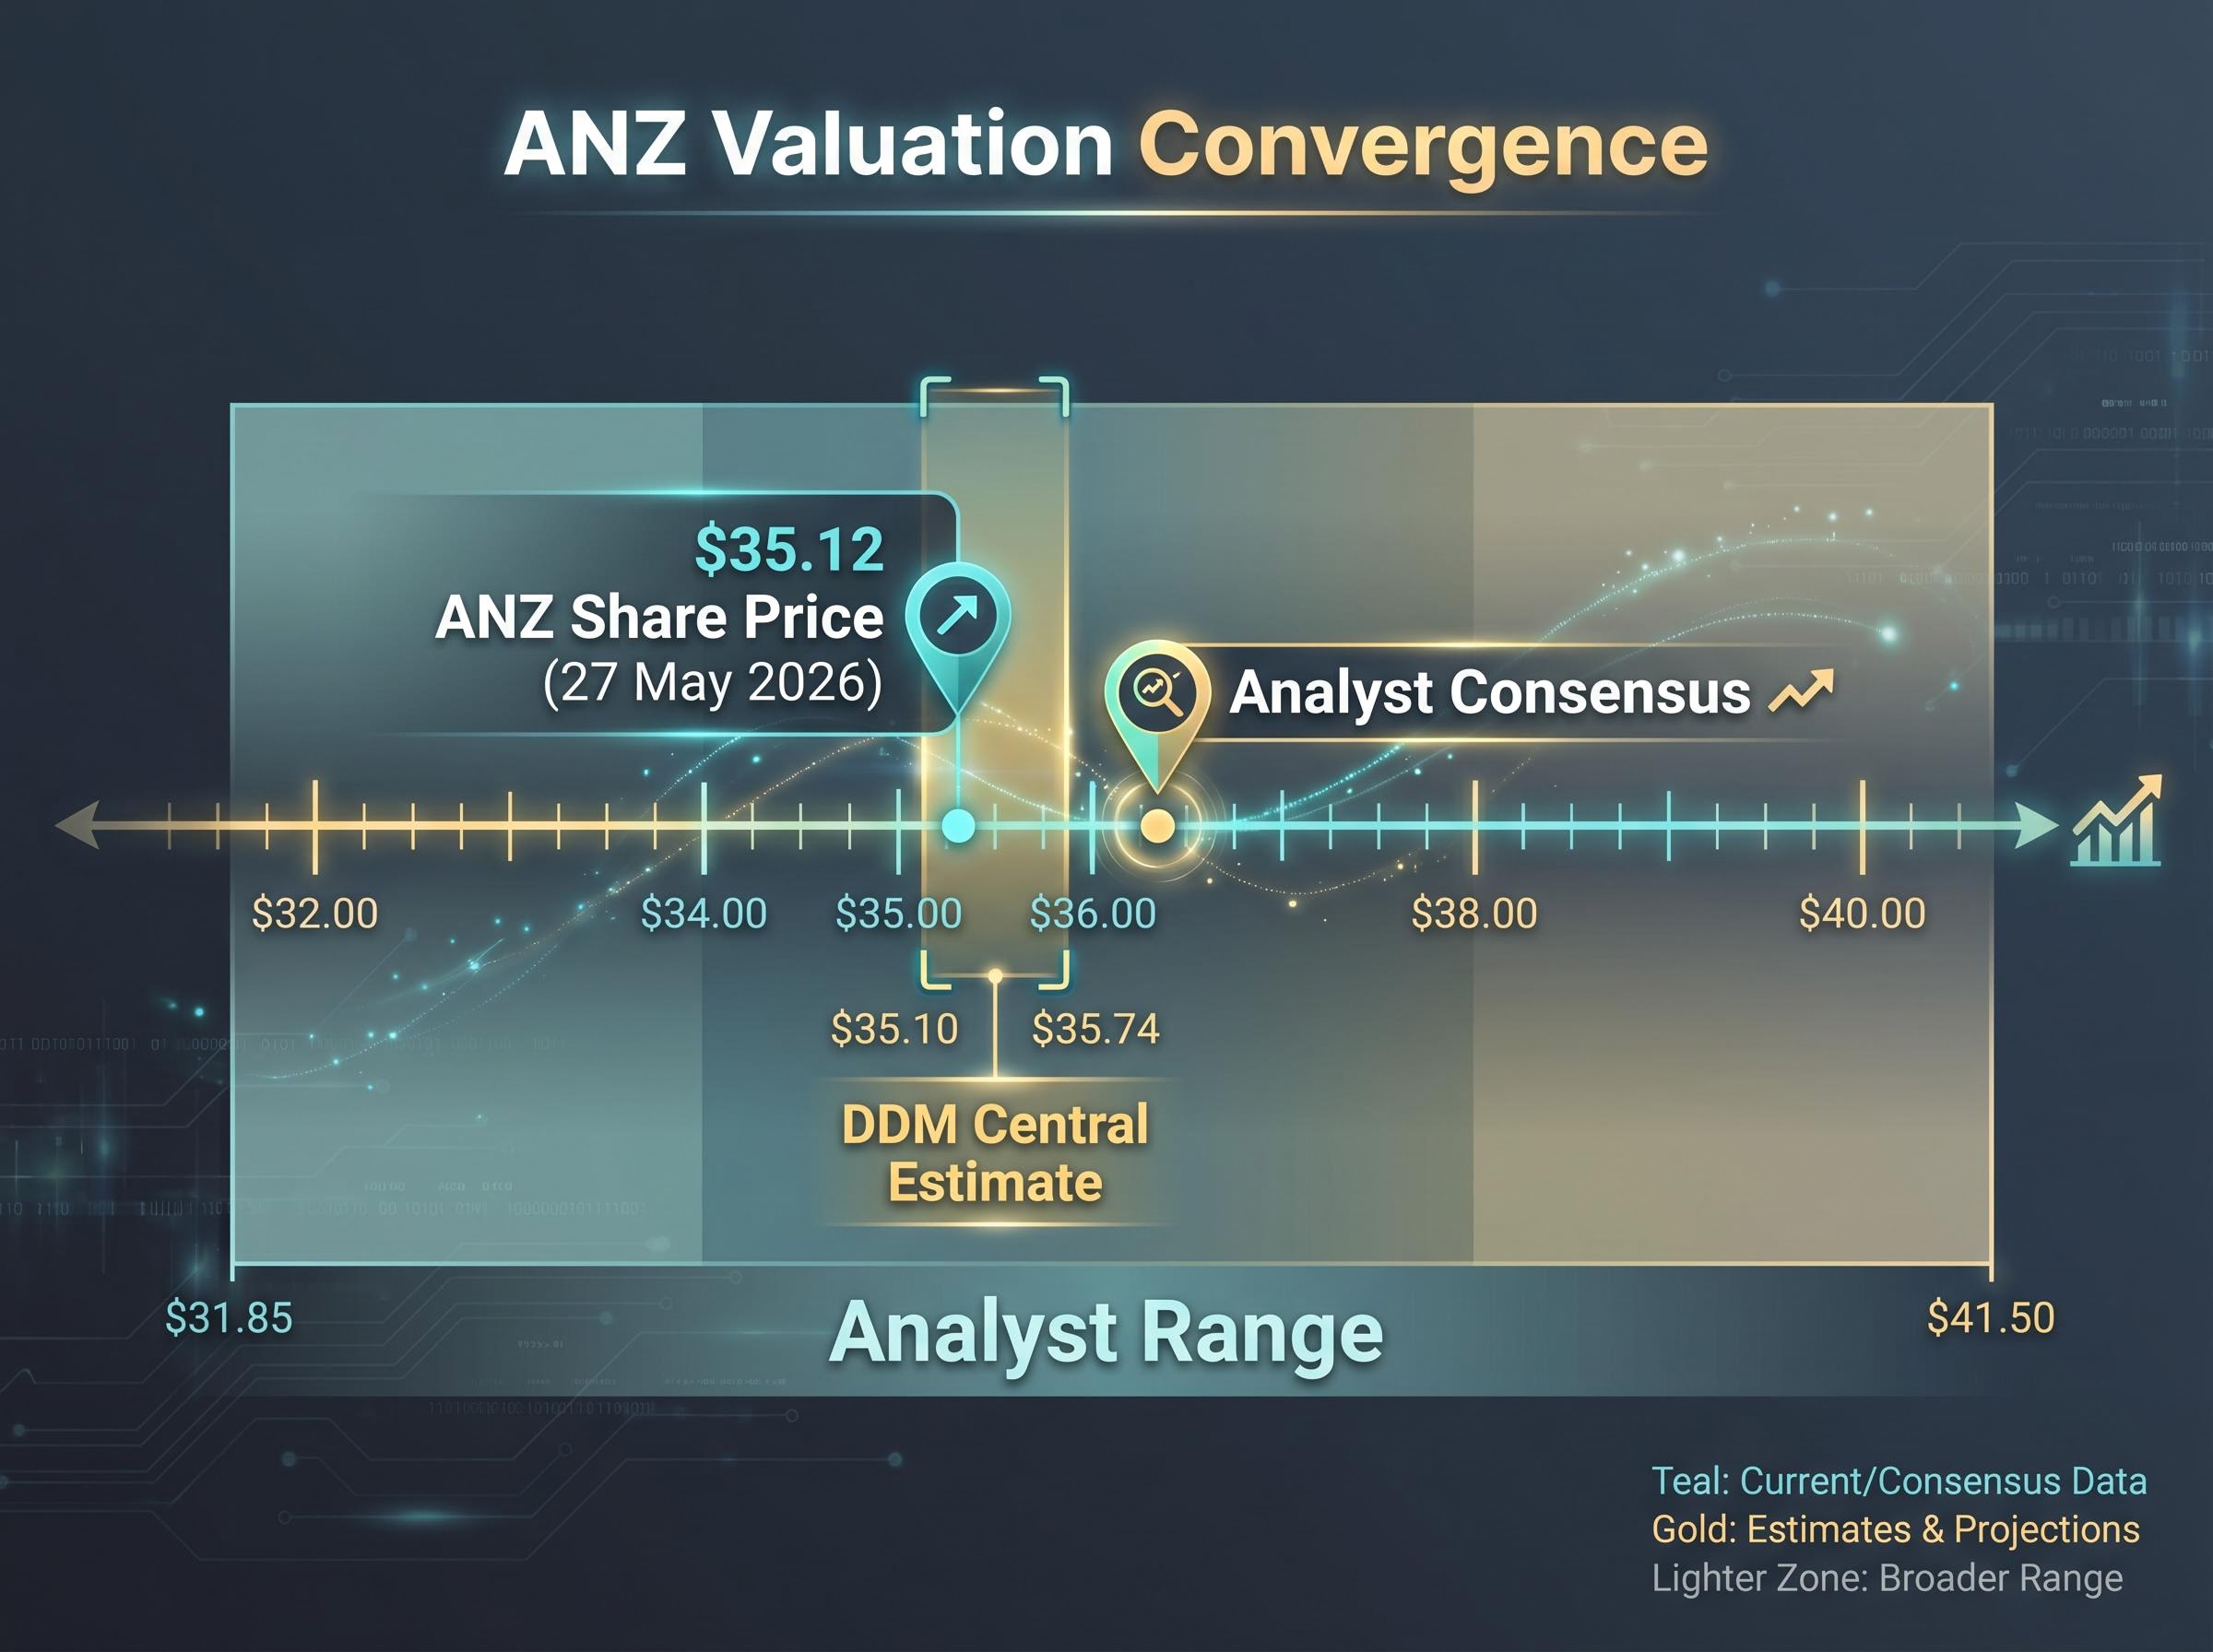
ANZ shares closed at $35.12 on 27 May 2026. A dividend discount model built from the bank’s most recently reported financials, using publicly available data and a range of growth and discount rate assumptions, produced a central valuation estimate of approximately $35.10 to $35.74. The near-exact convergence between model output and market price raises a pointed question: is the stock precisely where it should be, or is the model simply reflecting the assumptions already baked into the price?
This guide walks through the dividend discount model as applied to ASX bank stocks, step by step, using ANZ as a live case study. By the end, readers will understand how to apply the Gordon Growth Model to any ASX dividend-paying bank, which inputs carry the most weight, how to stress-test assumptions through a scenario matrix, and where the model’s limits demand supplementary methods.
Why bank stocks are unusually well-suited to dividend-based valuation
Banks are mature, heavily regulated businesses whose earnings translate directly into dividends. Unlike growth companies that reinvest most of their profits, the Big Four Australian banks distribute a substantial share of cash earnings to shareholders each year. For ANZ specifically, lending income accounted for approximately 78% of total income in its most recently reported full year, according to calculations by the Rask Invest Research Team. That concentration ties dividend-paying capacity to a single, relatively forecastable revenue stream.
The structural features of Australia’s banking oligopoly reinforce this. Four institutions dominate lending, deposits, and wealth management, operating under APRA (the Australian Prudential Regulation Authority) supervision that enforces capital adequacy and constrains risk-taking. The result, historically, has been dividend continuity, though not a guarantee of it.
Characteristics that make banks DDM-friendly:
- Stable, recurring earnings dominated by net interest income
- Regulatory frameworks that enforce capital discipline
- High payout ratios relative to most ASX sectors
- Long operating histories with observable dividend patterns
Characteristics that create DDM risk:
- APRA capital requirements can constrain payouts independently of earnings
- Credit cycles cause earnings volatility that disrupts dividend growth assumptions
- Major capital events (such as acquisitions) absorb funds that might otherwise flow to shareholders
- NIM compression from competitive pressure can erode the earnings base beneath stable dividends
The pairing of banks and DDM is logical. It is not, however, frictionless.
When big ASX news breaks, our subscribers know first
The dividend discount model explained: mechanics every investor needs to understand
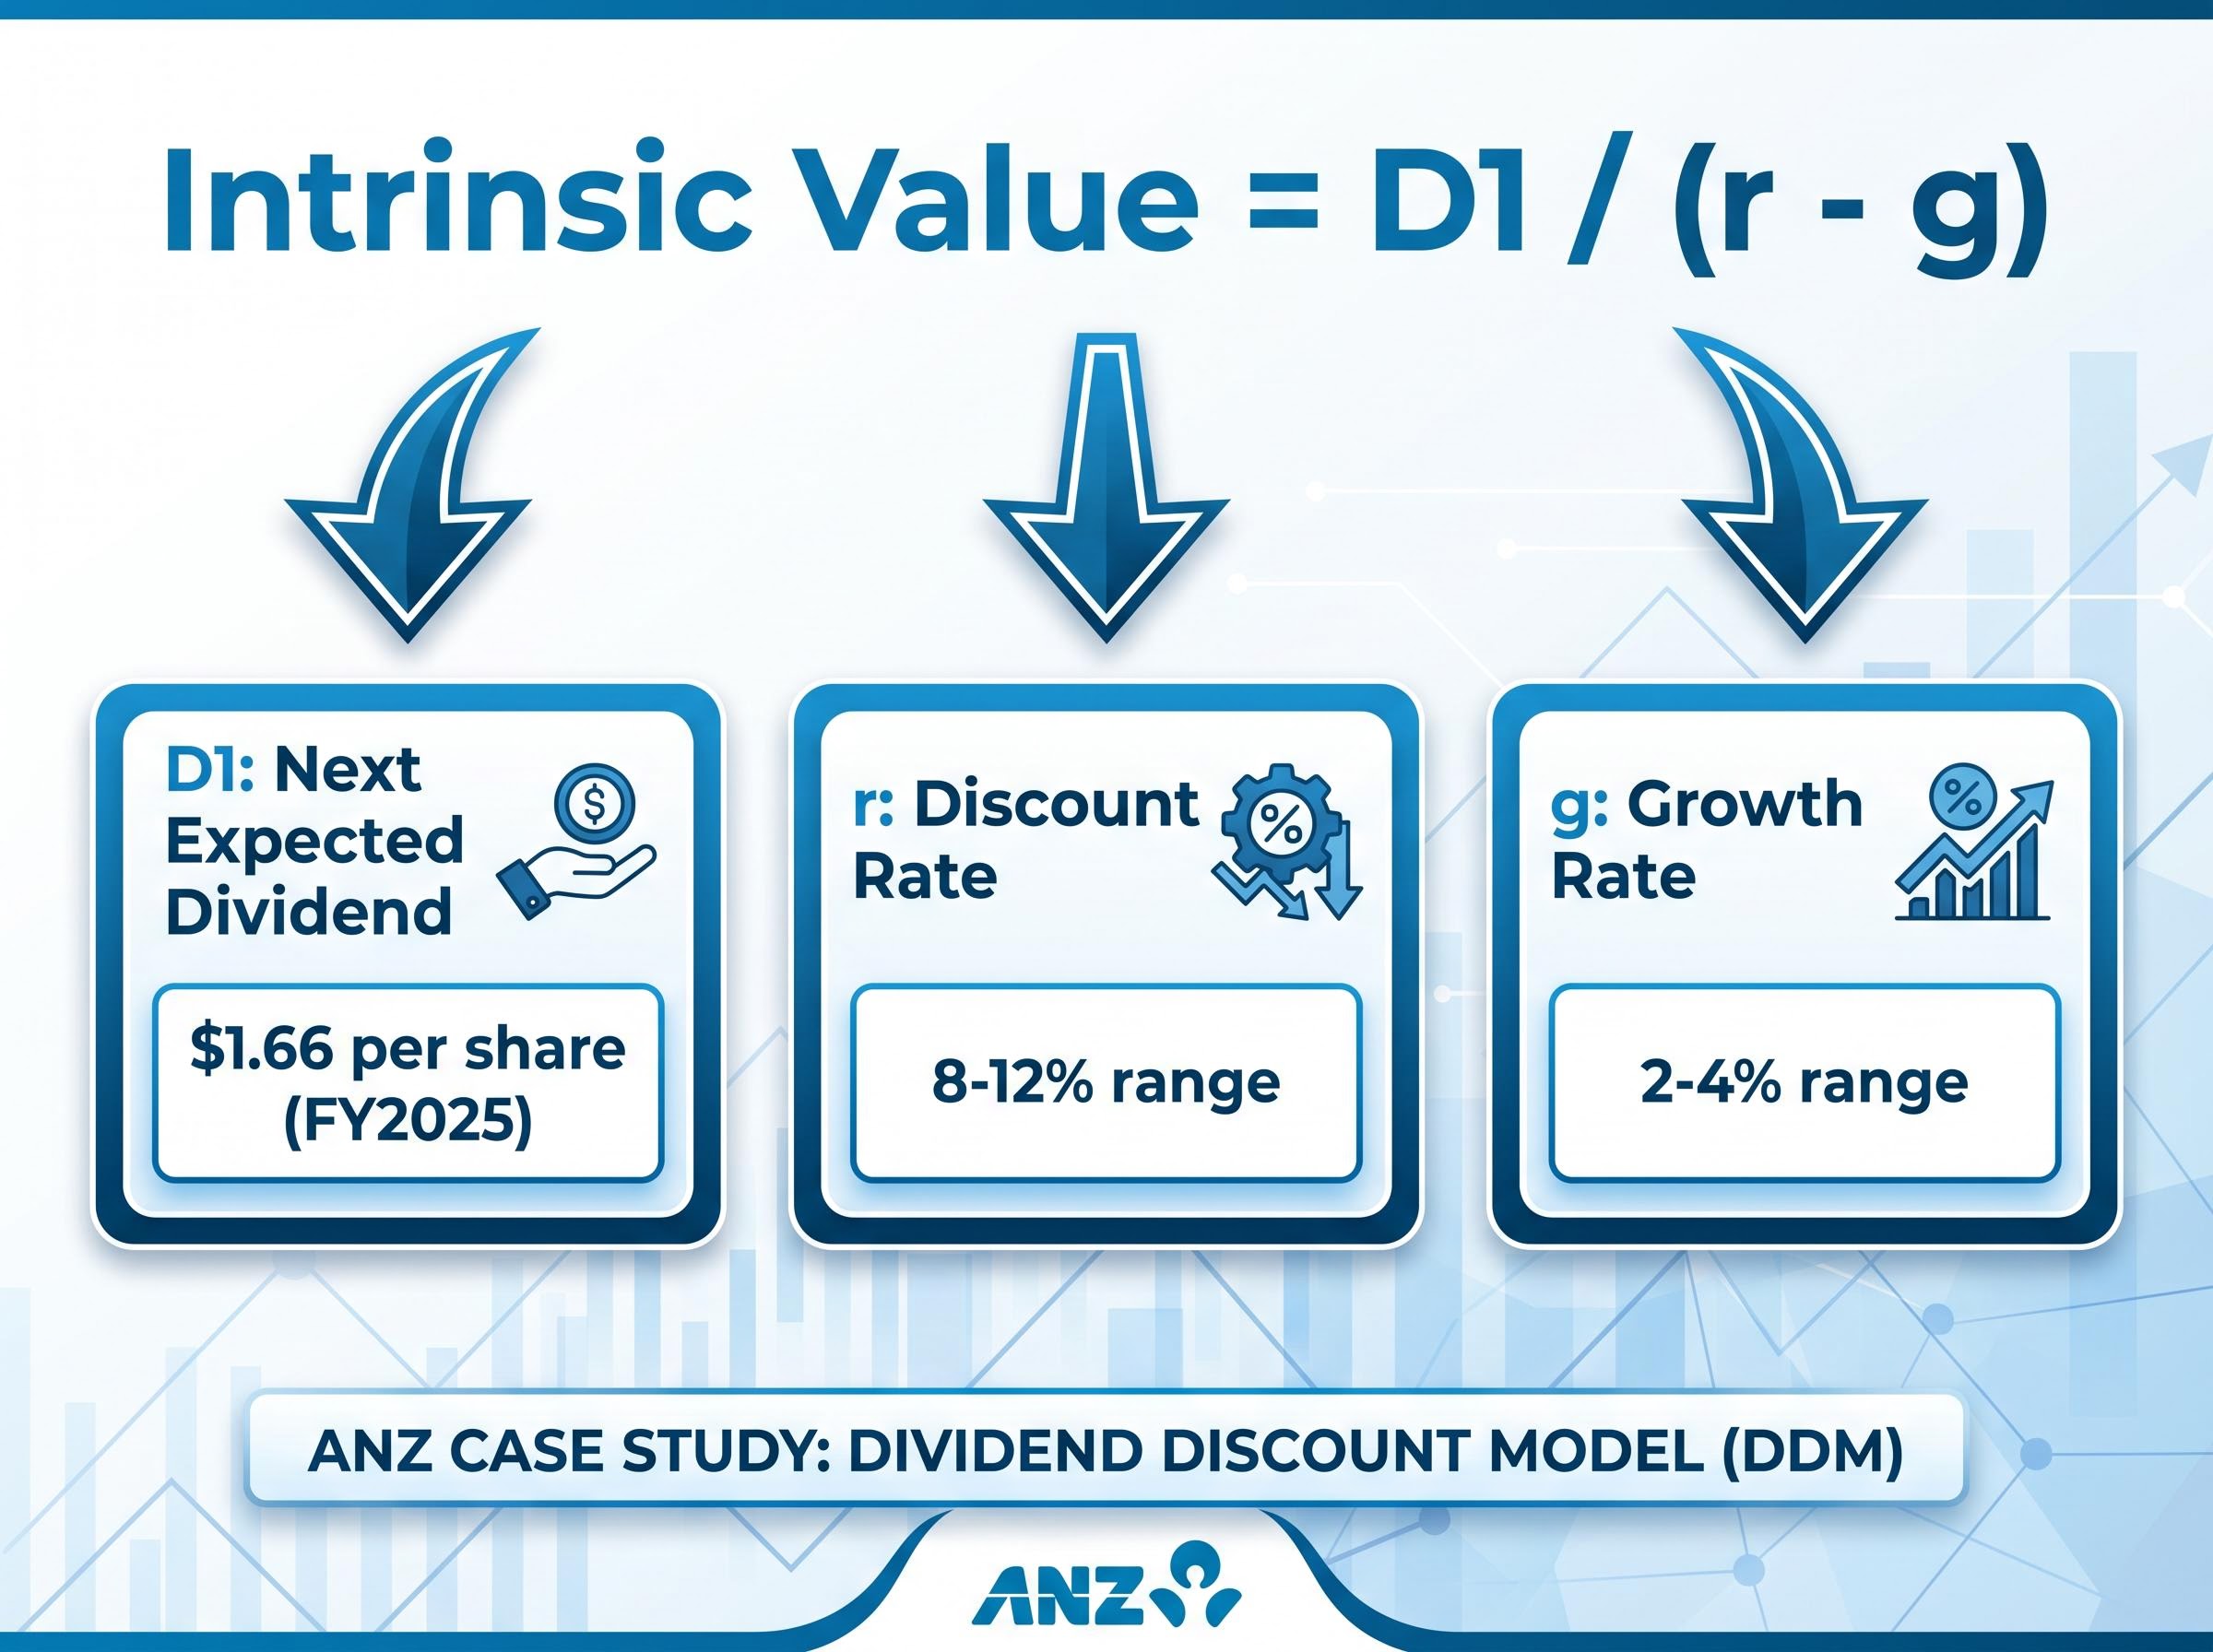
The Gordon Growth Model rests on a simple premise: if a company pays dividends that grow at a steady rate indefinitely, the present value of all those future dividends can be compressed into a single formula. The intrinsic value equals next year’s expected dividend, divided by the gap between the investor’s required rate of return and the assumed long-run dividend growth rate.
Intrinsic Value = D1 / (r – g)
Where D1 is the next expected annual dividend, r is the required rate of return, and g is the long-run dividend growth rate.
The formula looks straightforward. The sensitivity hidden in the denominator is not. Because the output depends on the difference between r and g, small changes to either input produce disproportionately large swings in the result. Shift r down by one percentage point and the valuation jumps materially. Nudge g up by half a point and the effect compounds. This is why a single-point DDM estimate is almost meaningless in isolation; scenario analysis across a range of r and g values is where the model earns its value.
The Gordon Growth Model formula traces its origins to John Burr Williams, who formalised the income-based approach to equity valuation in 1938 as a direct response to the speculative excesses that preceded the 1929 crash; the discipline of anchoring value to future income rather than anticipated price appreciation remains the model’s most enduring contribution.
Building a DDM input set follows three steps:
- Establish D1: Identify the most recent full-year dividend per share and, if appropriate, adjust for any known changes to the next expected payment.
- Estimate g: Infer the long-run dividend growth rate from earnings trajectory, payout ratio trends, return on equity, and management commentary on capital allocation.
- Set r: Construct a required rate of return from the risk-free rate (typically anchored to long-dated Australian government bond yields) plus an equity risk premium, generally 4-6% for large ASX equities, producing a plausible r range of 8-12%.
A note on franking credits for Australian investors
For investors who can fully utilise imputation credits, particularly individuals in the 0-32.5% tax bracket, the effective yield on a 70-75% franked dividend is meaningfully higher than the stated cash yield. ANZ’s FY2025 dividends were 70% franked, with the 2026 interim dividend rising to 75% franking.
Some retail investors informally lower their required return (r) slightly to reflect this franking benefit. This guide uses the cash dividend as the baseline input for transparency, but readers whose tax position allows full franking credit utilisation may reasonably adjust their personal r downward.
Building the ANZ inputs: what the numbers actually say
The first input is the dividend itself. ANZ declared a full-year dividend of $1.66 per share for FY2025, comprising an 83 cent interim and 83 cent final dividend, both 70% franked. This was disclosed in ANZ’s 2025 Full Year Result and Proposed Final Dividend ASX announcement, dated approximately 10 November 2025. The 2026 interim dividend of 83 cents per share at 75% franking, announced 1 May 2026 alongside half-year results showing cash profit of $3.78 billion (up 14% on the prior half, excluding significant items), confirmed the current run-rate.
The growth rate is where judgement enters. ANZ has provided no explicit dividend growth guidance. Management frames dividends as a function of sustainable earnings and capital position, not as a target growth series. Investors must infer g from the surrounding data, and several factors pull in different directions:
- Supporting modest growth: CET1 of 12.39% as at 31 March 2026 sits comfortably above APRA’s “unquestionably strong” benchmarks, providing capital headroom. Return on tangible equity improved to 11.6% in the 2026 half-year result. Suncorp Bank integration is expected to deliver earnings accretion once synergies are realised.
- Constraining aggressive assumptions: NIM pressure from mortgage and deposit competition continues to compress margins. Near-term Suncorp integration costs absorb capital that might otherwise support dividend growth. APRA regulatory settings constrain payout ratios independently of management preferences. No formal payout ratio target has been published.
APRA’s unquestionably strong capital framework sets the calibrated capital benchmarks that Australian authorised deposit-taking institutions must maintain, establishing the floor against which ANZ’s CET1 ratio of 12.39% is measured and providing the regulatory context for any assessment of dividend sustainability.
A conservative 2-4% long-run growth rate range is justifiable given these tensions.
The discount rate follows the risk-free anchor plus equity risk premium framework. With long Australian government bond yields in the mid-single digits through 2025-2026 and equity risk premiums of approximately 4-6%, three scenarios emerge: 8% (optimistic), 9-10% (central case), and 11-12% (conservative).
The following table, drawing on ANZ’s reported figures and Rask Invest Research Team calculations, contextualises these inputs against peer benchmarks:
| Metric | ANZ value | Peer average | Implication for DDM |
|---|---|---|---|
| Net interest margin | ~1.57% | ~1.78% | Below-peer NIM suggests earnings headwinds that may constrain dividend growth (g) |
| Return on equity | 9.3% (full year) | 9.35% | In line with sector; supports base-case g of 2-4% but not aggressive assumptions |
| CET1 ratio | 12.39% | ~12% range | Above-peer capital position provides dividend sustainability buffer |
Note: NIM figures are directionally indicative. ROE and peer average sourced from Rask Invest Research Team calculations. CET1 as at 31 March 2026.
Each of these inputs carries the weight of a judgement call. The growth rate, in particular, is doing more work than any single number in the formula. Readers should treat its selection as the most consequential decision in the entire exercise.
Running the scenarios: from formula to a range of fair values
Applying the Gordon Growth Model formula across the selected growth rate range (2%, 3%, 4%) and discount rate range (6% through 11%) produces the following scenario matrix. Each cell represents the implied intrinsic value of ANZ shares using a $1.66 full-year DPS input.
| Discount rate (r) | g = 2% | g = 3% | g = 4% |
|---|---|---|---|
| 6% | $41.50 | $55.33 | $83.00 |
| 8% | $27.67 | $33.20 | $41.50 |
| 9% | $23.71 | $27.67 | $33.20 |
| 10% | $20.75 | $23.71 | $27.67 |
| 11% | $18.44 | $20.75 | $23.71 |
The spread is dramatic. At a 6% discount rate with 4% growth, the model implies a value of $83.00. At 11% with 2% growth, the implied value falls to $18.44. Neither extreme should be taken as a literal price target. Their purpose is to illustrate, viscerally, why the denominator (r minus g) is the most sensitive variable in the entire framework.
The averaged central estimate, drawing across the moderate scenarios, lands at approximately $35.10 using the $1.66 DPS input. Using a forward-looking $1.69 DPS (reflecting modest growth from the current run-rate), the central estimate rises to approximately $35.74. ANZ’s share price as at 27 May 2026 was $35.12.
At a share price of $35.12, ANZ was trading within less than 2% of the model’s central estimate, suggesting the market had largely priced in the consensus view of dividend sustainability under base-case assumptions.
The analyst consensus 12-month price target of approximately $36.20, based on estimates from roughly 14 analysts with a range of $31.85 to $41.50 (May 2026), sits in close proximity to the DDM output. This convergence does not validate the model, but it provides a qualitative cross-check that the assumptions are within a defensible range.
To interpret the matrix effectively:
Stress-testing bank valuations against macro variables adds a layer of rigour that the static Gordon Growth formula cannot provide: applying a Bank of Queensland DDM across varying discount rates and growth inputs produces a range from $3.89 to $17.50, a spread that illustrates why qualitative due diligence on arrears rates, capital adequacy, and management execution must accompany any quantitative output.
- Identify your base-case cell. Which combination of r and g do you genuinely believe reflects ANZ’s risk and growth profile? That cell is your personal anchor.
- Check which cells represent 20%+ upside from the current price. These indicate the assumptions required for the stock to be meaningfully undervalued.
- Assess whether those assumptions are ones you genuinely believe, not merely ones you hope for. If the upside cells require a 6% discount rate or 4% perpetual growth, the margin of safety may be thinner than it appears.
Where the model breaks down: limitations investors cannot afford to ignore
The Gordon Growth Model assumes a constant, perpetual dividend growth rate. That assumption fails whenever payout ratios shift materially, credit cycles deteriorate, or regulation changes. For ANZ specifically, the Suncorp Bank integration is absorbing capital and generating one-off costs that constrain near-term dividend flexibility, a dynamic a single-stage DDM cannot capture.
The model also assumes the discount rate remains fixed. In practice, changes to the RBA cash rate, shifts in equity risk premiums during periods of market stress, and evolving APRA capital requirements all alter the effective cost of equity over time.
Key DDM limitations for Australian bank stocks:
- Perpetual growth assumption: No bank has ever delivered perfectly constant dividend growth across full credit cycles; provisions and write-downs create periodic interruptions
- Regulatory payout constraints: APRA can and does influence payout ratios independently of earnings, particularly through capital buffer requirements
- Acquisition-driven capital absorption: Integration costs from events such as the Suncorp acquisition reduce distributable earnings in ways the model does not distinguish from operational underperformance
- NIM sensitivity: ANZ’s NIM of approximately 1.57% versus a peer average of approximately 1.78% illustrates an earnings headwind that a static growth rate assumption may not adequately reflect
- Single-stage fragility: The one-stage Gordon model cannot accommodate a transition from lower near-term growth to higher long-term growth, or vice versa
Commentary from Morningstar Australia and Livewire Markets across 2024-2026 has consistently noted that capital requirements, credit cycle uncertainty, and payout ratio volatility make simple Gordon Growth DDMs less reliable as a sole method for Australian banks.
What professional analysts use instead
Broker notes from firms such as Macquarie, UBS, and Morgan Stanley quote target prices for the Big Four based on discounted cash flow (DCF) or relative valuation methods rather than DDM. The three most common complementary approaches are:
- PE relative to sector history: Comparing ANZ’s current price-to-earnings multiple against its own historical range and against peer banks identifies whether the stock is trading at a premium or discount to its earnings power.
- Price-to-book relative to ROE: This method explicitly accounts for capital efficiency; a bank trading below book value with an ROE above its cost of equity may represent value, while one trading above book with a declining ROE may not.
- Dividend yield versus historical range and term deposit rates: Retail commentary frequently compares a bank’s current yield to its own five-year average and to prevailing term deposit rates as a quick gauge of relative attractiveness.
None of these methods are mutually exclusive with DDM. Triangulating across multiple frameworks is the professional standard.
For investors wanting to move beyond the DDM and build a complete analytical picture before acting on any valuation output, our dedicated guide to ASX bank stock valuation methods covers PE, P/B, DCF, and DDM in a unified framework, alongside the qualitative checklist covering management credibility, compliance history, and loan book quality that professional analysts prioritise before any model is trusted.
ANZ near fair value in May 2026: what the model actually tells you, and what it does not
Three data points now sit side by side: a DDM central estimate of $35.10-$35.74, a share price of $35.12 as at 27 May 2026, and an analyst consensus target of approximately $36.20. The convergence tells a coherent story. ANZ was trading near the market’s consensus of fair value under base-case assumptions, which implies limited margin of safety at the current price if dividend growth underperforms or required returns rise.
“Near fair value” does not mean “sell” or “avoid.” It means the current price offers limited cushion against downside scenarios and that meaningful upside depends on assumptions more optimistic than the base case, such as faster-than-expected Suncorp synergy realisation or sustained NIM recovery.
As one additional qualitative data point, ANZ’s culture score stood at 3.3 out of 5 versus the ASX banking sector mean of 3.1 out of 5 (Seek platform, Rask Invest Research Team, as of May 2026). This has limited relevance to near-term DDM inputs but may factor into longer-term assessments of earnings quality and operational stability.
Practical next steps for readers:
- Review several years of ANZ annual reports to understand payout ratio history and how dividends have responded to earnings volatility
- Re-run the model with personal r and g assumptions, using the scenario matrix to identify where your own margin-of-safety threshold sits
- Cross-check with yield and PE metrics relative to historical ranges and current term deposit rates
- Consider seeking professional financial advice before making position-sizing decisions based on any single valuation method
This framework applies directly to any ASX dividend-paying bank stock. Source the DPS from the relevant ASX announcement, set r using the risk-free rate plus equity risk premium approach, stress-test g across a conservative-to-optimistic range, and interpret the output as one input into a broader decision, not as a verdict.
The dividend discount model is a starting point, not a verdict
The dividend discount model gives retail investors a structured, replicable framework for thinking about what they are paying for when they buy a dividend-paying bank stock. Its strength lies in forcing explicit assumptions about growth and required returns into a format that can be tested, debated, and revised. Its weakness is that the output is only as reliable as its least defensible assumption, and for Australian banks, the growth rate assumption carries more uncertainty than the formula’s simplicity suggests.
ANZ’s near-fair-value result provides a useful real-world anchor for understanding how the model works in practice. The same process applies across the ASX Big Four and, with appropriate adjustments, to other mature dividend-paying equities.
Investors ready to build a structured analytical process beyond the DDM will find our full explainer on multi-method ASX valuation covers a five-step sequence using P/S screening, EV/EBITDA benchmarking, DCF, and DDM in combination, with worked examples showing how the convergence or divergence between methods signals whether a valuation conclusion is robust or fragile.
Readers are encouraged to build their own scenario matrix using publicly available ANZ filings, to review multiple years of annual reports for dividend and payout ratio context, and to consult additional analytical perspectives before making any investment decision.
This article is for informational purposes only and should not be considered financial advice. Investors should conduct their own research and consult with financial professionals before making investment decisions. Past performance does not guarantee future results. Financial projections are subject to market conditions and various risk factors.