
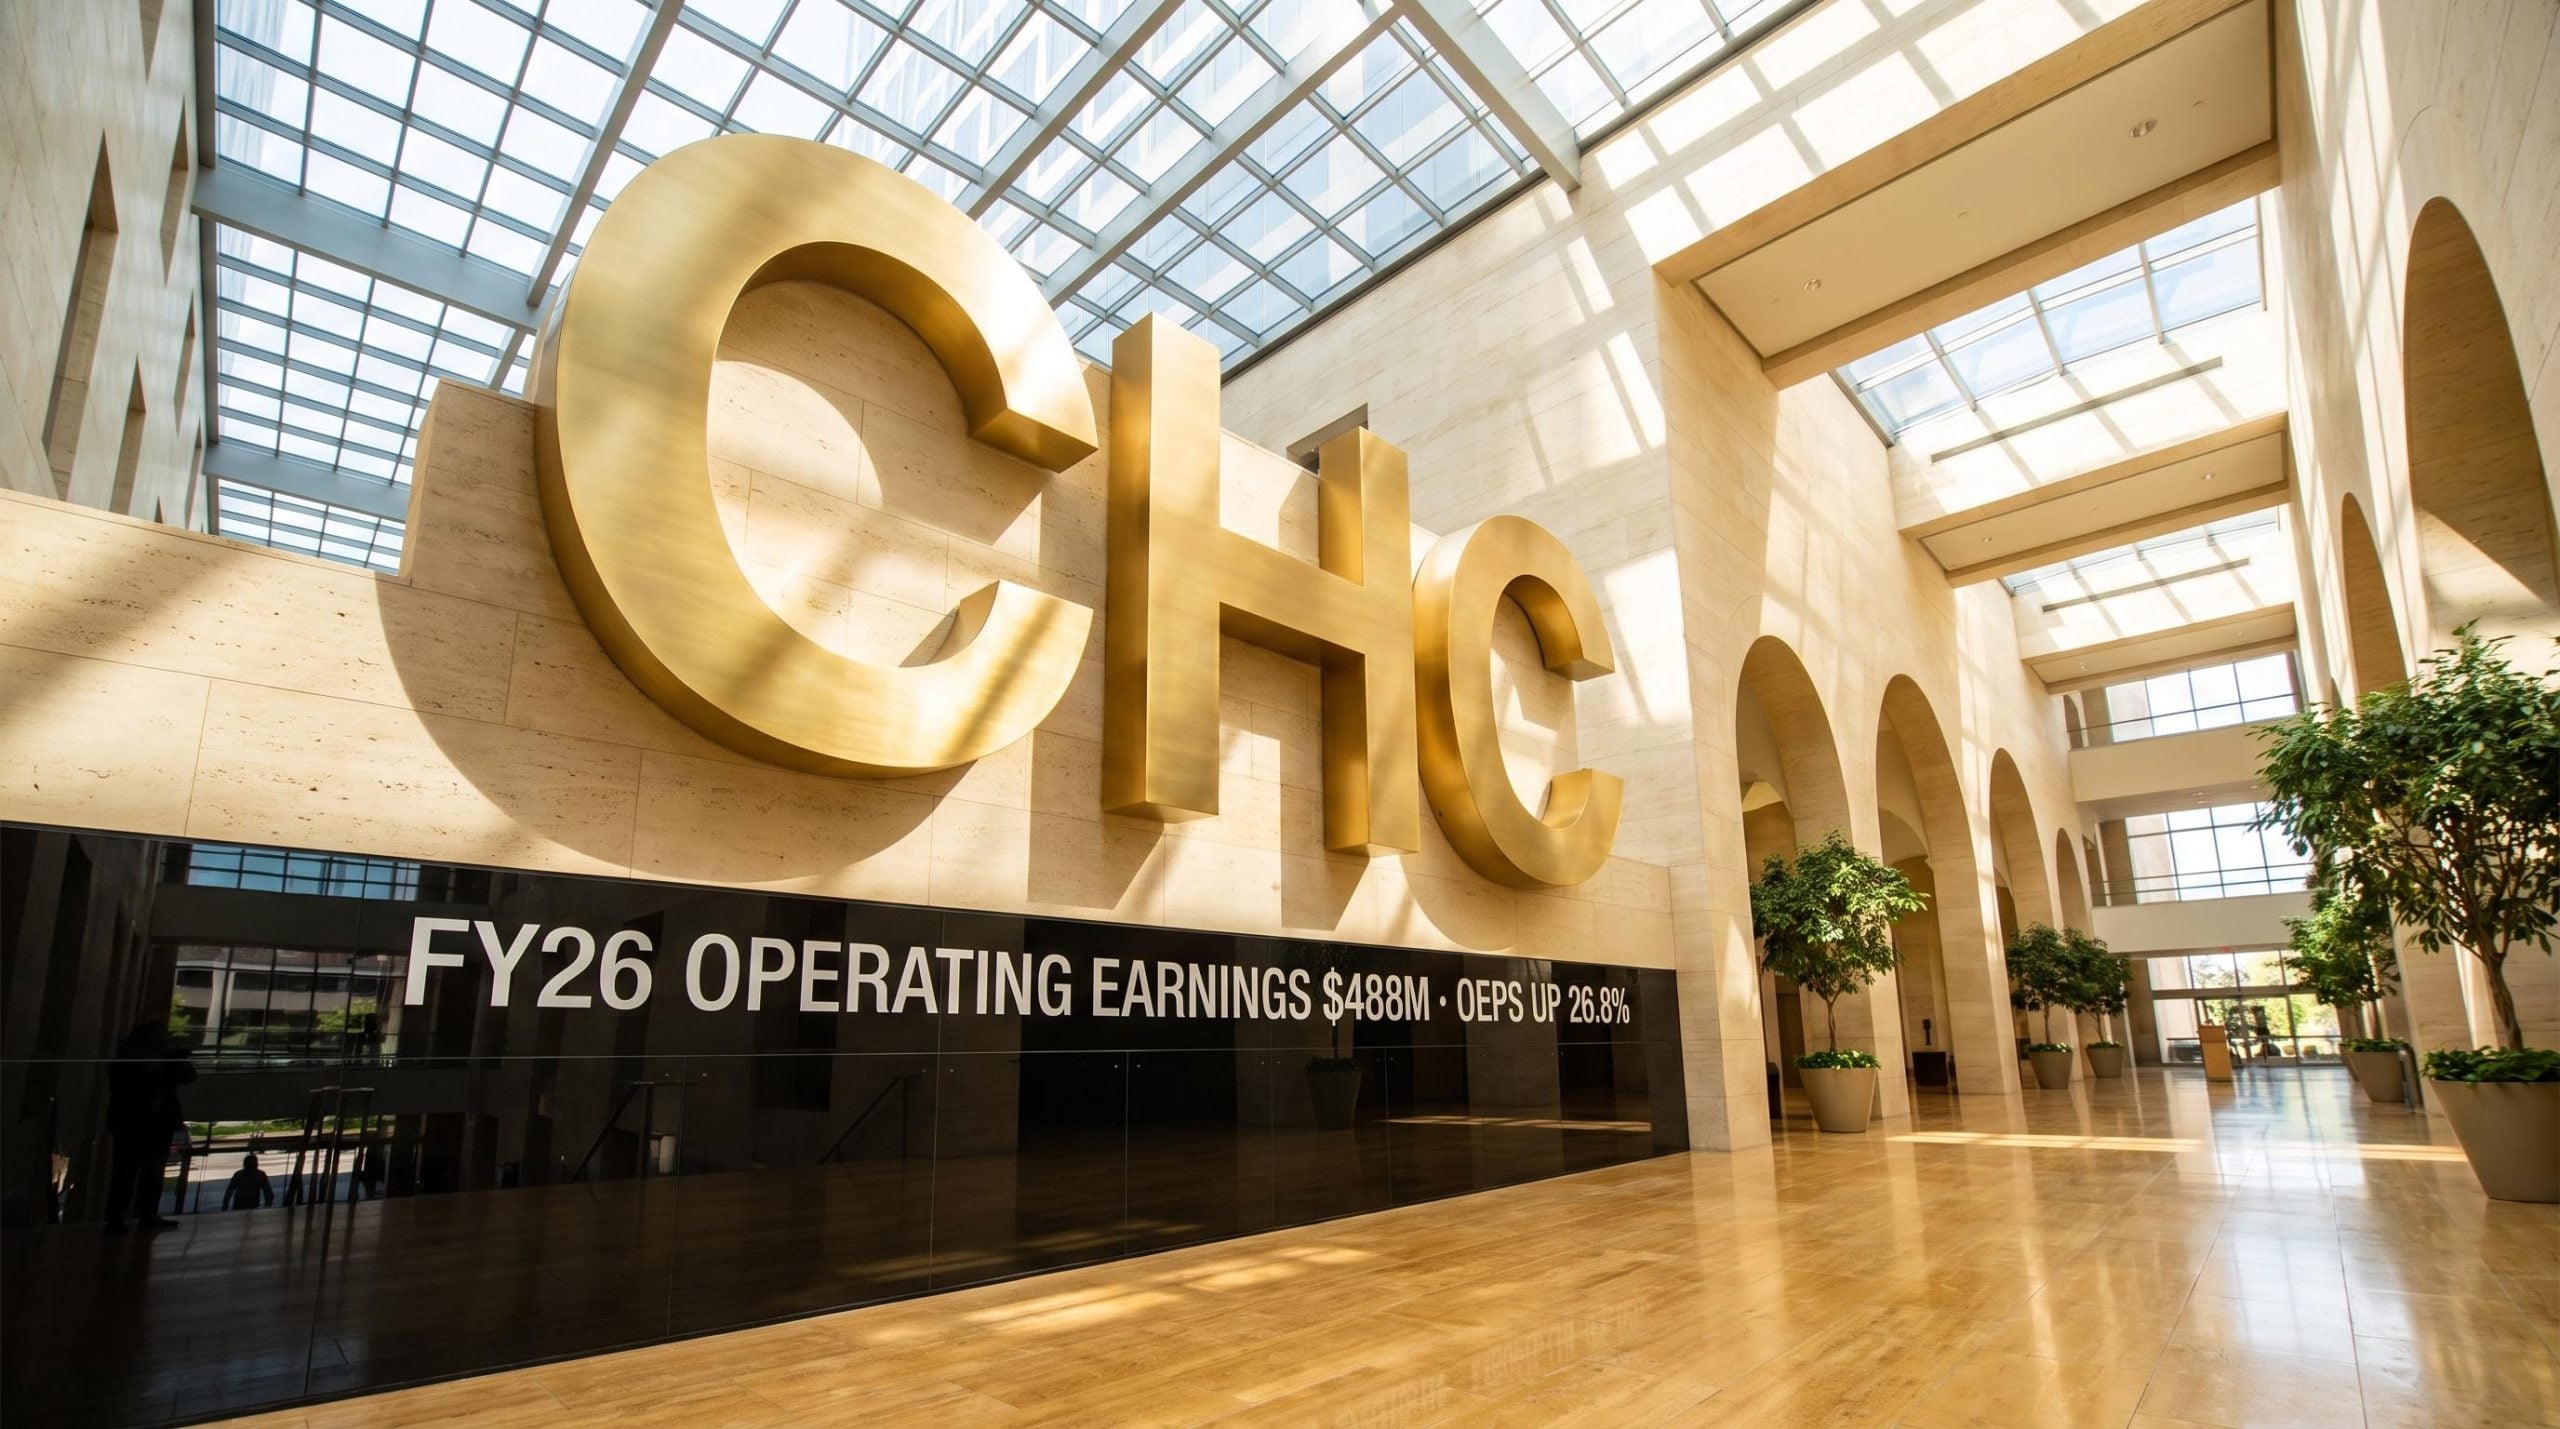
Charter Hall delivers 26.8% earnings growth and lifts FY27 guidance
In its FY26 Full Year Results presentation, Charter Hall Group reported operating earnings post-tax of $488 million for the 12 months to 30 June 2026, translating to operating earnings per security (OEPS) of 103.2cps, up 26.8% on FY25. Group Funds Under Management (FUM) reached $94.3bn, an increase of $10.0bn over the year.
Management set FY27 guidance at approximately 114.0cps, representing 10.5% growth. The diversified property fund manager returned to strong earnings momentum, with record equity inflows underpinning growth across its platform.
When big ASX news breaks, our subscribers know first
FY26 headline results at a glance
The following table summarises the group’s key FY26 metrics, showing the breadth of the result across earnings, FUM, returns and gearing.
| Metric | FY26 | FY25 | Change |
|---|---|---|---|
| Operating earnings (post-tax) | $488.1m | $385.0m | +26.8% |
| OEPS (post-tax) | 103.2cps | 81.4cps | +26.8% |
| DPS | 50.7cps | 47.8cps | +6.0% |
| Group FUM | $94.3bn | $84.3bn | +$10.0bn |
| Return on contributed equity (post-tax) | 26.4% | 20.8% | — |
| Balance sheet gearing | 14.2% | 6.0% | — |
Additional FY26 highlights disclosed in the presentation include:
- $3.2bn co-investment (PI) portfolio
- 17.0% growth in Property Investment EBITDA
- $17.7bn gross transactions
- $6.4bn group investment capacity ($1.0bn balance sheet capacity)
- NTA per security of $5.95 (up from $5.55)
Record equity inflows power FUM growth
Charter Hall reported record gross equity inflows of $6.7bn for the year, with net inflows of $4.54bn. Institutional Wholesale flows drove 94.4% of new equity, reflecting multiple mandate wins alongside newly launched funds and partnerships.
Institutional mandate wins of this scale deepen the fee income base without Charter Hall deploying its own balance sheet capital, a dynamic illustrated earlier in FY26 when a $1.2 billion diversified mandate was secured from an existing client.
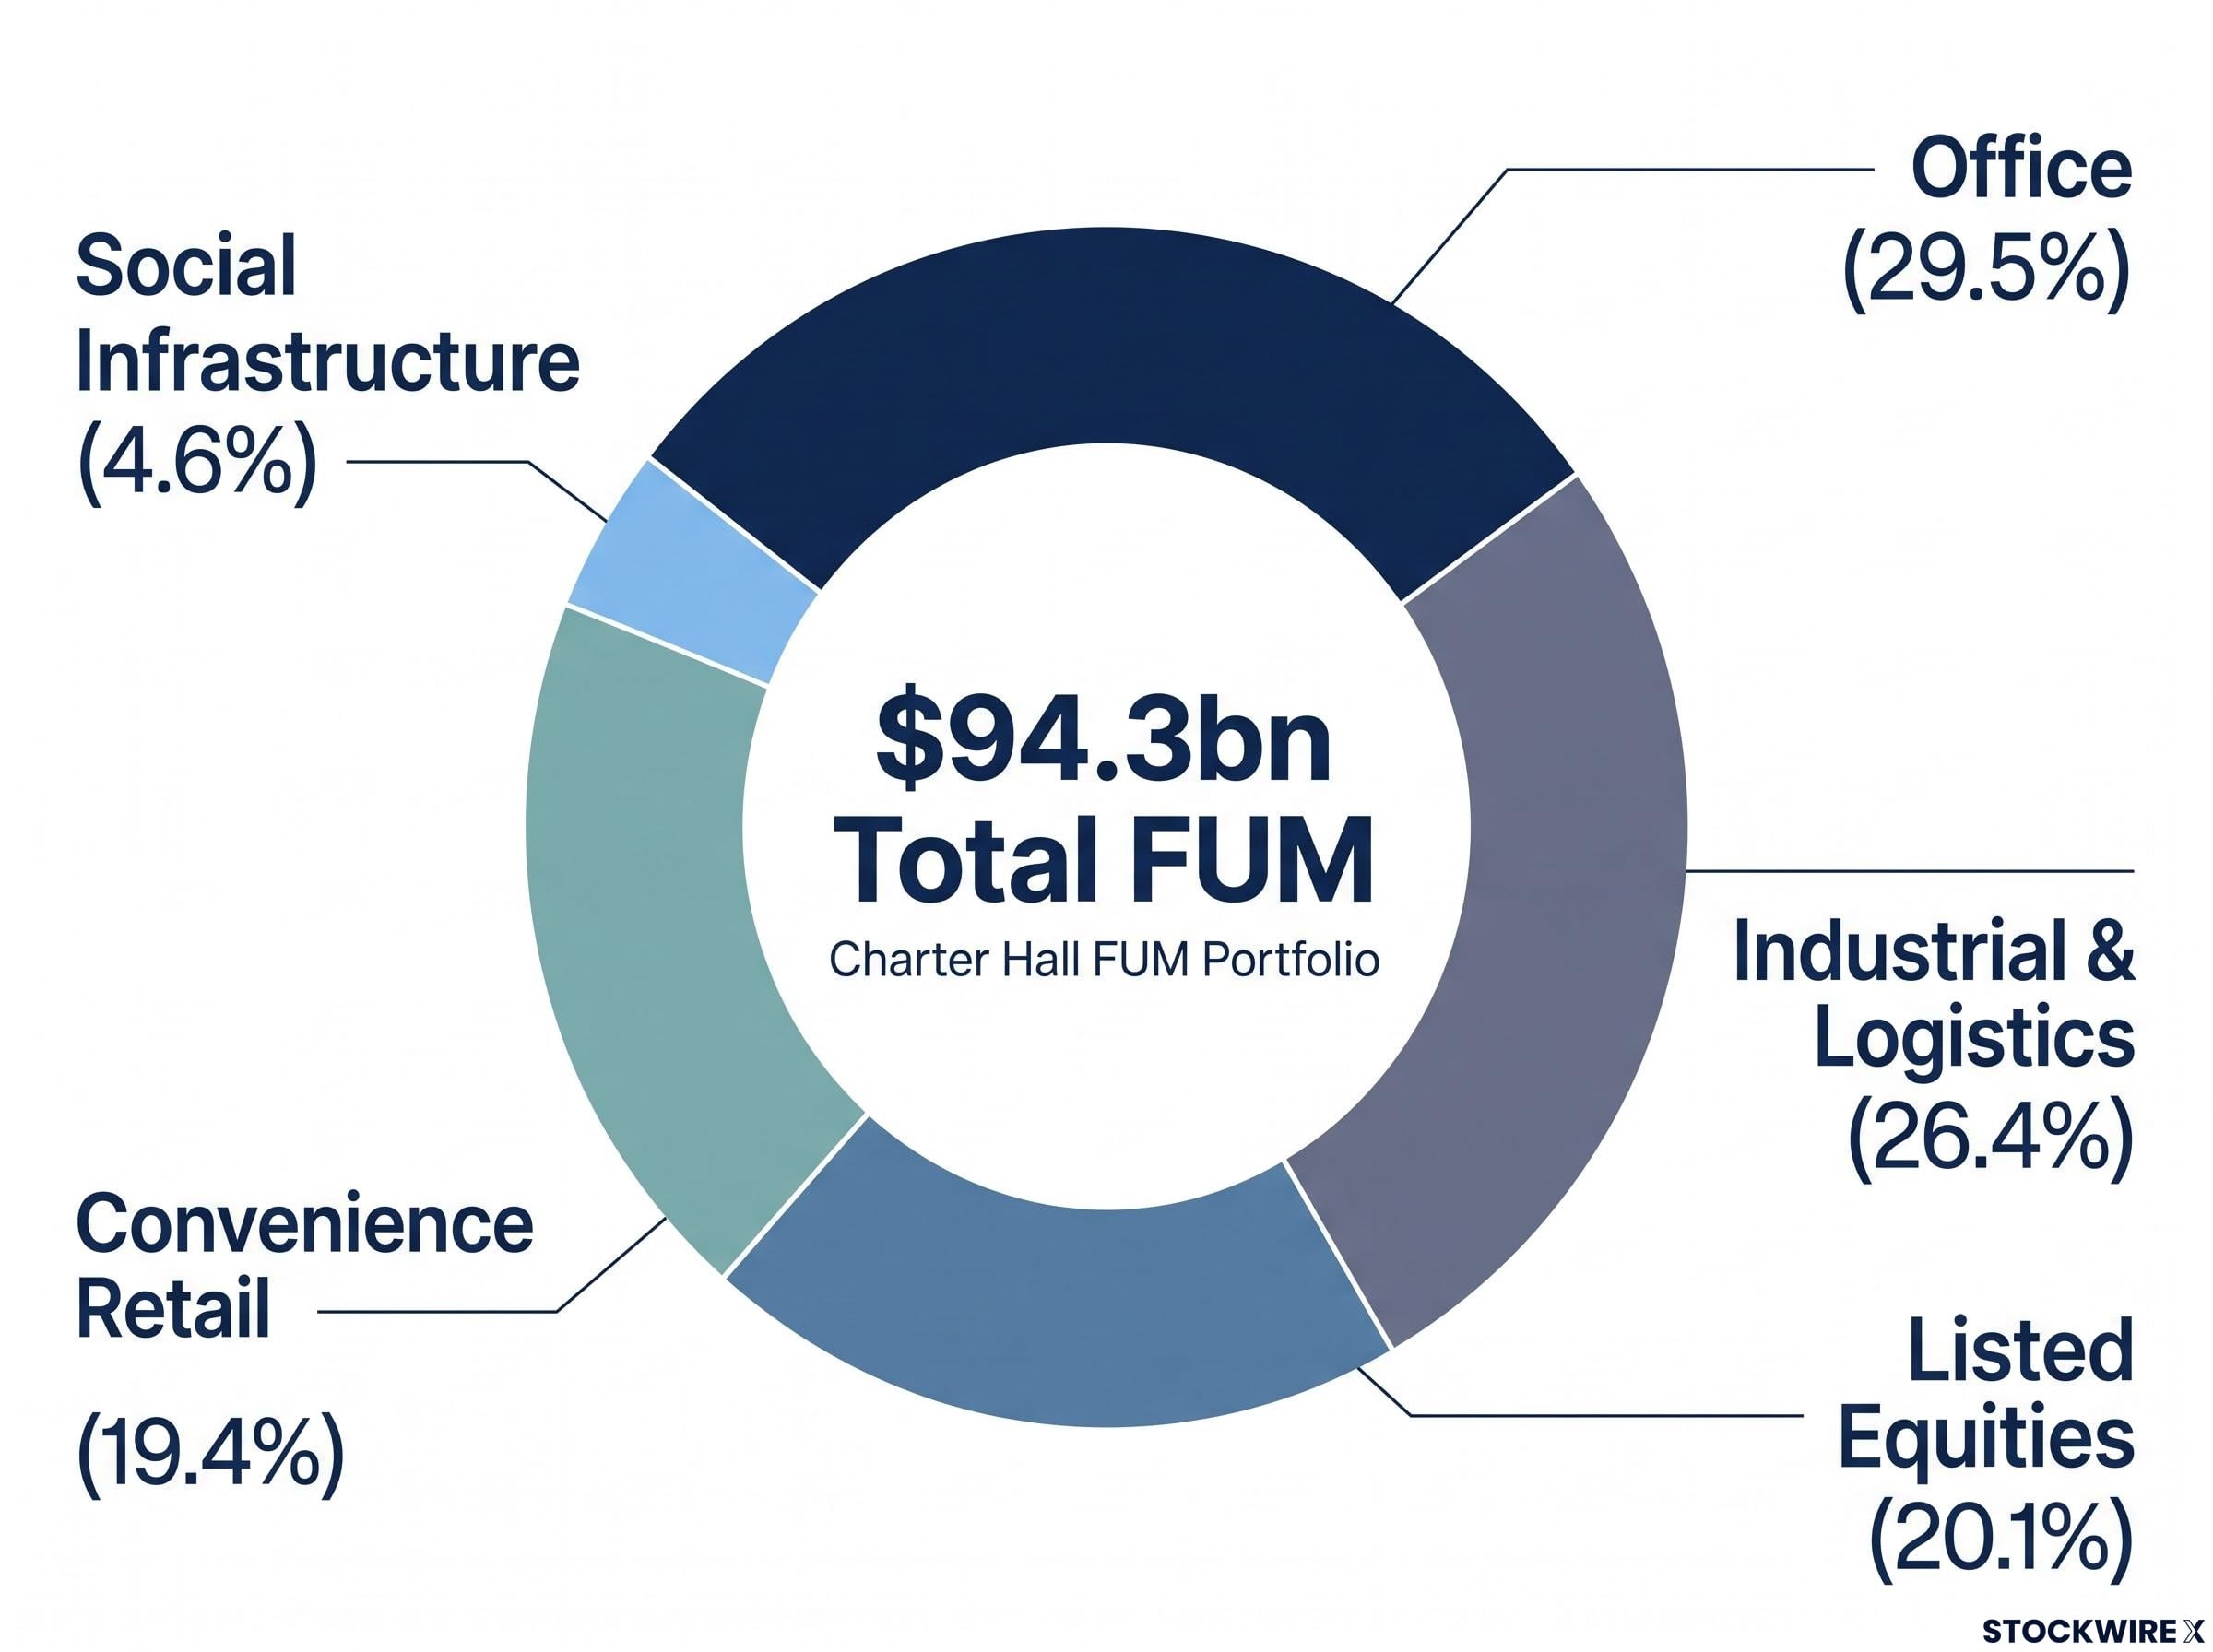
Group FUM of $94.3bn now spans Office (29.5%), Industrial & Logistics (26.4%), Listed Equities (20.1%), Convenience Retail (19.4%) and Social Infrastructure (4.6%). Paradice Investment Management (PIM) contributes $18.3bn of this FUM.
Property FUM grew 13.8% to $76.0bn, driven by $11.9bn in acquisitions and $2.1bn in net revaluations. A growing FUM base matters to investors because it drives recurring funds management fees over time.
Segment strength across the portfolio
Each sector delivered a distinct performance profile during the year:
- Office — $27.9bn FUM, 95% occupancy, five funds ranked in GRESB’s global top 10
- Industrial & Logistics — $24.9bn FUM, 99.1% occupancy, 8.7yr WALE
- Convenience Retail — $18.3bn FUM, with the newly established Charter Hall Convenience Retail Fund (CCRF) launched during the period
- Social Infrastructure — $4.4bn FUM, 99.8% occupancy, 11.8yr WALE
Understanding Charter Hall’s fund manager model
As a diversified property fund manager, Charter Hall raises equity from investors across institutional wholesale, listed REITs and direct/retail channels, deploys that capital into property, and earns funds management fees plus returns from co-investing its own balance sheet alongside partners. The presentation framed this model around four strategic pillars: Access, Deploy, Manage, and Invest.
The business generates two core earnings streams: Funds Management (FM) EBITDA, being the fees earned from managing $94.3bn in FUM, and Property/Development Investment (PI/DI) EBITDA, being returns on its own $3.2bn co-investment. PI and DI together contributed 58% of Group EBITDA. Recurring fee income scales with FUM, while co-investment aligns the manager with its capital partners.
Financial results and a strengthened balance sheet
Total Segment EBITDA rose 15.2% to $696.2m. This comprised PI EBITDA of $341.6m (up 17.0%), DI EBITDA of $61.5m (up 51.5%) and FM EBITDA of $293.1m (up 8.0%). Statutory earnings after tax reached $427.9m, up from $327.7m in FY25.
The balance sheet ended the period with available cash of $206m, gearing of 14.2%, NTA per security of $5.95 and investment capacity of $1.0bn. In March 2026, the company completed an MTN issue of A$250m for 7 years at a 150bps credit margin, and executed $22.6bn of new and refinanced debt facilities across FY26.
Key Data Point
FY26 operating earnings rose 26.8% to $488 million, with return on contributed equity reaching 26.4% post-tax.
Low gearing combined with $6.4bn of platform liquidity provides capacity for fund creation and growth opportunities.
FY27 guidance points to continued growth
Management guided to FY27 post-tax OEPS of approximately 114.0cps, representing 10.5% growth over FY26. This guidance assumes no material change in current market conditions and no performance fee revenue in FY27.
FY27 distribution guidance is set at 6% growth to 53.7cps, continuing 15 years of DPS growth. The presentation noted a 10-year OEPS growth track record of 12.2% and 7.8% DPS growth over 15 years. Guiding to a second consecutive year of double-digit earnings growth signals management confidence in the deployment pipeline.
The CIO leadership transition announced in early August 2026 introduced one near-term variable to the outlook, with CEO David Harrison absorbing the role on an interim basis while a formal appointment process runs, though management confirmed no change to strategy or platform guidance.
What’s next for the platform
Forward drivers disclosed in the presentation include:
- $20.4bn total development pipeline ($4.6bn committed, $15.8bn uncommitted)
- Industrial pipeline of $7.1bn and Office pipeline of $7.8bn, including Chifley Square, Sydney (~70% leased)
- $5.5bn on-completion value in the planning-approved Living & Mixed-Use incubation portfolio
- $6.4bn available investment capacity to fund new opportunities
Why FY26 matters for the investment case
Record equity inflows, a growing FUM base, low gearing and rising guidance combine to present a scalable, recurring-income fund manager with a clear growth runway. Diversification adds resilience, with no single asset representing more than 6% of the PI portfolio, approximately 26% of portfolio income sourced from government tenants, and what the company describes as the largest diversified property portfolio in Australia.
Don’t Miss the Next ASX Finance and Real Estate Winner
Big News Blast, the FREE alert service trusted by 20,000+ active subscribers, delivers breaking ASX announcements with in-depth analysis directly to your inbox within minutes of release. Stay ahead of the market the moment major results, guidance updates and sector news break. Click the “Free Alerts” button at Big News Blast to start receiving real-time coverage today.