
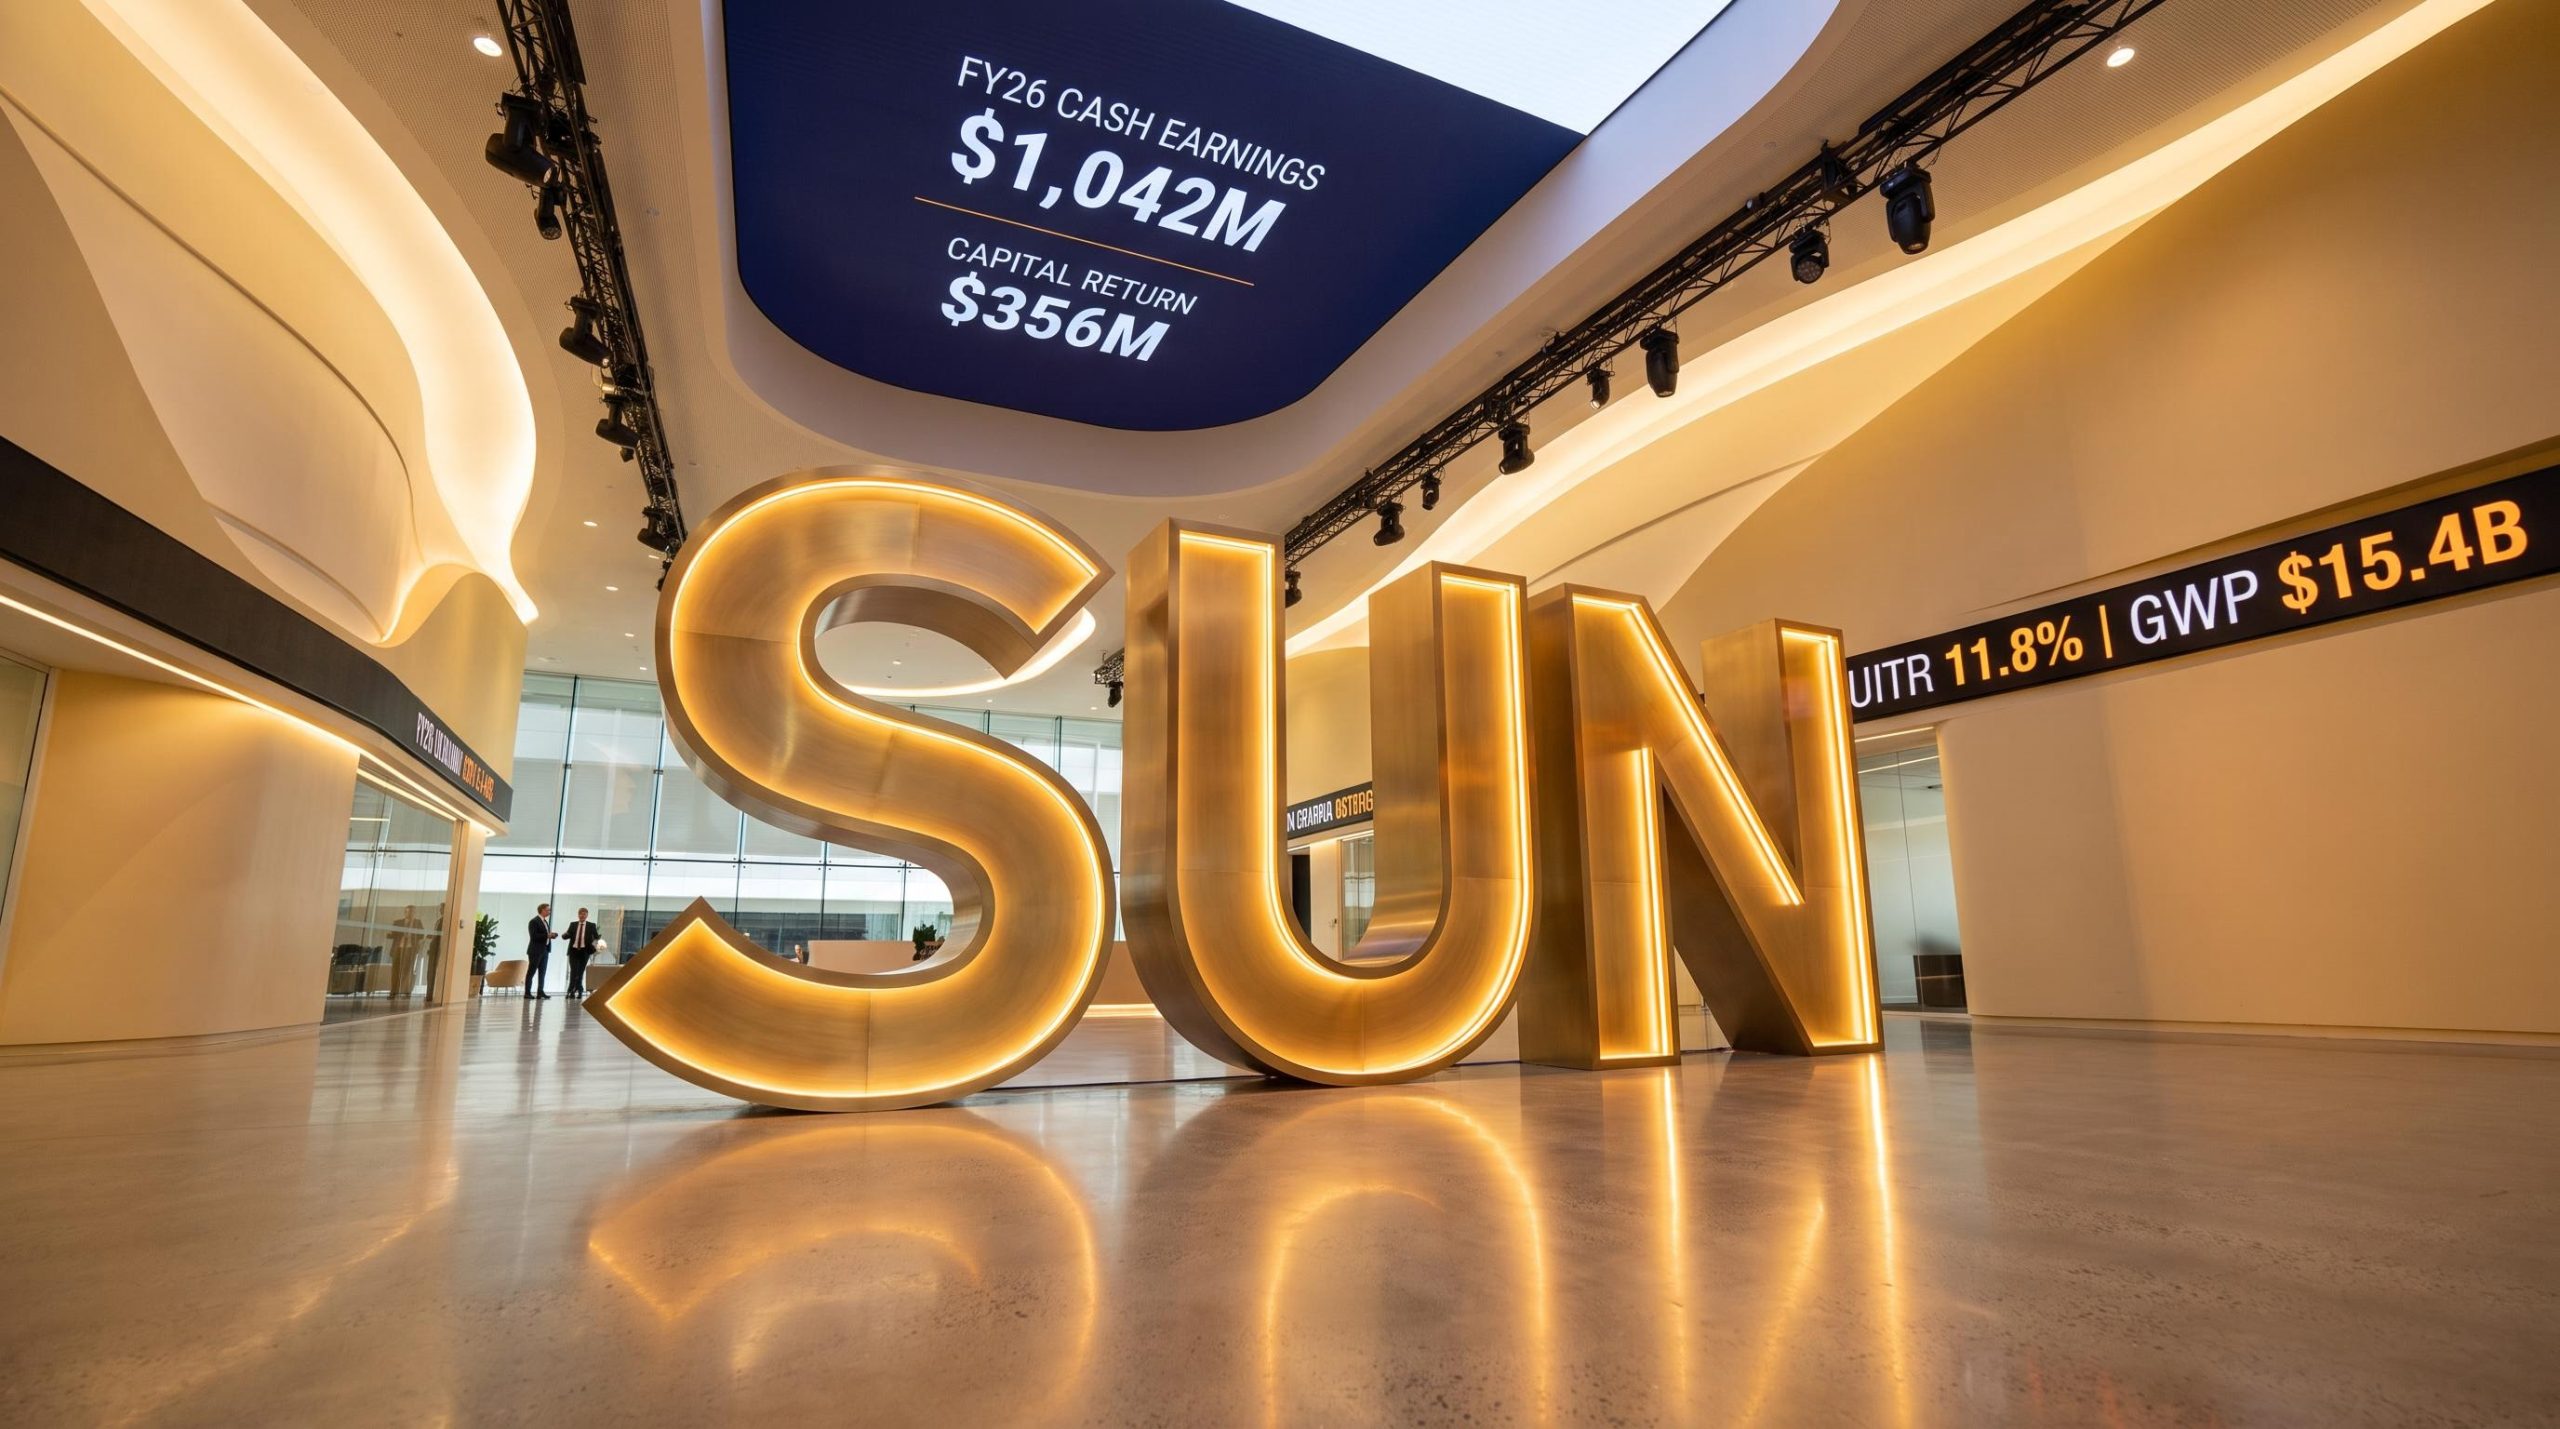
Suncorp caps FY26 with $1.04b cash earnings and $356m capital return
In its FY26 results presentation delivered on 12 August 2026, Suncorp Group outlined a full-year result headlined by cash earnings of $1,042m, net profit after tax (NPAT) of $1.03b, and underlying earnings up 4.5%. Chief Executive Officer Steve Johnston and Chief Financial Officer Jeremy Robson presented the numbers alongside a fresh $356m capital return to shareholders.
The result marks the first full-year performance of Suncorp as a pure-play insurer, following completion of its bank and life divestments. Gross written premium (GWP) reached $15.4b, while the underlying insurance trading ratio (UITR) held at 11.8%, sitting at the top of the group’s 10–12% target range.
When big ASX news breaks, our subscribers know first
FY26 result at a glance
Management detailed a set of headline metrics reflecting resilient margins and disciplined delivery through an active year for natural hazards. The 11.8% UITR represents the 5th consecutive reporting period where the margin has been above 11%, a level Johnston described as coming with greater resilience and less reliance on reserve releases.
Notably, cash earnings absorbed natural hazard costs of $254m above the full-year allowance, reinforcing the quality of the underlying performance.
| Metric | FY26 Value |
|---|---|
| Cash earnings | $1,042m |
| Underlying ITR result | $1,636m |
| Gross written premium | $15.4b |
| Underlying ITR | 11.8% |
| Net investment returns | $553m |
| Natural hazard experience | $254m above allowance |
Supporting the result:
-
Investment portfolio yield increased to approximately 5%, with an exit yield of 5.3% at 30 June.
-
Prior year reserve releases of $156m, reflecting better claims development.
-
18 weather events over $10m each managed across the year.
A $356m capital return, backed by a strong balance sheet
The centrepiece for shareholders is a two-part return: a fully franked special dividend of 10cps and an on-market buyback of up to $250m to be completed over FY27, subject to market conditions. Together these represent $356m of excess capital the Board intends to return.
This follows the $400m buyback completed in FY26, which resulted in 23 million shares cancelled, equivalent to around 2% of shares outstanding. Over the past three years, Suncorp has returned over $4.8b of total capital, with 238 million fewer shares on issue today than six years ago, an outcome management framed as supporting earnings per share (EPS).
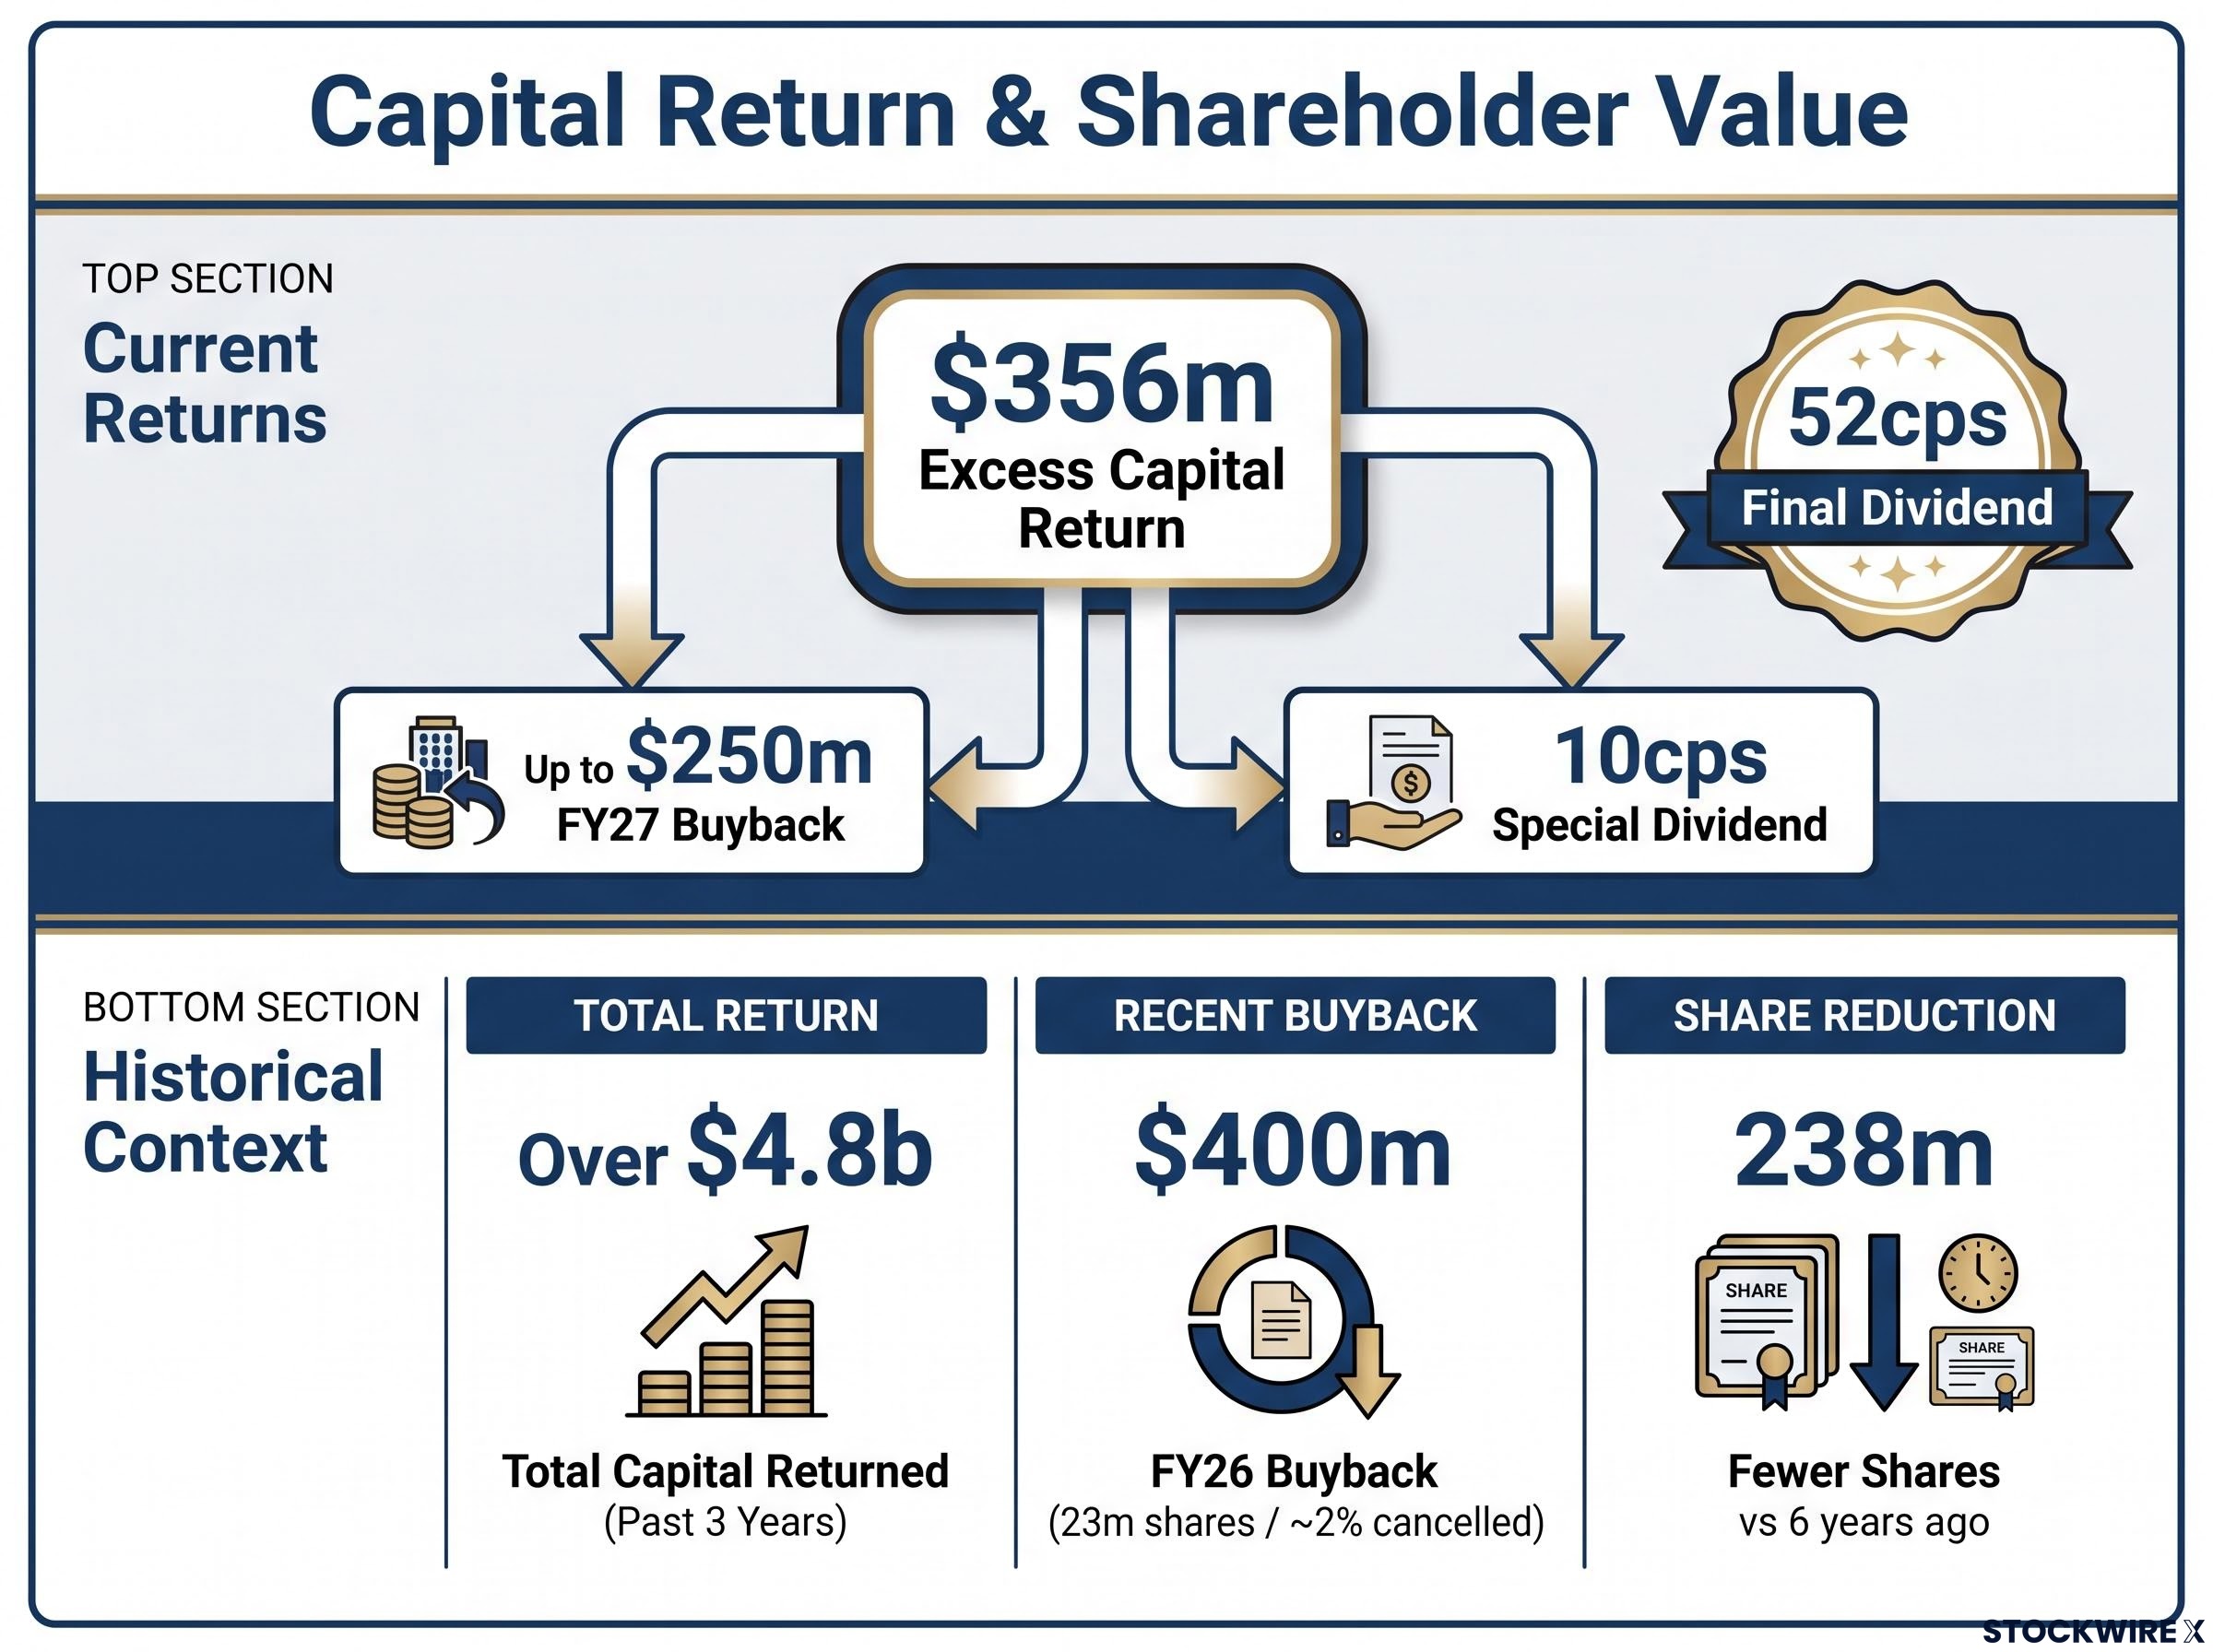
The capital was released through the placement of aggregate reinsurance protection and the receipt of the deferred New Zealand Life proceeds. Suncorp received NZ$160m in NZ Life sale deferred proceeds on 31 July. After accounting for these returns, pro-forma excess CET1 remains $162m above the midpoint of the target range.
Suncorp’s wholesale AT1 capital notes issuance in April 2026 added a further dimension to its capital strategy, with perpetual subordinated instruments supporting Additional Tier 1 requirements across regulated entities without immediate equity dilution.
Steve Johnston, Chief Executive Officer & Managing Director
“We have long maintained a disciplined approach to capital management, guided by the principle that capital in excess of the needs of the business should be returned to shareholders in an efficient manner.”
| Return | Value | Detail |
|---|---|---|
| Final dividend | 52cps | 71% payout of cash earnings |
| Special dividend | 10cps | To be paid with the final dividend on 22 September 2026 |
| FY27 buyback | Up to $250m | Over FY27, subject to market conditions |
Where the growth came from across the portfolios
GWP grew 2.7% on a headline basis, or 3.6% when normalising for the weaker New Zealand dollar. The Consumer division led the way, with Home up 5.9% and Motor up 5.8%, supported by pricing and organic unit growth. Management highlighted that enhanced risk selection and pricing capabilities continue to shift the portfolio toward lower-risk segments.
Commercial and Personal Injury delivered growth across all portfolios, with compulsory third party (CTP) pricing gains in NSW and Queensland. The division recognised prior year reserve releases of $177m, reflecting better claims development across the portfolio.
New Zealand told a more mixed story. Total NZD GWP was down 4.8% (down 10.0% on an AUD-adjusted basis), reflecting the exit of a brokered book and a soft commercial market. The direct AA Insurance business grew 3.2%, however, and New Zealand margins remained strong at 19.5%.
Niche brands added further colour to the growth picture:
-
Shannons GWP up 8%
-
Bingle GWP up 13%
-
Terri Scheer GWP up 16%
What “aggregate reinsurance” means for earnings resilience
Aggregate reinsurance cover is protection that limits the total cost of natural hazard claims across a full year, rather than for individual events. In plain terms, it caps how much a weather-exposed insurer can lose from claims over a 12-month period.
Suncorp’s new 5-year aggregate cover provides up to $800m per annum of protection, capping natural hazard downside at $50m for FY27 in approximately 90% of scenarios. For a business exposed to weather volatility, this materially reduces earnings uncertainty. FY26 alone saw $2.0b in net natural hazard costs across 120,000 claims and 18 events over $10m each.
Management described the cover as broadly economically neutral, and it delivered a one-off capital benefit of approximately $107m. There is an upside angle too: profit-share and commission arrangements mean benign weather years are expected to flow through to reported margin.
For readers wanting to understand the mechanics and commercial terms behind this arrangement in more depth, our full explainer on Suncorp’s $2.4b reinsurance deal covers the structure of the five-year aggregate cover, the capital release rationale, and the profit-share commission framework that underpins the benign-year upside.
The investment case, resilience with upside
The FY26 result reflects an improved risk/return profile. Margins were held in the top half of the target range while resilience was strengthened through reduced reliance on reserve releases, the natural hazard allowance buffer, and investment hedging.
Robson pointed to meaningful reported-margin upside of approximately 170bps to 220bps on average natural hazard experience, including around 80bps from profit commissions. Expense discipline was also evident, with the total expense ratio improving 50bps to 18.1% while the business continued to invest in transformation.
Transformation, AI and the FY27–29 roadmap
Johnston outlined a three-phase strategic evolution: simplification through the sale of Life, Wealth, SMART, Bank and New Zealand Life; investing in the pure-play insurer; and now leveraging those investments to deliver better customer and operational outcomes.
The presentation detailed growing momentum on artificial intelligence (AI) adoption, with several proof points across the insurance value chain:
-
3+ million annual customer interactions across 15 conversational assistants.
-
Claims pre-lodgement voice agent launched in May 2026.
-
Smart Knowledge handling 300k+ queries, saving 47k+ hours of manual effort.
-
3,900+ productivity agents built by employees.
Management flagged that further detail on portfolio priorities and AI strategy would be provided at the Investor Day in October.
FY27 outlook
Management set out the following expectations for FY27:
-
GWP growth of 3%–5%, assuming an average AUD/NZD FX rate of 0.85.
-
UITR expected to be in the top half of the 10–12% range, including the aggregate cover premium.
-
Total expense ratio broadly in line with FY26.
-
Payout ratio around the midpoint of the 60%–80% range of cash earnings.
-
An on-market buyback of up to $250m targeted for completion over FY27.
Suncorp reiterated its commitment to returning capital in excess of the needs of the business to shareholders, leaving investors with a clear signal on the group’s capital priorities as it enters its next strategic phase.
Stay Ahead on ASX Financial Sector News
Big News Blast delivers FREE breaking ASX announcements straight to your inbox within minutes of release, complete with in-depth analysis already done. Join 20,000+ subscribers who never miss a market-moving update. Click the “Free Alerts” button at Big News Blast to get ahead of the next major financial sector announcement before the market moves.