
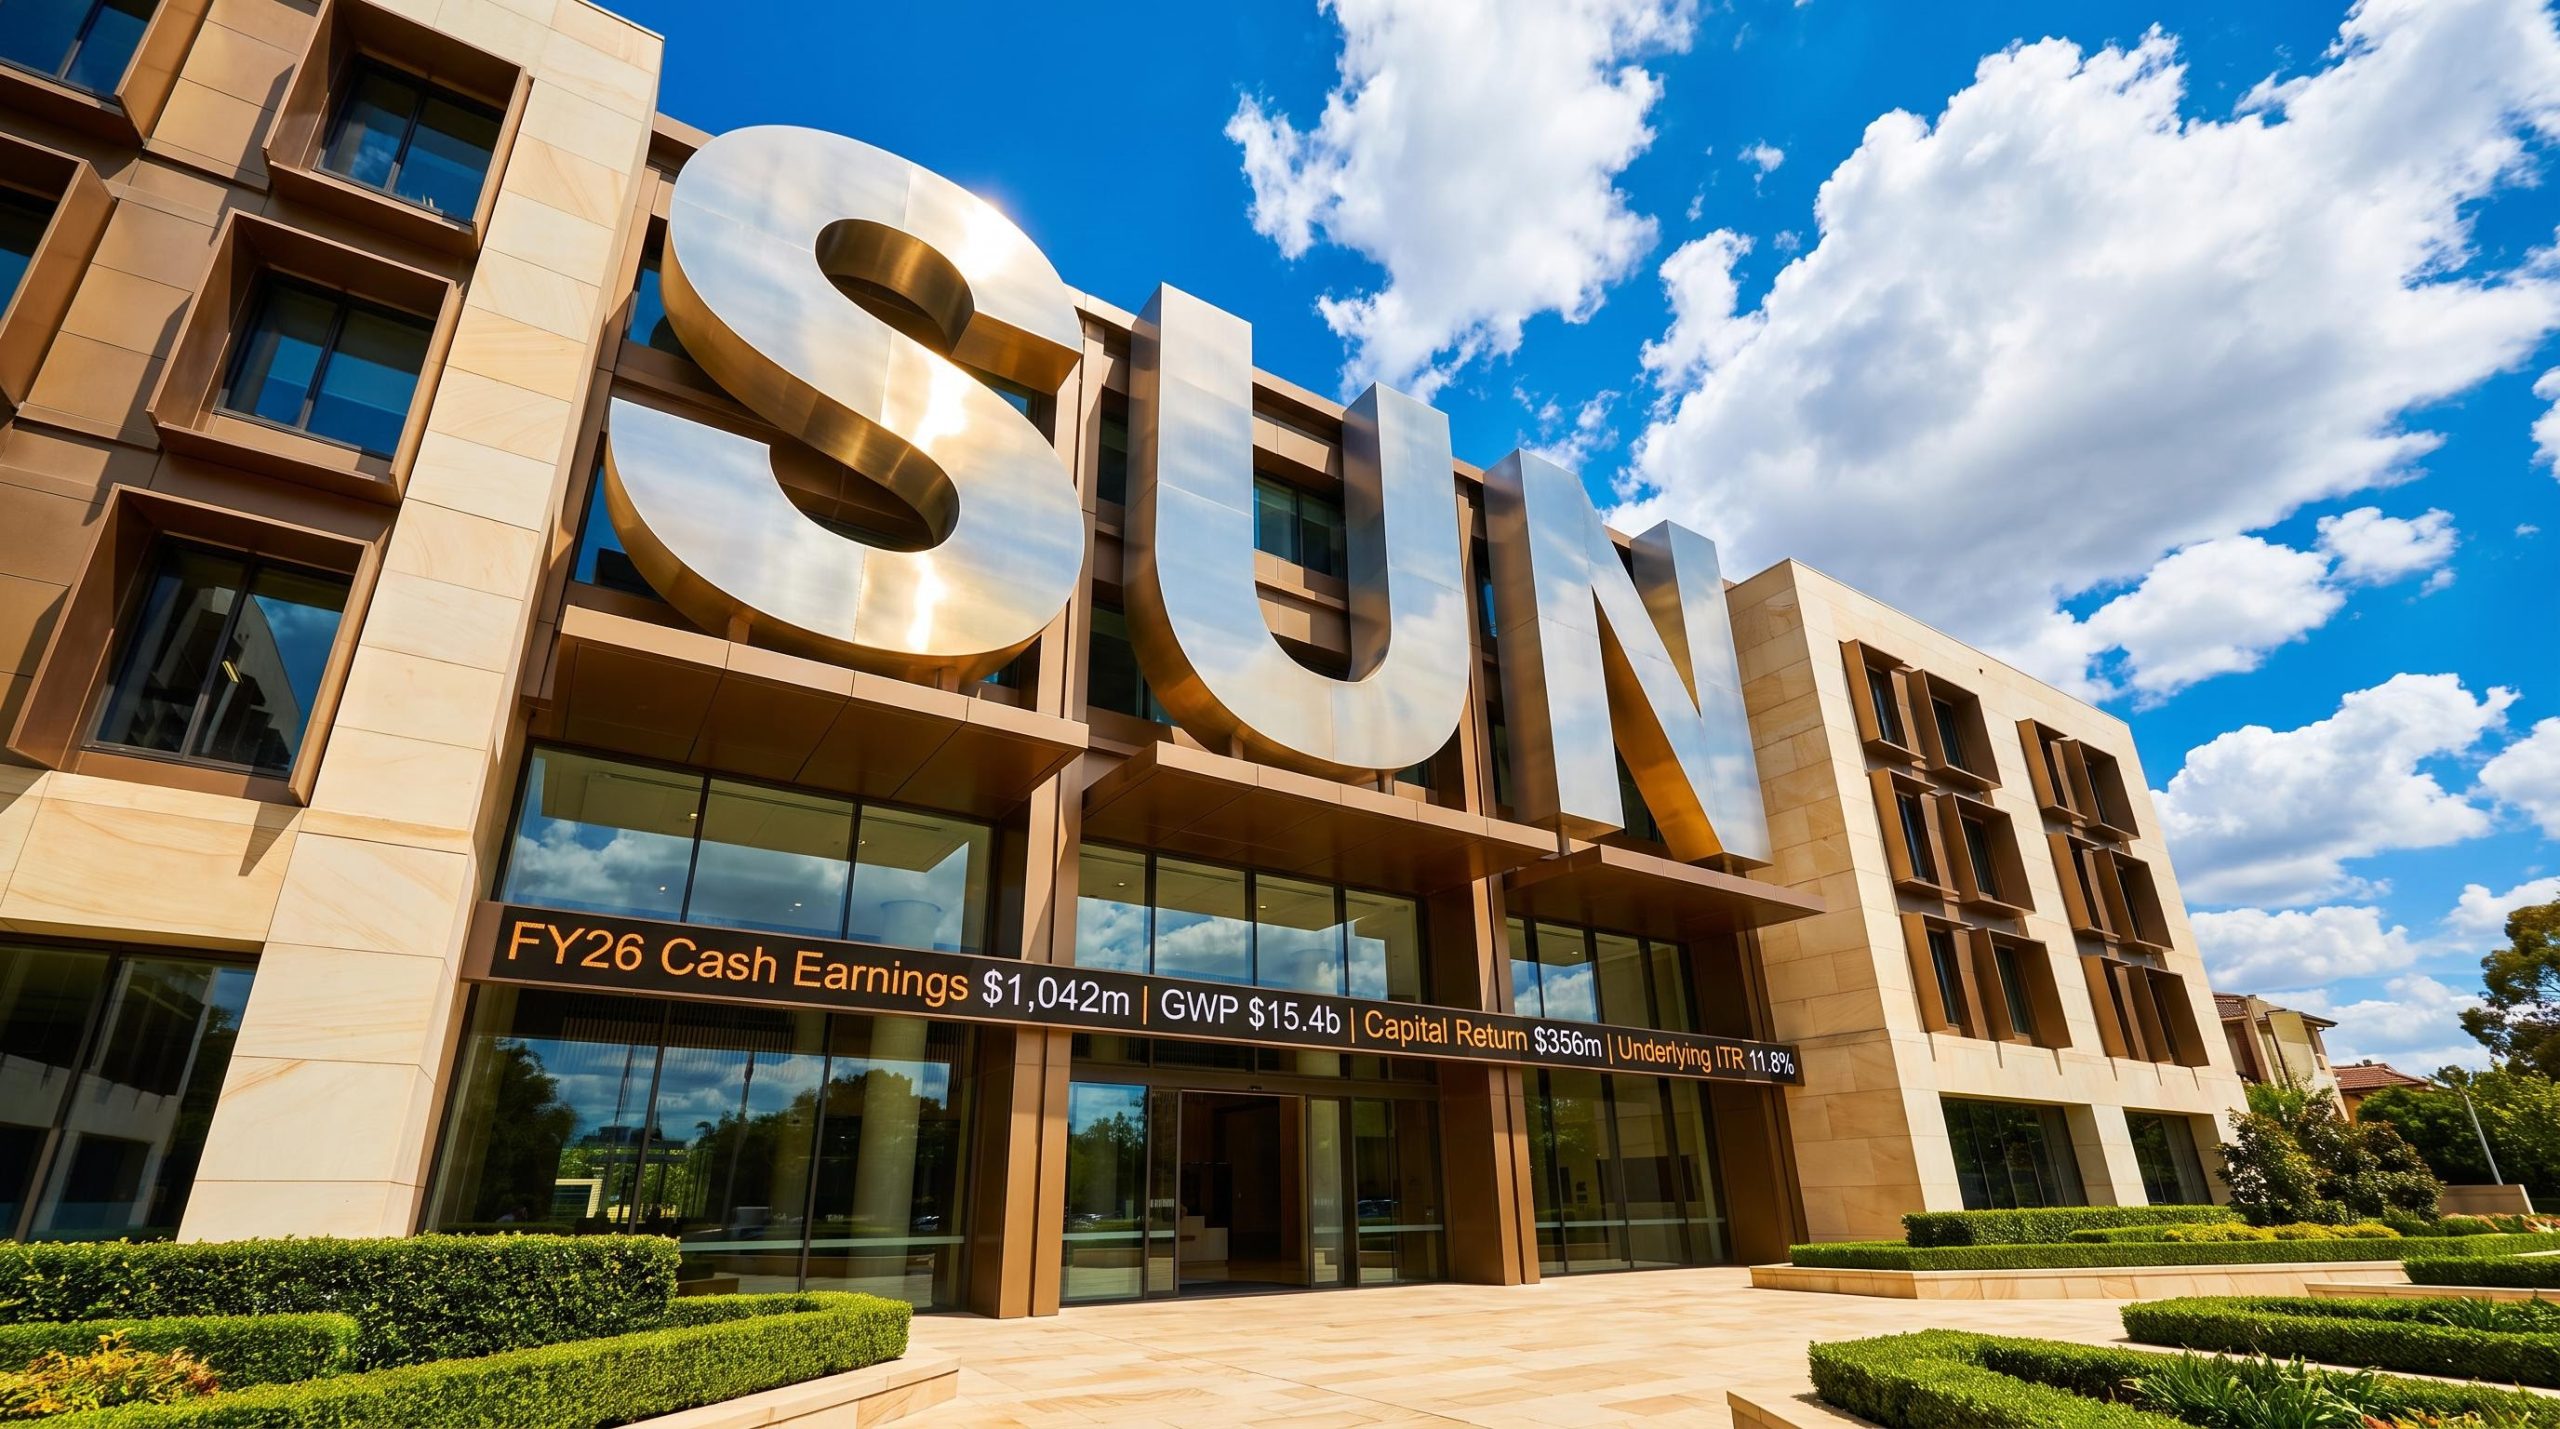
Suncorp delivers $1.04bn cash earnings and unveils $356m capital return for FY27
In its FY26 full-year results presentation delivered on 12 August 2026, Suncorp Group reported cash earnings of $1,042m and underlying earnings up 4.5% to $1.6bn for the year ended 30 June 2026.
The results showed insurance margins held at the top end of the target range, alongside a fresh capital return programme for FY27. Management outlined $356m to be returned to shareholders through a 10 cents-per-share (cps) special dividend and an on-market buyback of up to $250m.
Gross written premium (GWP) reached $15.4b, and the underlying insurance trading result came in at $1,636m, with the underlying insurance trading ratio (ITR) sitting at 11.8%.
When big ASX news breaks, our subscribers know first
FY26 results at a glance
Underlying earnings grew across all portfolios on a constant-currency basis. Management noted that cash earnings reflected elevated natural hazard experience, which ran $254m above the full-year allowance, alongside mark-to-market investment movements.
| Metric | FY26 Value | Note |
|---|---|---|
| Cash earnings | $1,042m | Reflects elevated natural hazards and mark-to-market movements |
| Underlying ITR result | $1,636m | Up 4.5% |
| Gross written premium | $15.4b | Up 2.7% |
| Underlying ITR margin | 11.8% | Top end of 10-12% target range |
| Total expense ratio | 18.1% | Down 50bps |
| Prior year reserve releases | $156m | Reflective of better claims development |
| Net investment returns | $553m |
Key operational context from the presentation included:
-
Investment portfolio yields increased to approximately 5%
-
Managed 18 weather events exceeding $10m each
-
Stronger-than-expected reserve releases across the Commercial & Personal Injury portfolios
$356m headed back to shareholders through dividends and buybacks
The capital return is the central investor angle from this result. During FY26, Suncorp completed a $400m buyback, resulting in 23m shares, or roughly 2% of shares outstanding, being cancelled.
For FY27, the company detailed a return of $356m, comprising a fully franked 10cps special dividend and an on-market buyback of up to $250m to be completed over the year, subject to market conditions.
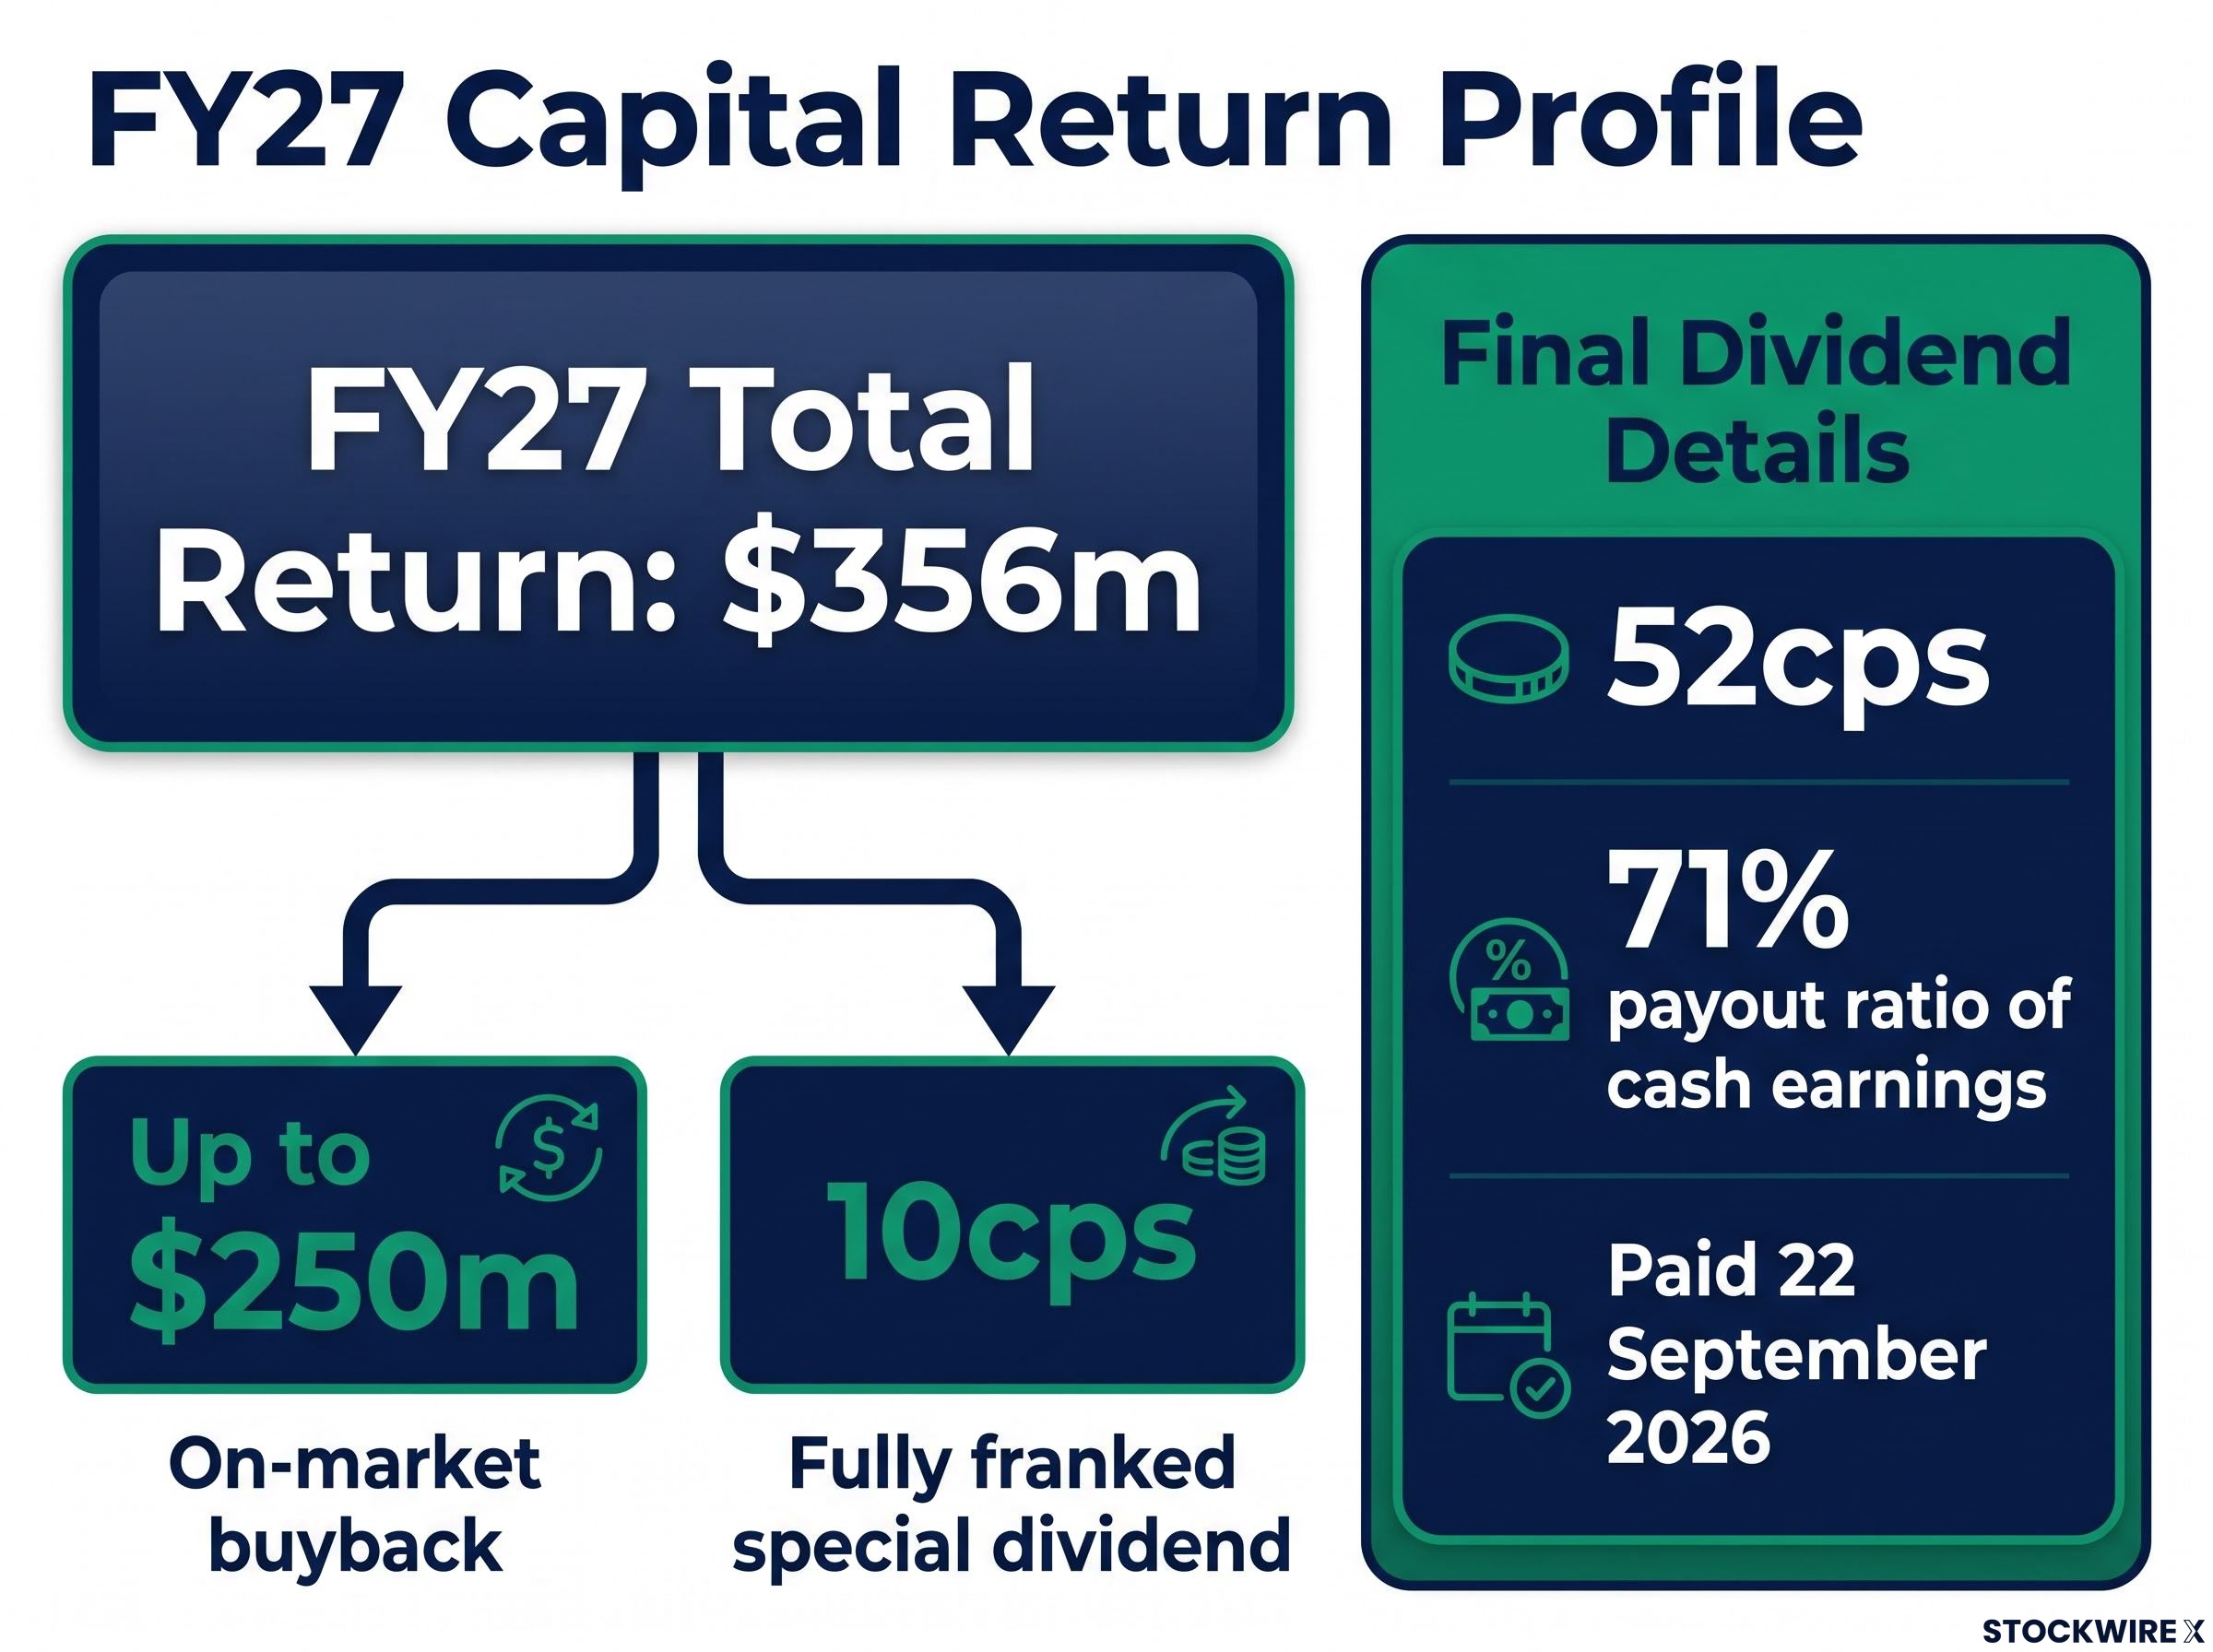
The final dividend was set at 52cps, representing a payout ratio of 71% of cash earnings. The special dividend is scheduled to be paid alongside the final dividend on 22 September 2026.
Management pointed to a strong balance sheet underpinning these returns, with excess Common Equity Tier 1 (CET1) capital of $518m above the midpoint of the target range, reducing to a pro-forma $162m after the planned returns. Suncorp stated it remains committed to “returning capital in excess of the needs of the business” to shareholders.
| Return type | Amount | Detail |
|---|---|---|
| Final dividend | 52cps | 71% payout ratio of cash earnings |
| Special dividend | 10cps | Fully franked, paid 22 September 2026 |
| FY27 buyback | Up to $250m | To be completed over FY27, subject to market conditions |
How Suncorp built its capital flexibility
The presentation attributed the excess capital to two main sources: the placement of the aggregate reinsurance cover and receipt of the deferred New Zealand Life proceeds. The aggregate cover delivered a one-off capital benefit of $107m, while NZ$160m in NZ Life sale deferred proceeds were received on 31 July.
The capital benefit from the aggregate reinsurance arrangement traces back to Suncorp’s 5-year aggregate reinsurance cover secured in April 2026, which provides $800 million of annual protection and was structured to deliver a one-off capital release at broadly neutral economic cost.
Understanding the underlying insurance trading ratio (ITR)
The underlying ITR measures how profitable an insurer’s core business is once one-off or volatile items are stripped out. These include natural hazard costs above the set allowance and swings in investment markets, giving a cleaner read on ongoing performance.
Suncorp targets a 10-12% range for this metric. Sitting at the top end at 11.8% signals disciplined pricing and effective cost control, rather than a result inflated by favourable one-offs.
For investors, resilient margins translate into more predictable earnings. That predictability supports the company’s capacity to fund dividends and buybacks over time.
Management commentary
Management, led by Chief Executive Officer & Managing Director Steve Johnston and Chief Financial Officer Jeremy Robson, highlighted growth in underlying earnings with resilient margins at the top end of the target range, supported by a strong balance sheet and disciplined capital management.
Portfolio performance across the Trans-Tasman business
Growth was recorded across the three core divisions on a normalised basis. The Consumer portfolio benefited from unit and average-written-premium growth, with margin improving 30bps from pricing for inflation and enhanced risk selection.
The Commercial & Personal Injury division saw pricing earn-through in Compulsory Third Party (CTP) and Workers’ Compensation, and included prior year reserve releases of $177m. In New Zealand, margins remained strong but moderated towards target levels amid a soft commercial market and the exit of the brokered book, with approximately A$50m in prior year releases.
| Portfolio | GWP Growth | Underlying ITR (FY25 → FY26) |
|---|---|---|
| Consumer (Home +5.9%, Motor +5.8%) | Up | 9.6% → 9.9% |
| Commercial & Personal Injury | Commercial +3.6%, Personal Injury +5.5% | 10.3% → 11.0% |
| New Zealand (AA Direct +3.2%) | (4.8%) (NZD basis) | 19.4% → 19.5% |
It is worth noting that total New Zealand GWP fell 10.0% on an AUD basis due to foreign exchange movements, even as the NZD-denominated figures showed growth in the direct channel.
The company’s niche brands recorded notable FY26 GWP growth:
-
Shannons 8%
-
bingle 13%
-
terri scheer 16%
AI momentum and the pure-play transformation
Management framed the results within a broader transformation narrative. The presentation outlined a simplification phase from 2019 to 2025 involving asset sales, followed by investment in a modernised pure-play Trans-Tasman insurer, with the company now positioned to leverage those investments.
A key theme was scaled adoption of Artificial Intelligence across the insurance value chain. Proof points detailed in the presentation included:
-
The Claims Pre-Lodgement Voice Agent, launched in May 2026
-
More than 3 million annual customer interactions through 15 conversational assistants
-
Smart Knowledge handling 300k+ queries, saving 47k+ hours of manual effort
-
3,900+ employee-built productivity agents and 14.3k+ AI learning experiences undertaken
Management positioned these developments as supporting efficiency, scalability and improved customer and claims outcomes over time.
Building earnings resilience — reinsurance and natural hazard buffers
The presentation detailed a 5-year aggregate reinsurance arrangement expected to cap natural hazard downside at $50m in approximately 90% of scenarios for FY27, described as “broadly economically neutral.”
The FY27 reinsurance program confirmed in early July formalised the layered structure now underpinning the 90% scenario cap, with third and fourth event retention in Australia reduced to $150 million through a combination of the main catastrophe program, structured multi-year cover, and dropdown covers.
Management highlighted potential reported margin upside of approximately 170bps to 220bps assuming average natural hazard experience. Supporting this resilience:
-
A robust natural hazard allowance incorporating a resiliency buffer
-
Equity tail-risk hedging to reduce earnings volatility
-
Low reliance on prior year reserve releases, assumed at around 40bps of underlying margin
FY27 outlook and what investors should watch
Management guided to continued growth and disciplined capital management for FY27. The outlook assumes an average AUD/NZD FX rate of 0.85.
| Metric | FY27 Guidance |
|---|---|
| GWP growth | ~3% to 5% (assumes AUD/NZD FX rate of 0.85) |
| Underlying ITR | Top half of 10-12% range (incl. aggregate cover premium) |
| Prior year reserve releases | ~0.4% of Group net insurance revenue |
| Total expense ratio | Broadly in line with FY26 |
| Capital management | Payout around midpoint of 60-80% range; up to $250m buyback by end FY27 |
The investment thesis emerging from the presentation is that of a simplified, capital-disciplined pure-play insurer returning excess capital to shareholders while investing in AI-led transformation. Management noted a strategic target of delivering a sustainable return on equity expected to be above the through-the-cycle cost of equity.
Stay Ahead on ASX Finance and Insurance News
Breaking ASX announcements from the finance and insurance sector land in your inbox within minutes, complete with in-depth analysis already done. Over 20,000+ subscribers rely on Big News Blast to stay ahead of the market. Hit the “Free Alerts” button to start receiving FREE real-time coverage the moment news breaks.