
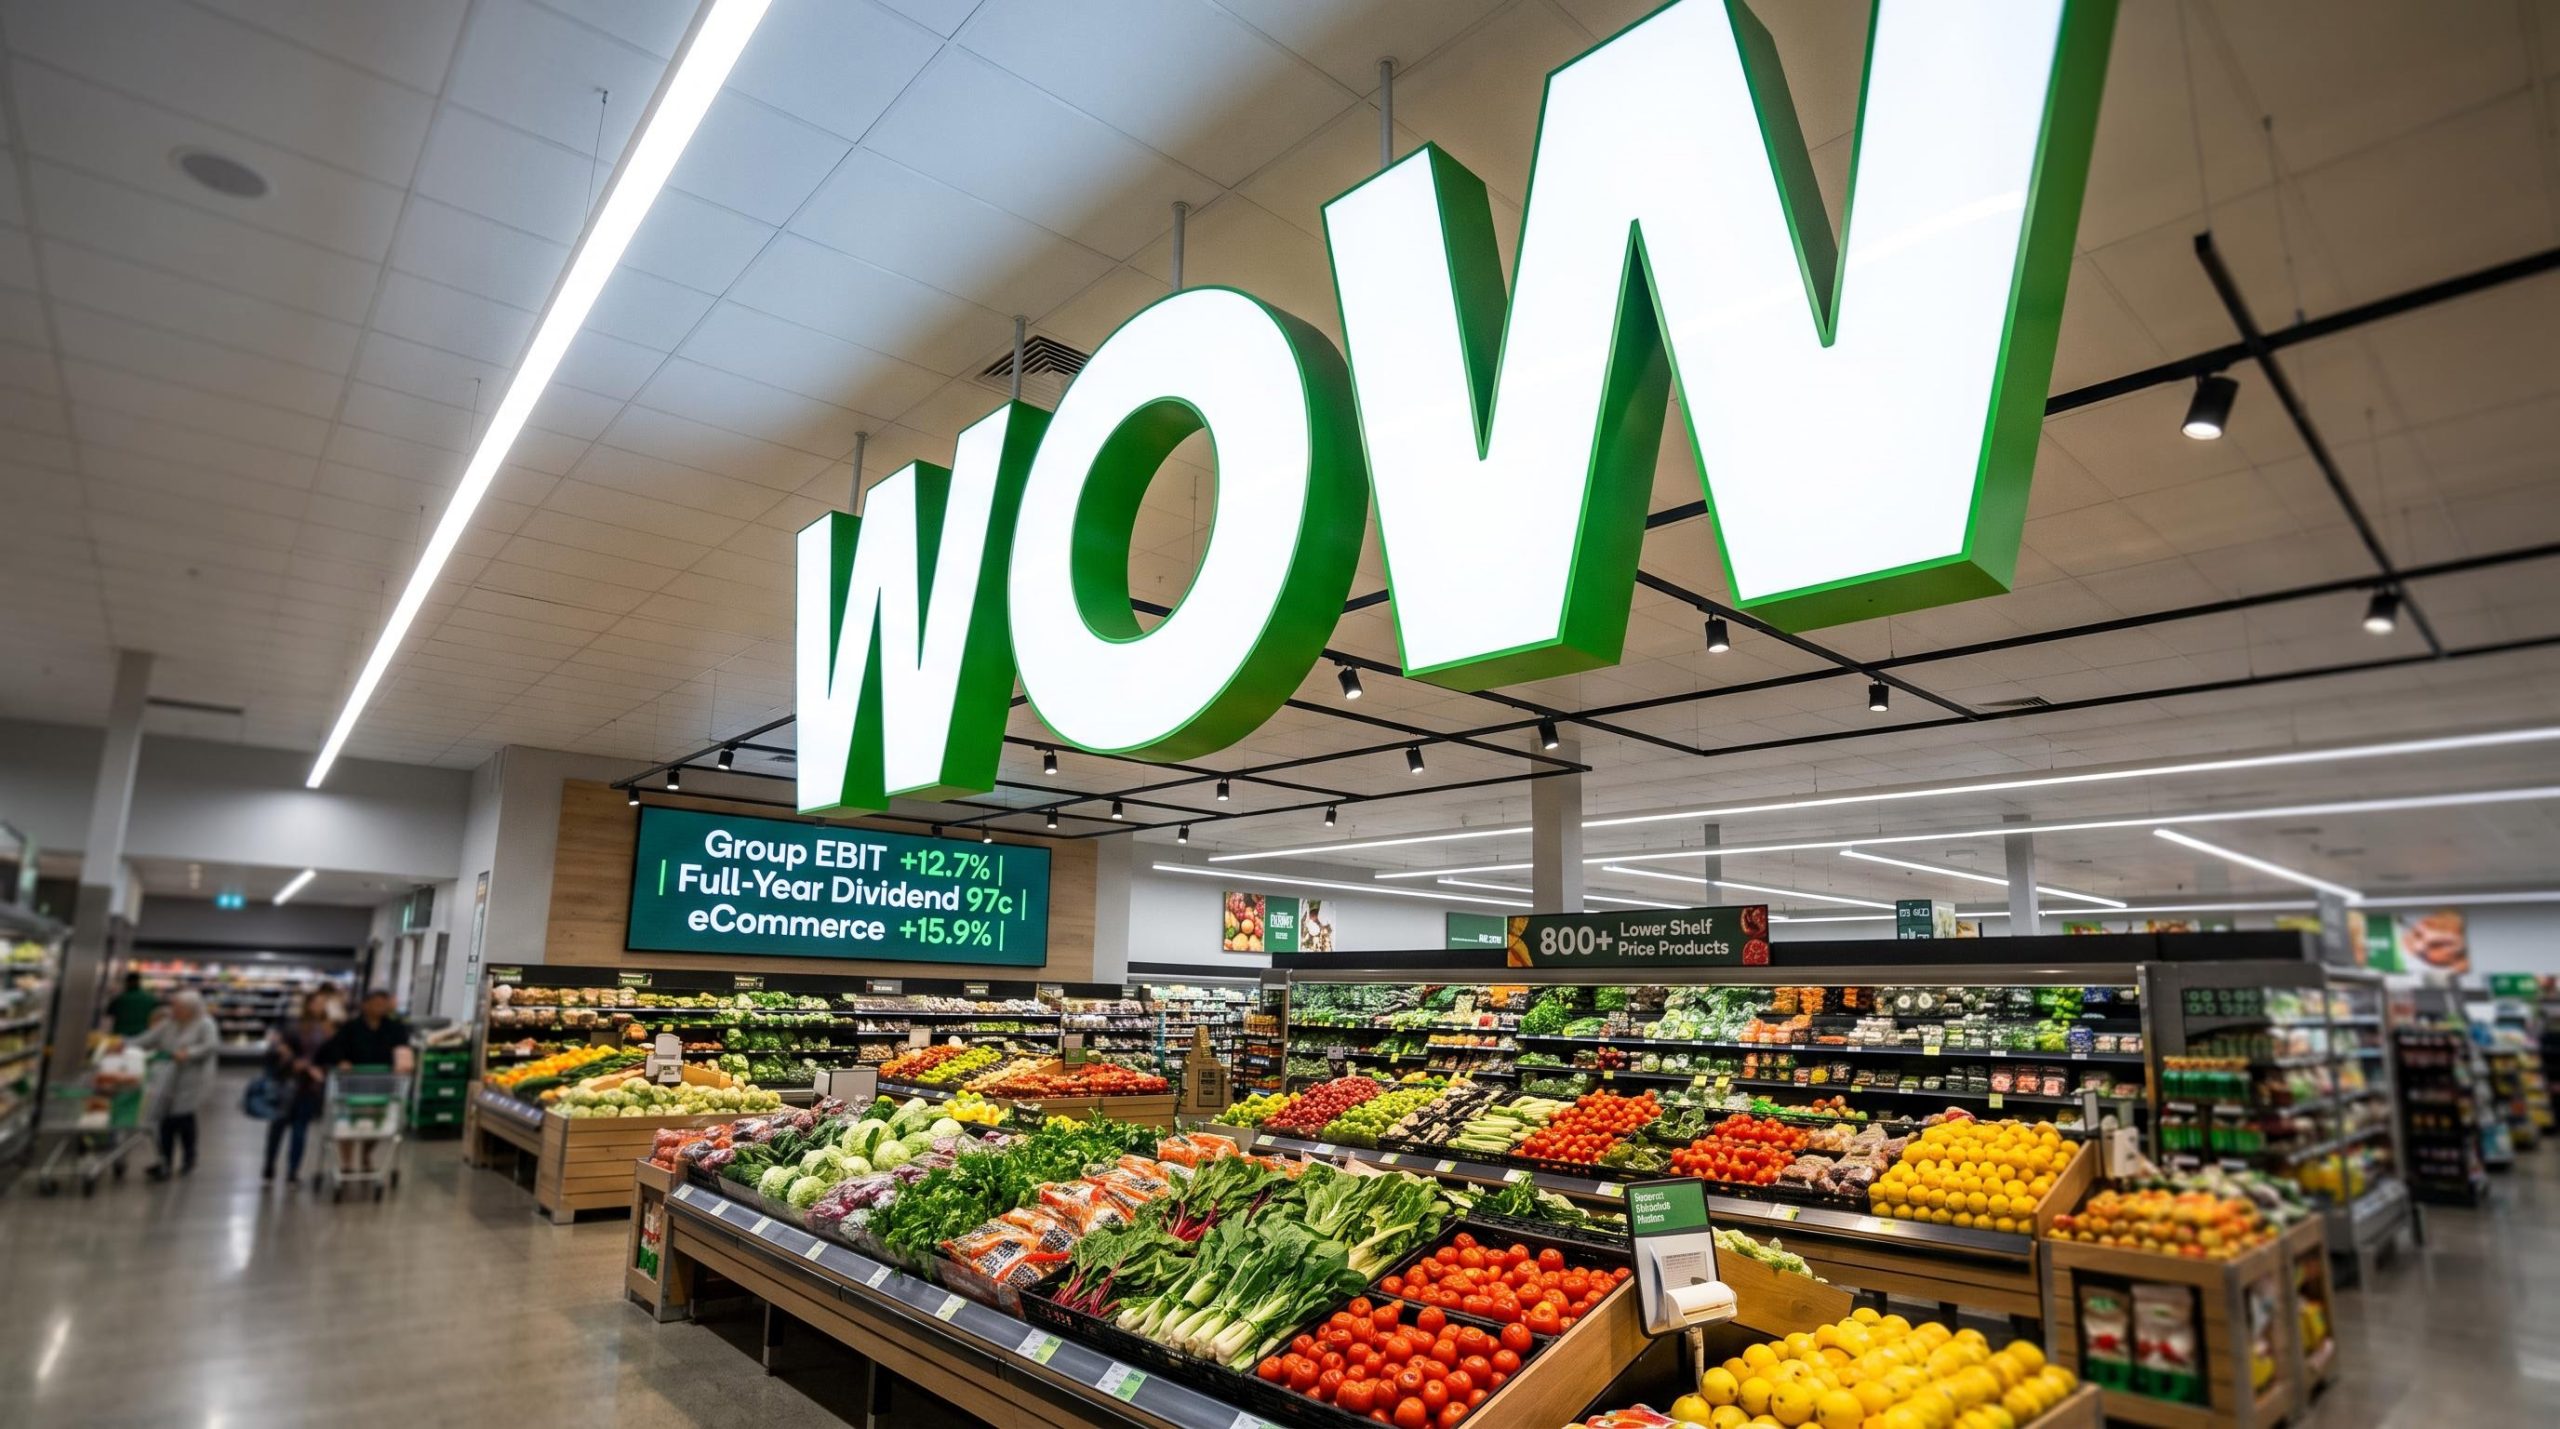
Woolworths delivers 12.7% EBIT lift as Australian Food momentum builds
In its F26 full year results presentation delivered to the market on 26 August 2026, Woolworths Group reported Group EBIT up 12.7% to $3,105m for the 52 weeks ended 28 June 2026, with all trading segments contributing to the improved result.
Group sales reached $71.5b, a rise of 3.6%, while Group NPAT climbed 15.4% and the full-year dividend was lifted 15.5% to 97 cents. Management outlined a strategy centred on customer value investment and improved execution, factors that drove a notable acceleration in the second half.
When big ASX news breaks, our subscribers know first
F26 results at a glance
The presentation set out a group-level scorecard reflecting broad-based earnings growth and stronger returns across the business.
| Metric | F26 | F25 | Change |
|---|---|---|---|
| Group sales | $71,539m | $69,077m | +3.6% |
| Group EBIT | $3,105m | $2,754m | +12.7% |
| Group NPAT | — | — | +15.4% |
| Group ROFE | 16.4% | — | +2.7 pts |
| Full-year dividend | 97c | — | +15.5% |
The company noted that Group EBIT would have risen 8.7% excluding the impact of cycling industrial action and supply chain implementation costs.
Momentum built through the year, with Group EBIT up 10.9% in the second half, signalling an accelerating trajectory into F27.
Australian Food regains momentum through value and execution
The core investment story sits within Australian Food, where sales rose 4.6% to $53,852m and EBIT increased 8.5% to $2,953m.
Value investment featured prominently. The company reported 800+ products placed on Lower Shelf Price at an average reduction of around 16%, with Q4 average prices down 0.8% and declining in every quarter of F26. Everyday Rewards active membership reached 10.8m, up 3.4%.
On execution, average shelf edge availability improved 58 bps versus F25, supporting H2 Woolworths Food Retail item growth of 4.8%.
eCommerce acceleration
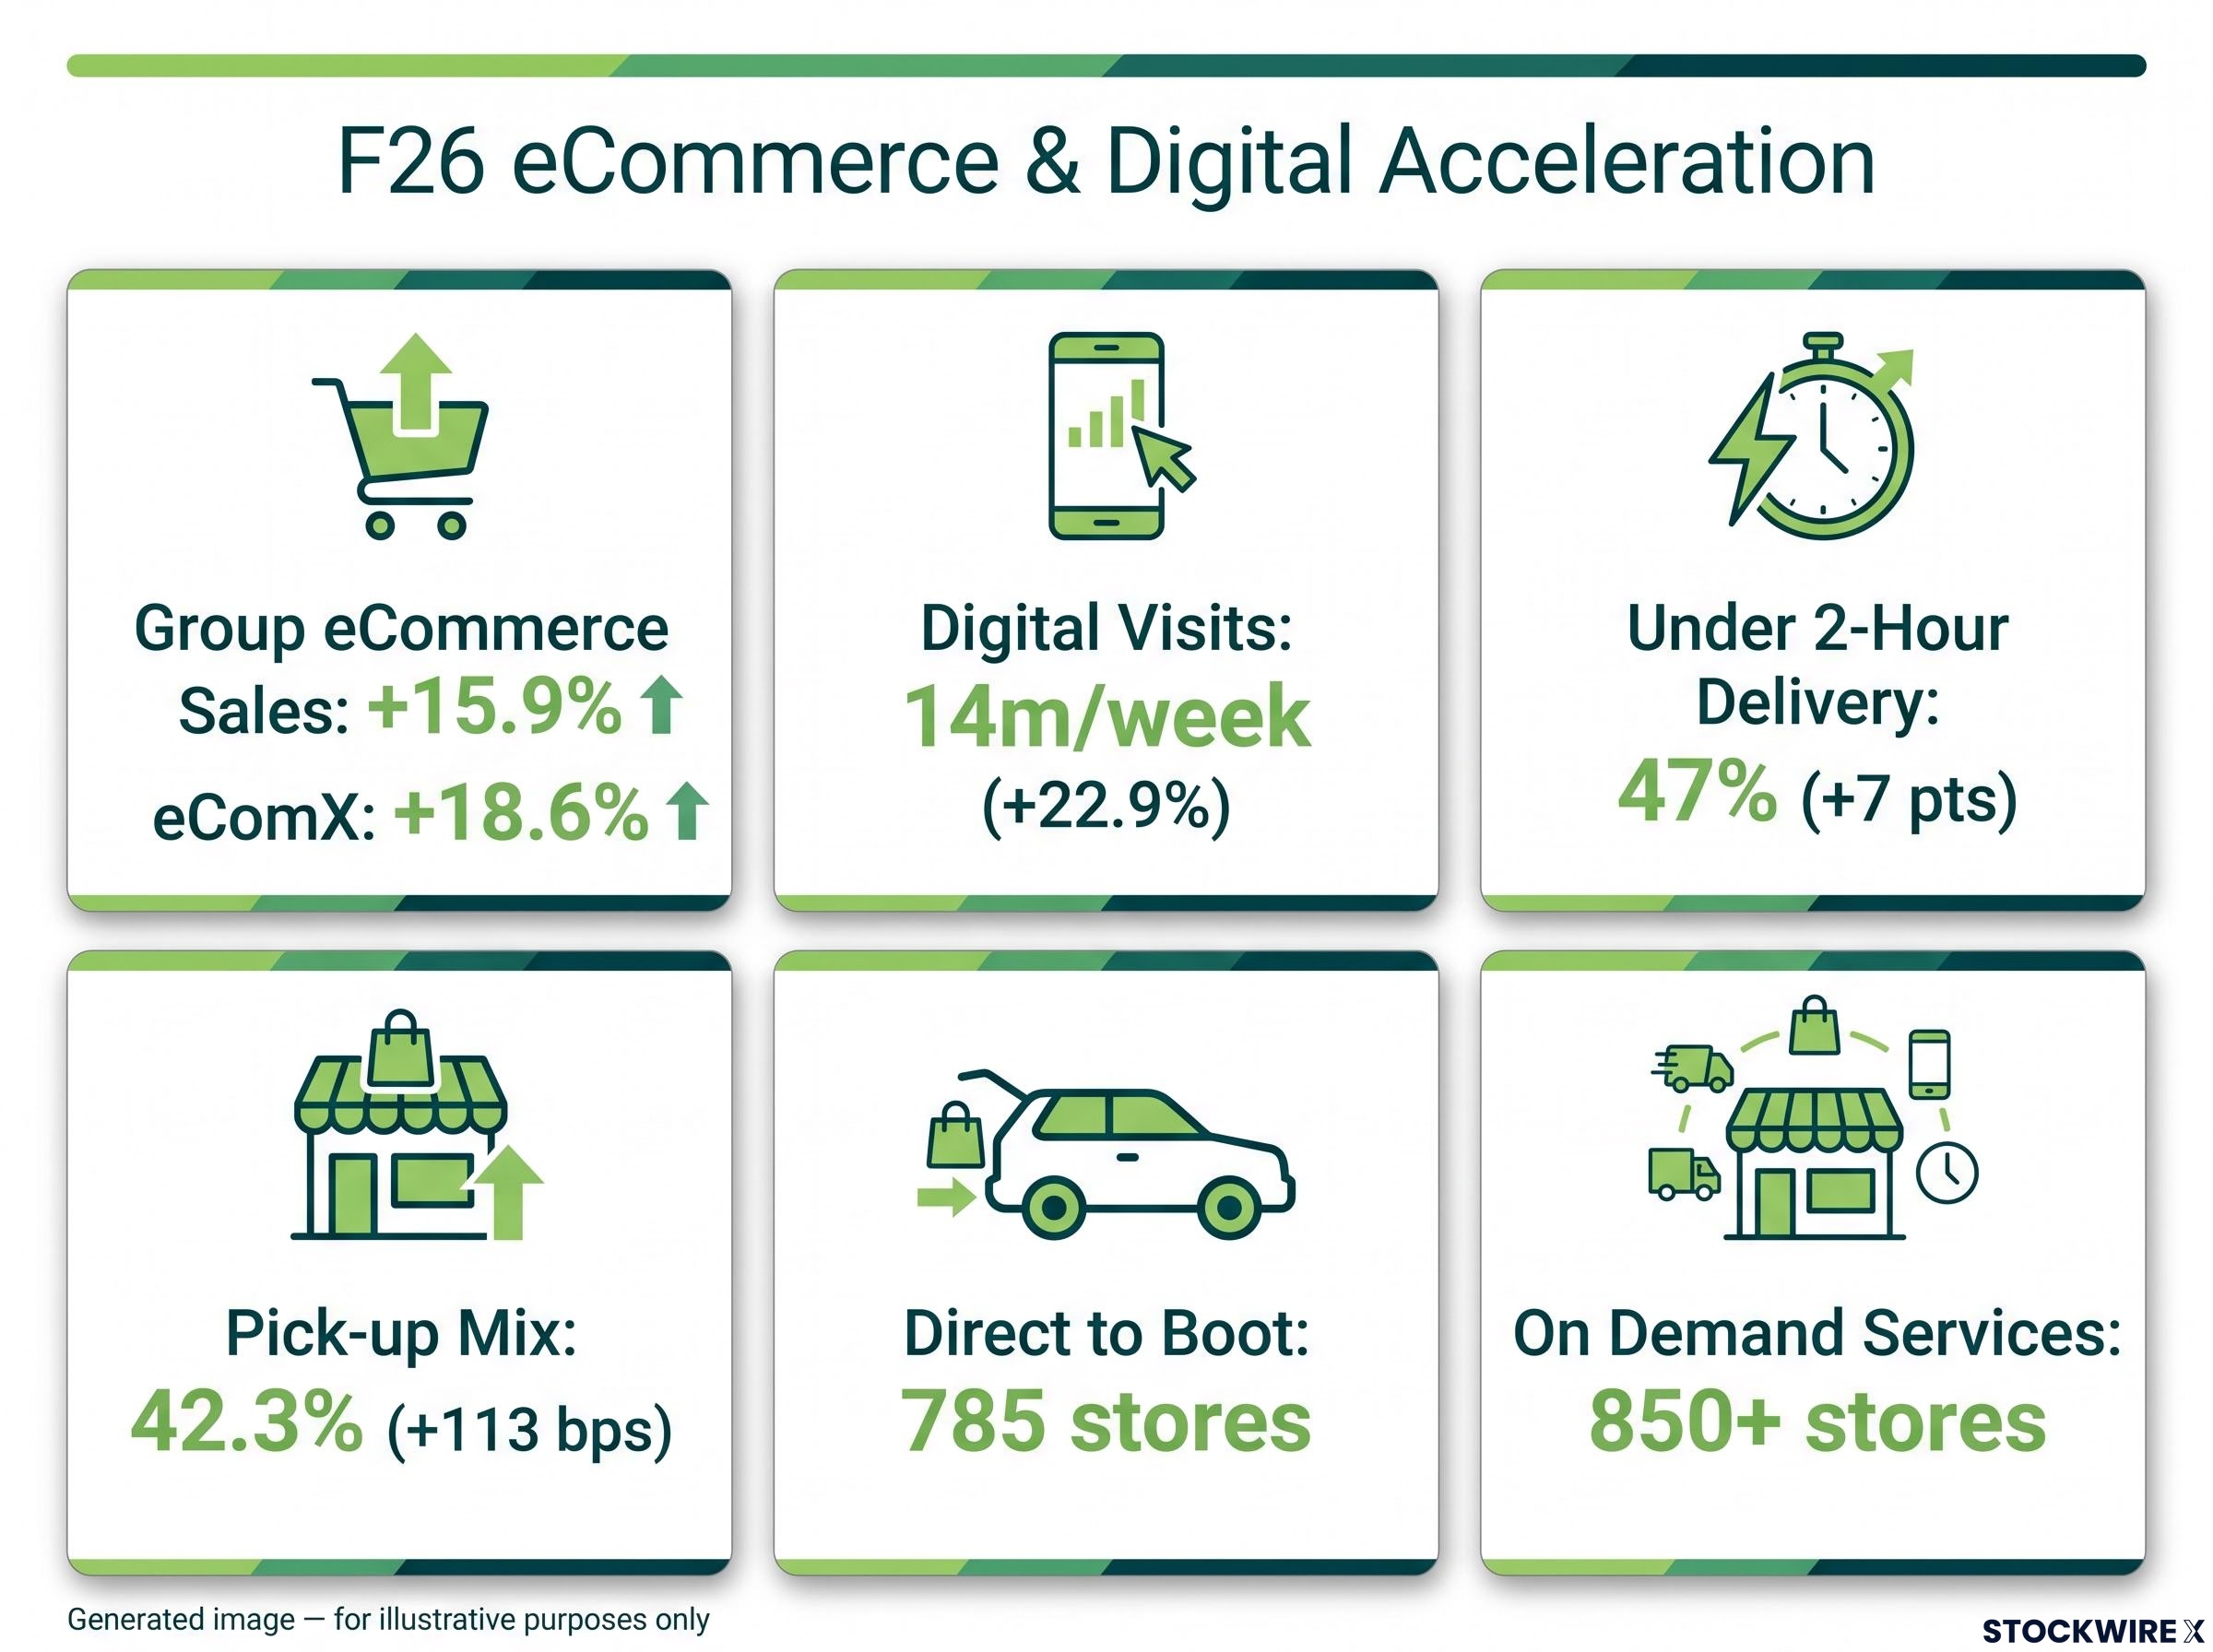
Group eCommerce delivered sales growth of 15.9%, with eComX up 18.6%, led by On Demand. The presentation highlighted strong profit improvement alongside top-line expansion.
Key digital and fulfilment metrics included:
-
14m average weekly visits to Woolworths digital platforms, up 22.9%
-
47% of eCommerce delivery orders fulfilled in under two hours, up 7 pts
-
42.3% F26 pick-up mix of eCommerce sales, up 113 bps
-
785 stores servicing Direct to Boot, with 850+ stores offering On Demand services
Understanding the drivers — what “complementary businesses” means for the investment case
Beyond its core supermarkets, Woolworths operates a portfolio described in the presentation as “complementary businesses & services”. These span retail media (Cartology), pet retail (Petstock), food distribution (PFD), loyalty and financial services (Everyday), and supply chain (Primary Connect+).
Why does this matter to investors? These operations contributed around a third of Group EBIT growth in F26.
Selected figures underscored the trend: Cartology revenue grew 7.8%, Petstock comparable sales rose 5.8%, and Everyday Insurance active policies increased 4.3%. Collectively, they represent a growing earnings stream central to the medium-term thesis.
New Zealand Food and BIG W turnaround
New Zealand Food delivered EBIT growth of 8.8% in NZD terms, supported by a 2 pt improvement in Value for Money VOC NPS, though management described the second half as more challenging.
BIG W returned to positive EBIT of $64m and cash flow in F26, with EBITDA growth of 28.1%. BIG W Market sales rose 83.7% versus F25, reflecting continued progress on the segment’s transformation.
Cash generation, dividend and balance sheet strength
Capital management remained a key feature of the F26 result. The company generated cash from operating activities before interest and tax of $6.5b, with a cash realisation ratio of 107%.
Net debt to EBITDA improved to 2.5x, down from 2.8x in F25, supported by a solid investment-grade credit rating (S&P BBB stable, Moody’s Baa2 stable).
Capital allocation priorities — F26 results presentation
The presentation set out a capital allocation framework prioritising investment in growth that exceeds minimum return hurdles, debt reduction to improve credit quality, and the return of excess capital to shareholders via special dividends or buy-backs.
Dividend detail
-
Final dividend of 52c fully franked, up 15.6%
-
Full-year dividend of 97c, up 15.5%
-
Full-year payout ratio of 74.1%
-
Franking credit balance of approximately $1.3b after payment of the final dividend
F27 outlook — momentum carrying into the new year
Management pointed to a positive start to the new financial year. In the first eight weeks of F27, Australian Food total sales increased 7.6%, with the success of Disney Ooshies estimated to have added approximately 1.5–2 pts of incremental sales growth.
New Zealand Food total sales rose 4.2% in NZD terms, while BIG W declined modestly, reflecting ongoing cost-of-living pressures on households.
Guidance items for F27 included:
-
Operating capex expected to be approximately $1.9b–$2.0b
-
Other segment LBIT expected to be approximately $260–$270m
-
Wage growth expected to remain elevated, reflecting rate increases and changes to pay for 18 and 19-year-old retail team members
-
New supply chain facilities, with Sydney Chilled expected to open in H2 F27 and Melbourne North CFC in H1 F28, anticipated to deliver benefits from F28
Continued momentum into F27 supports the group’s medium-term financial aspirations, which include double-digit total shareholder return and Woolworths Food Retail EBIT growth exceeding sales growth. Underpinning the plan is the ambition to be first choice for customers, offering the best products and shopping experiences.
Stay Ahead on Consumer Sector News
Big News Blast delivers FREE breaking ASX news directly to your inbox within minutes of release, complete with in-depth analysis already done. Join 20,000+ investors who never miss a market-moving announcement. Click the “Free Alerts” button at Big News Blast to get the next consumer sector update the moment it hits the ASX.