
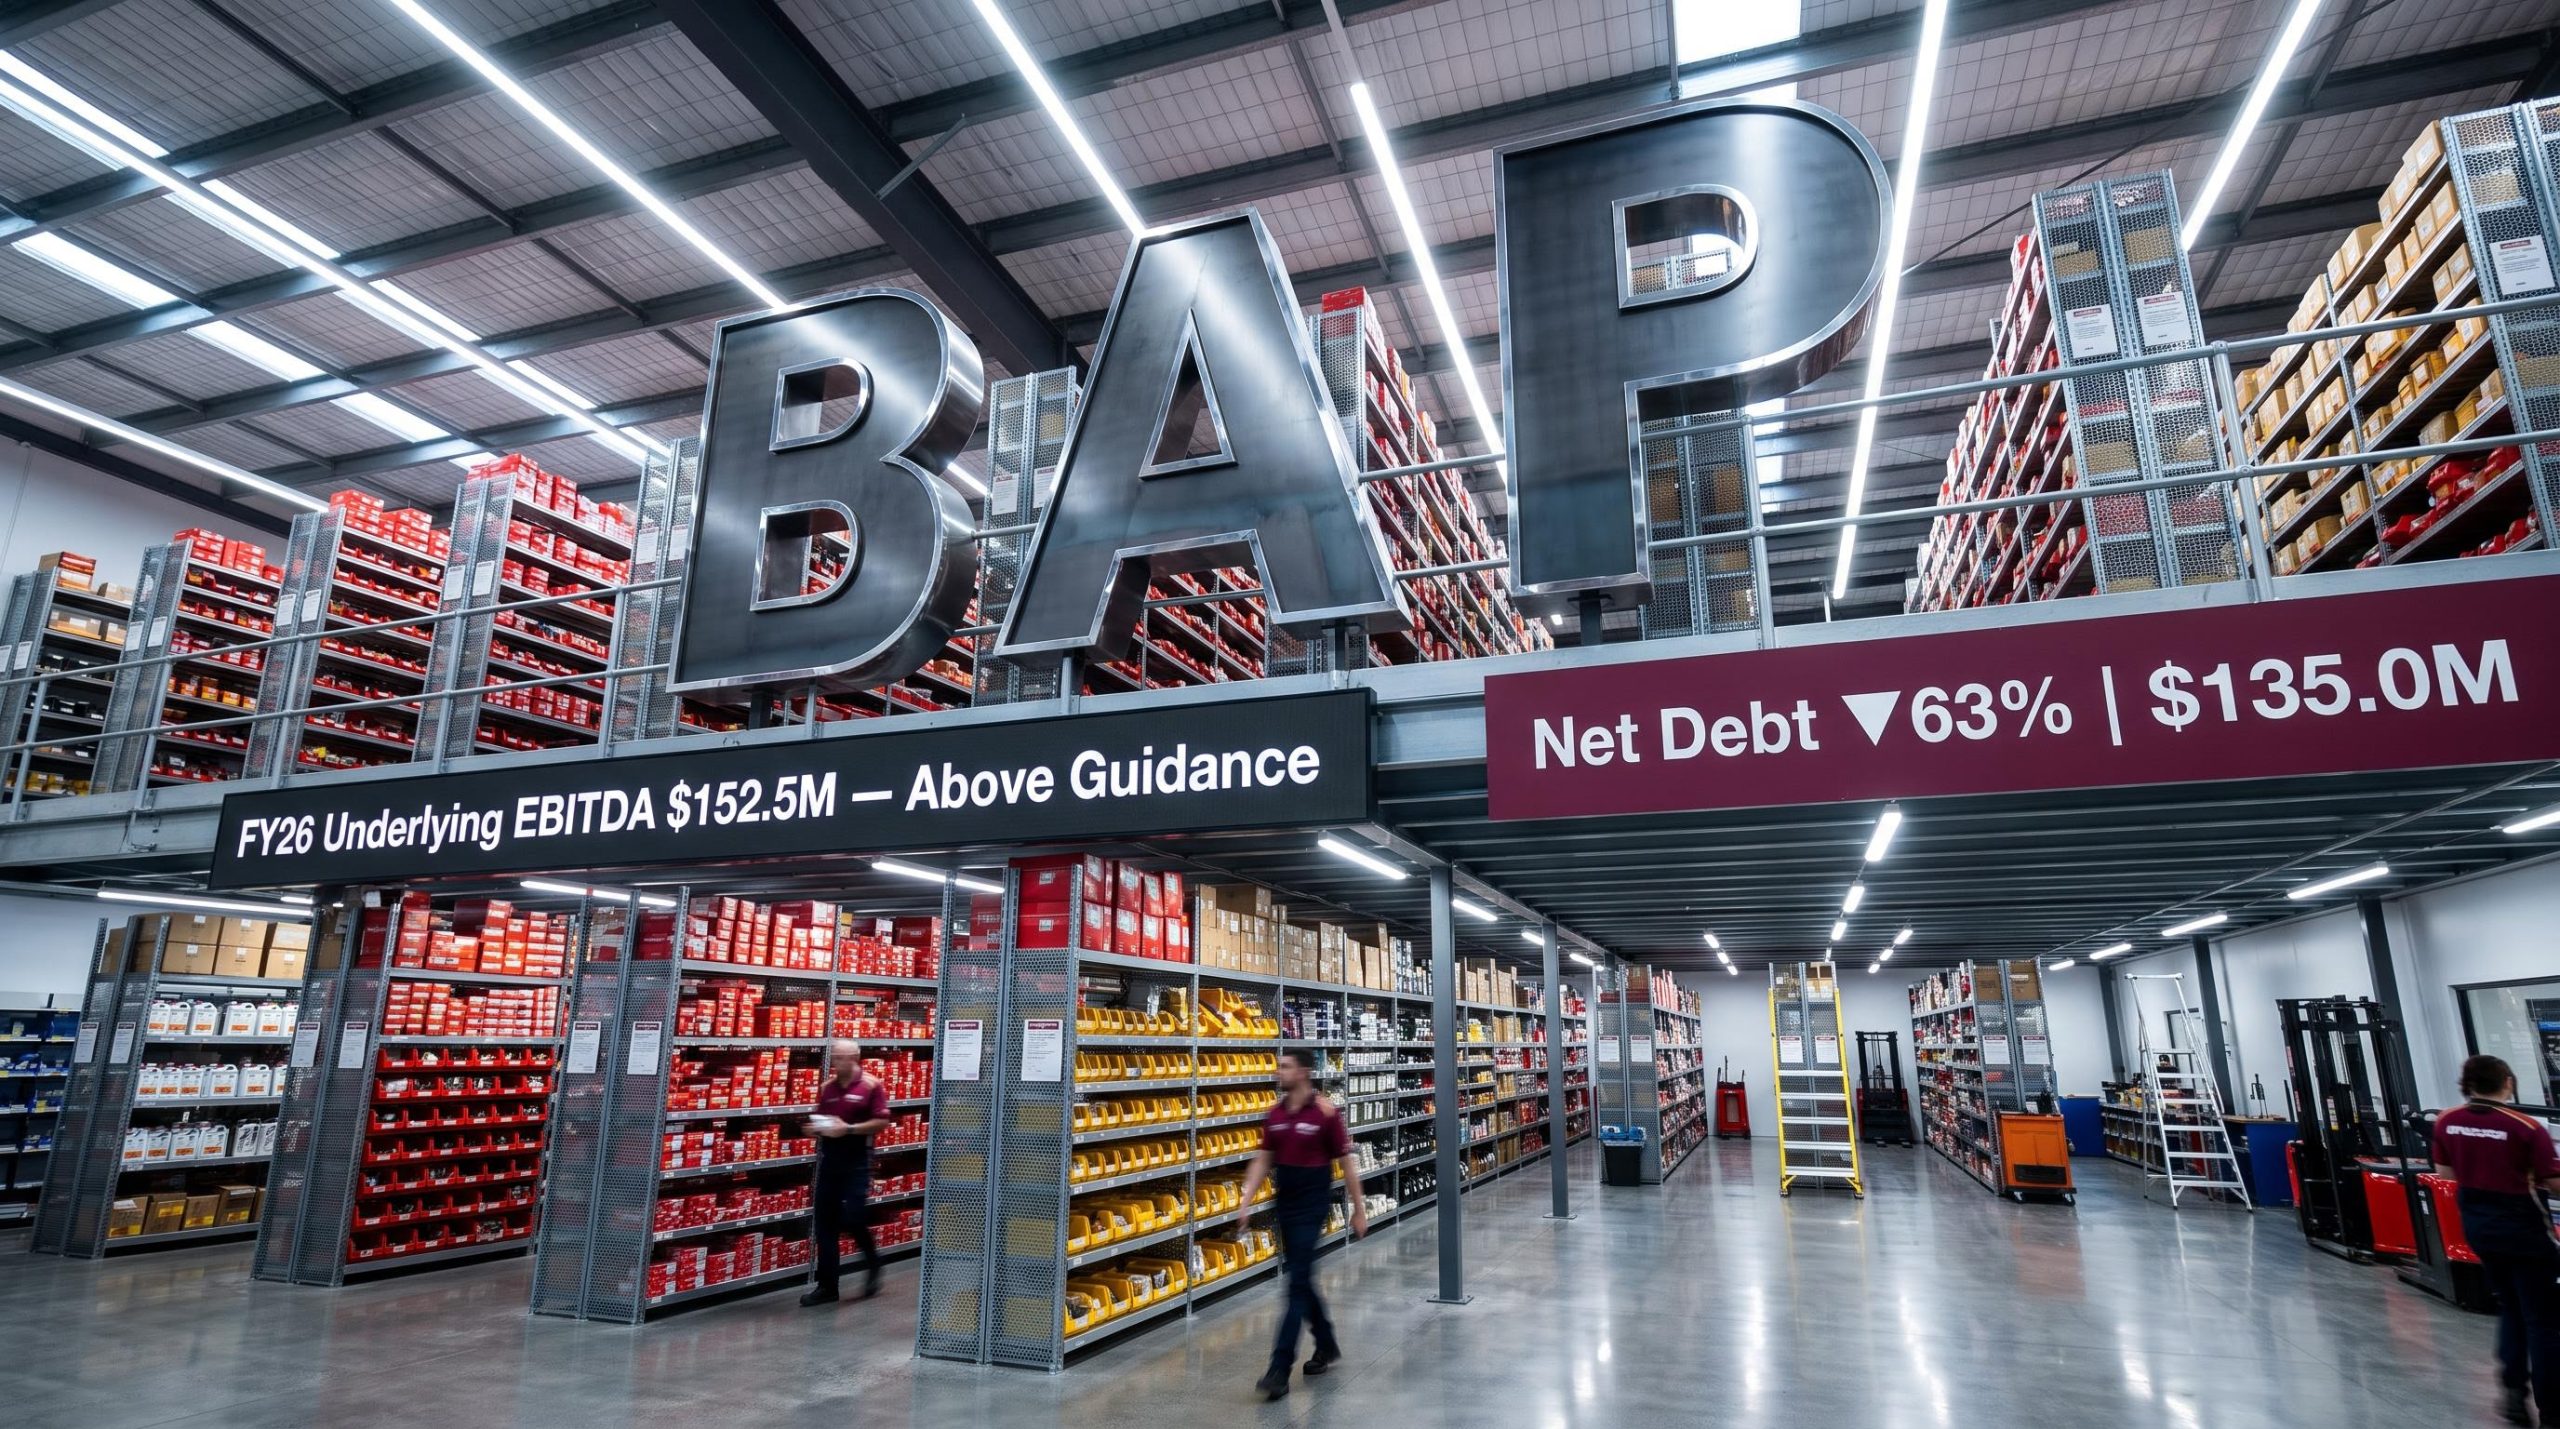
Bapcor returns to H2 growth as FY26 EBITDA beats guidance despite $431.6M statutory loss
In its FY26 results presentation delivered on 27 August 2026, Bapcor Limited reported a statutory loss of $431.6M, a figure driven overwhelmingly by non-cash significant items, alongside underlying EBITDA of $152.5M that came in above the company’s May 2026 guidance. Management, led by Chief Executive Officer and Managing Director Chris Wilesmith and Chief Financial Officer Kim Kerr, outlined how turnaround actions implemented in the second half restored sales momentum across the business in the final five months of the year. The presentation framed FY26 as a foundation-setting year, with a materially strengthened balance sheet positioned as a platform for continued recovery in FY27.
| Metric | FY26 Value | vs FY25 |
|---|---|---|
| Group Revenue | $1,924M | ▼ 1.8% |
| Underlying EBITDA | $152.5M | Above May guidance |
| Underlying NPAT | $10.8M | ▼ 85% |
| Statutory NPAT | ($431.6M) | ▼ >100% |
| Net Debt | $135.0M | ▼ 63% |
| Cash Conversion | 109.4% | vs 86.5% |
When big ASX news breaks, our subscribers know first
The numbers behind the headline loss
The statutory loss of $431.6M was driven by $442.4M in post-tax significant items, of which 99% were non-cash, primarily impairments of goodwill and trademarks. On an underlying basis, the company recorded NPAT of $10.8M, down 85% on the prior comparative period.
The presentation detailed a gross margin of 45.3% (down 72bps), cost of doing business (CODB) of 37.4% (up 325bps), and an EBITDA margin of 7.9%. Management attributed the earnings decline to several external and internal pressures:
- Higher costs from the Middle East conflict, including fuel and freight surcharges
- Softer consumer and business demand amid weaker economic conditions
- The transition to more competitive pricing, which compressed gross margin
- Continued investment in information technology and supply chain, lifting CODB
For investors, the distinction is central to the FY26 story. The reported loss is an accounting and impairment event, while the operating business generated positive underlying earnings and strong cash flow across the period.
Bapcor’s 1H26 results, reported in February 2026, established the same underlying-versus-statutory distinction playing out in the full-year numbers, with a $104.8M statutory loss masking a $5.5M underlying profit as a $99.9M New Zealand goodwill impairment dominated the significant items line.
What a turnaround looks like — Bapcor explained
Bapcor is a leading Australia and New Zealand (ANZ) provider of aftermarket vehicle parts, accessories, equipment, service and solutions. The company generated $1.9B in FY26 revenue across roughly 900 locations, operating through four segments: Trade, Networks, Retail and New Zealand.
A “turnaround programme” refers to a structured plan to stabilise an underperforming business. In Bapcor’s case, this includes repricing, cost control, inventory discipline and leadership renewal. Progress is typically measured through operational indicators before it flows fully to earnings.
The “car parc” thematic also matters here. This term refers to the total pool of vehicles on the road. An ageing vehicle fleet, combined with the adoption of electric vehicles (EVs) and hybrids, is expected to underpin long-run aftermarket demand. This context helps explain why second-half momentum functions as a leading indicator for the recovery.
Second-half momentum returns across the segments
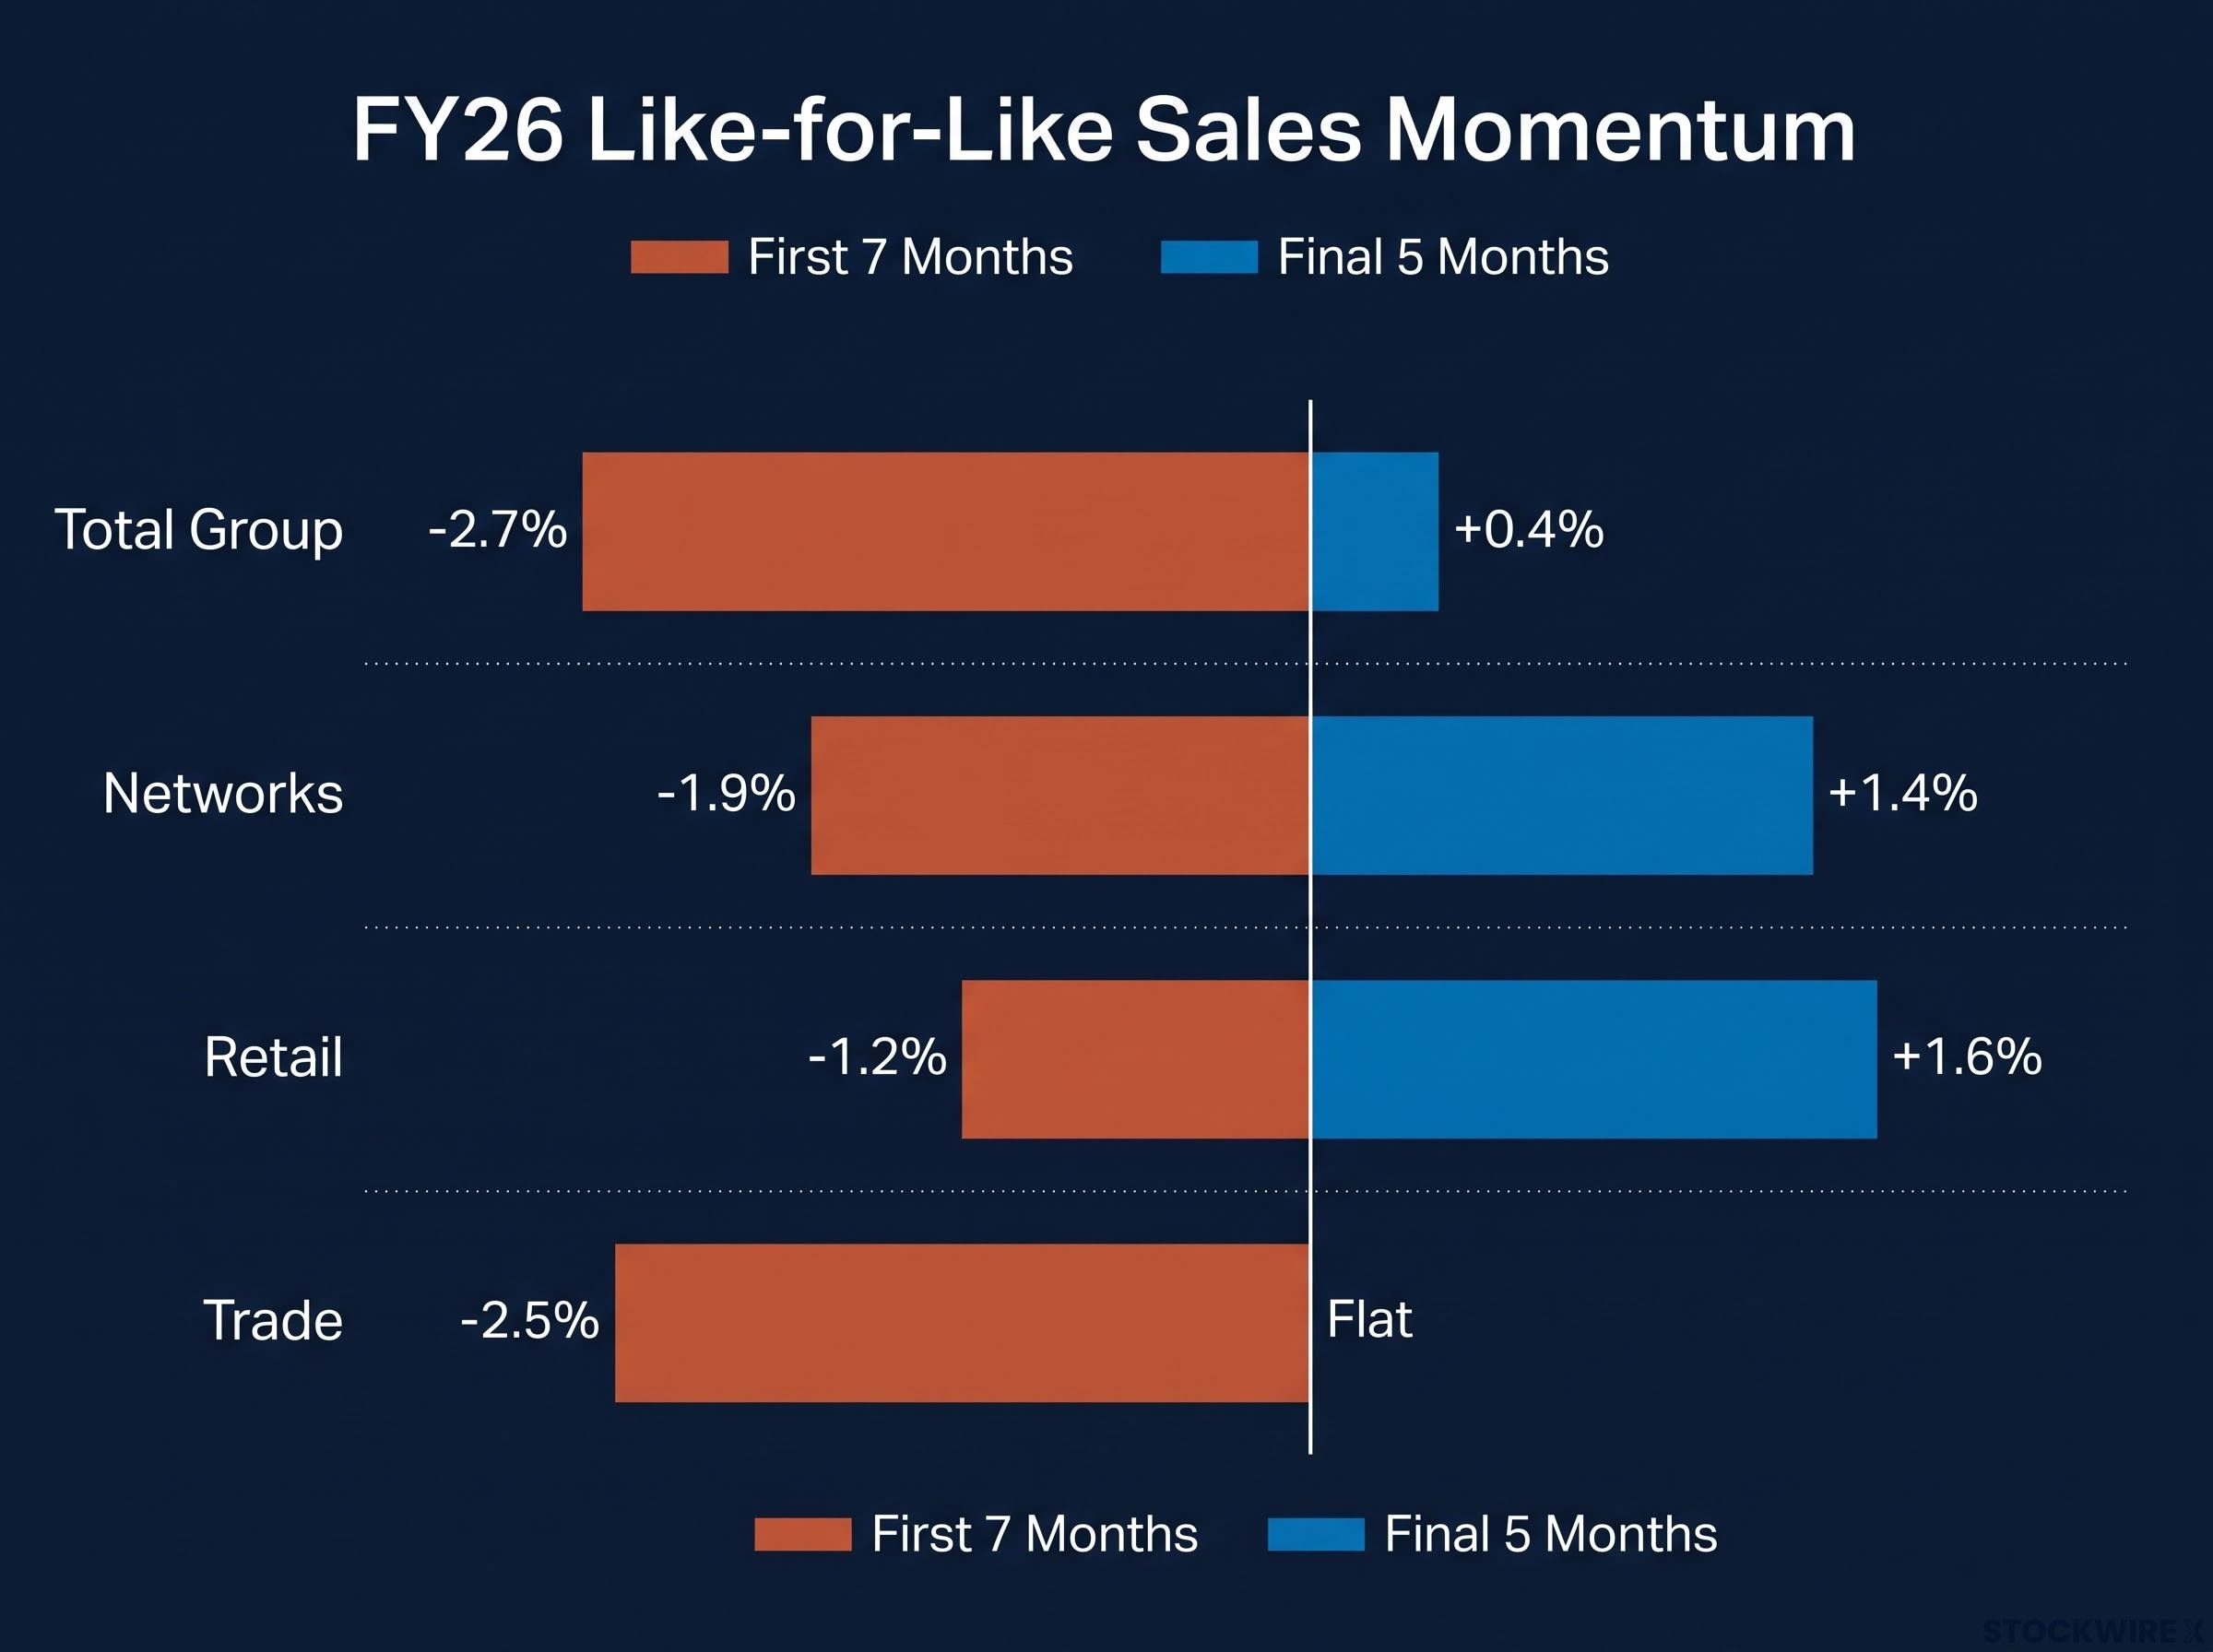
The core positive theme of the presentation was the return to growth in the final five months (February to June 2026), following declines across the first seven months. On a like-for-like (LFL) basis, total group sales moved from -2.7% in the first seven months to +0.4% in the final five, a swing of +3.1%.
By segment, Trade improved from -2.5% to flat (+2.5% movement), Networks from -1.9% to +1.4% (+3.3%), and Retail from -1.2% to +1.6% (+2.8%).
| Segment | Revenue FY26 ($M) | EBITDA FY26 ($M) | EBITDA vs FY25 |
|---|---|---|---|
| Trade | 776.9 | 105.2 | ▼ 30.7% |
| Networks | 620.9 | 67.7 | ▲ 7.3% |
| Retail | 393.8 | 38.7 | ▼ 9.6% |
| New Zealand | 158.1 | 19.4 | ▼ 30.5% |
| Total | 1,924.1 | 152.5 | ▼ 34.6% |
Trade and Networks lead the recovery
Trade parts revenue rose 0.3% year-on-year, with the company reporting market share gains in general parts during Q3 and Q4 and a new leadership team appointed mid-year. Tools & Equipment revenue was down -9.9%, with restructuring underway to improve service delivery.
Networks was the only segment to record EBITDA growth, up 7.3%. Second-half revenue rose 1.3%, while Wholesale revenue in the second half increased 6.8% on the prior comparative period.
Retail and New Zealand still working through headwinds
Retail delivered second-half EBITDA up 14.2% on the prior comparative period, with the Accelerate loyalty programme reaching 2.1M members. Five underperforming stores were closed as part of network optimisation.
New Zealand remained challenged. The weaker NZD accounted for 73% of the AUD revenue decline, compounded by soft market conditions. Distribution centre consolidation and the new Dunedin supersite were progressed during the year.
Balance sheet reset — net debt cut 63%
The presentation highlighted a substantial deleveraging. Net debt reduced to $135.0M at 30 June 2026, down 63% from $364.8M, driven by the $200M equity raising undertaken to reduce debt and strengthen balance sheet flexibility, together with cash flow initiatives.
Second-half working capital initiatives delivered $68.5M, in line with the $60M–$75M guidance. Free cash flow rose to $55.2M (from $20.9M), while cash conversion improved to 109.4%.
Key covenant and facility highlights included:
- Net leverage of 1.72x, well within the covenant of less than 3.5x
- More than $322M in undrawn committed facilities
- Average remaining tenor of approximately three years
- Repayment of the maturing $100M MetLife facility, eliminating current borrowings
The reset restored balance sheet flexibility, providing a stronger platform for FY27.
The four pillars of the turnaround
Management structured its turnaround framework around four themes, each supported by early proof points:
- Improving competitiveness: Burson store-level discounting was cut from 16% (December 2025) to 8% (June 2026), alongside targeted repricing across Burson and Autobarn.
- Optimising the cost base: An in-house recruitment function was established, emergency replenishment orders were reduced from 15.4% to 12.2%, and supply chain labour efficiencies delivered $2.8M in annualised savings.
- Strengthening capital efficiency: Inventory was reduced by $22.5M to $524.8M, overdue debtors cut by $14.5M, and branch in-stock levels lifted (Burson from 84% to 94%).
- Returning to growth: Team member turnover was reduced from 41.8% to 35.5%, while Burson sales representatives increased from 56 to 64.
The presentation’s concluding summary noted that FY26 laid the right foundations for FY27 and beyond, with decisive actions implemented in 2H26 to turnaround the business, financial flexibility improved, performance improvement building momentum, and clear priorities in place for FY27.
FY27 outlook and the road ahead
Looking forward, management reported that FY27 sales in the first six weeks were slightly ahead of the prior comparative period, with Trade parts and Networks continuing to grow. Performance in Retail, New Zealand and the Trade equipment businesses remained challenging.
Underlying NPAT is expected to be materially weighted to the second half of FY27. Modest revenue growth is anticipated, with Middle East conflict pressures moderating the benefits of turnaround initiatives, and those benefits largely reinvested in technology and people. Capital expenditure and depreciation and amortisation are expected to be in line with FY26 levels.
The strategic reset, which commenced in June 2026, is expected to complete in FY27, transitioning the company to an annual strategic cycle. A portfolio review of smaller non-core assets is also underway to drive business simplification.
Revised lender covenants for FY27, secured shortly before the full-year results, lifted the permitted Net Leverage Ratio to 3.5 times at the December 2026 test date before reverting to 3.0 times from June 2027, defining the recovery window management must execute within as the turnaround transitions to an annual strategic cycle.
The presentation closed on Bapcor’s investment proposition: a market-leading ANZ position, roughly 900 locations, a vertically integrated model, and car parc tailwinds, framed by management as the platform for sustainable long-term value creation.
Don’t Miss the Next Consumer Sector Turnaround
Big News Blast delivers FREE breaking ASX news straight to your inbox within minutes of release, complete with in-depth analysis so the work is already done. Join 20,000+ investors who stay ahead of market-moving announcements across Consumer, Tech, Healthcare and more. Click the “Free Alerts” button at Big News Blast to start receiving real-time coverage today.