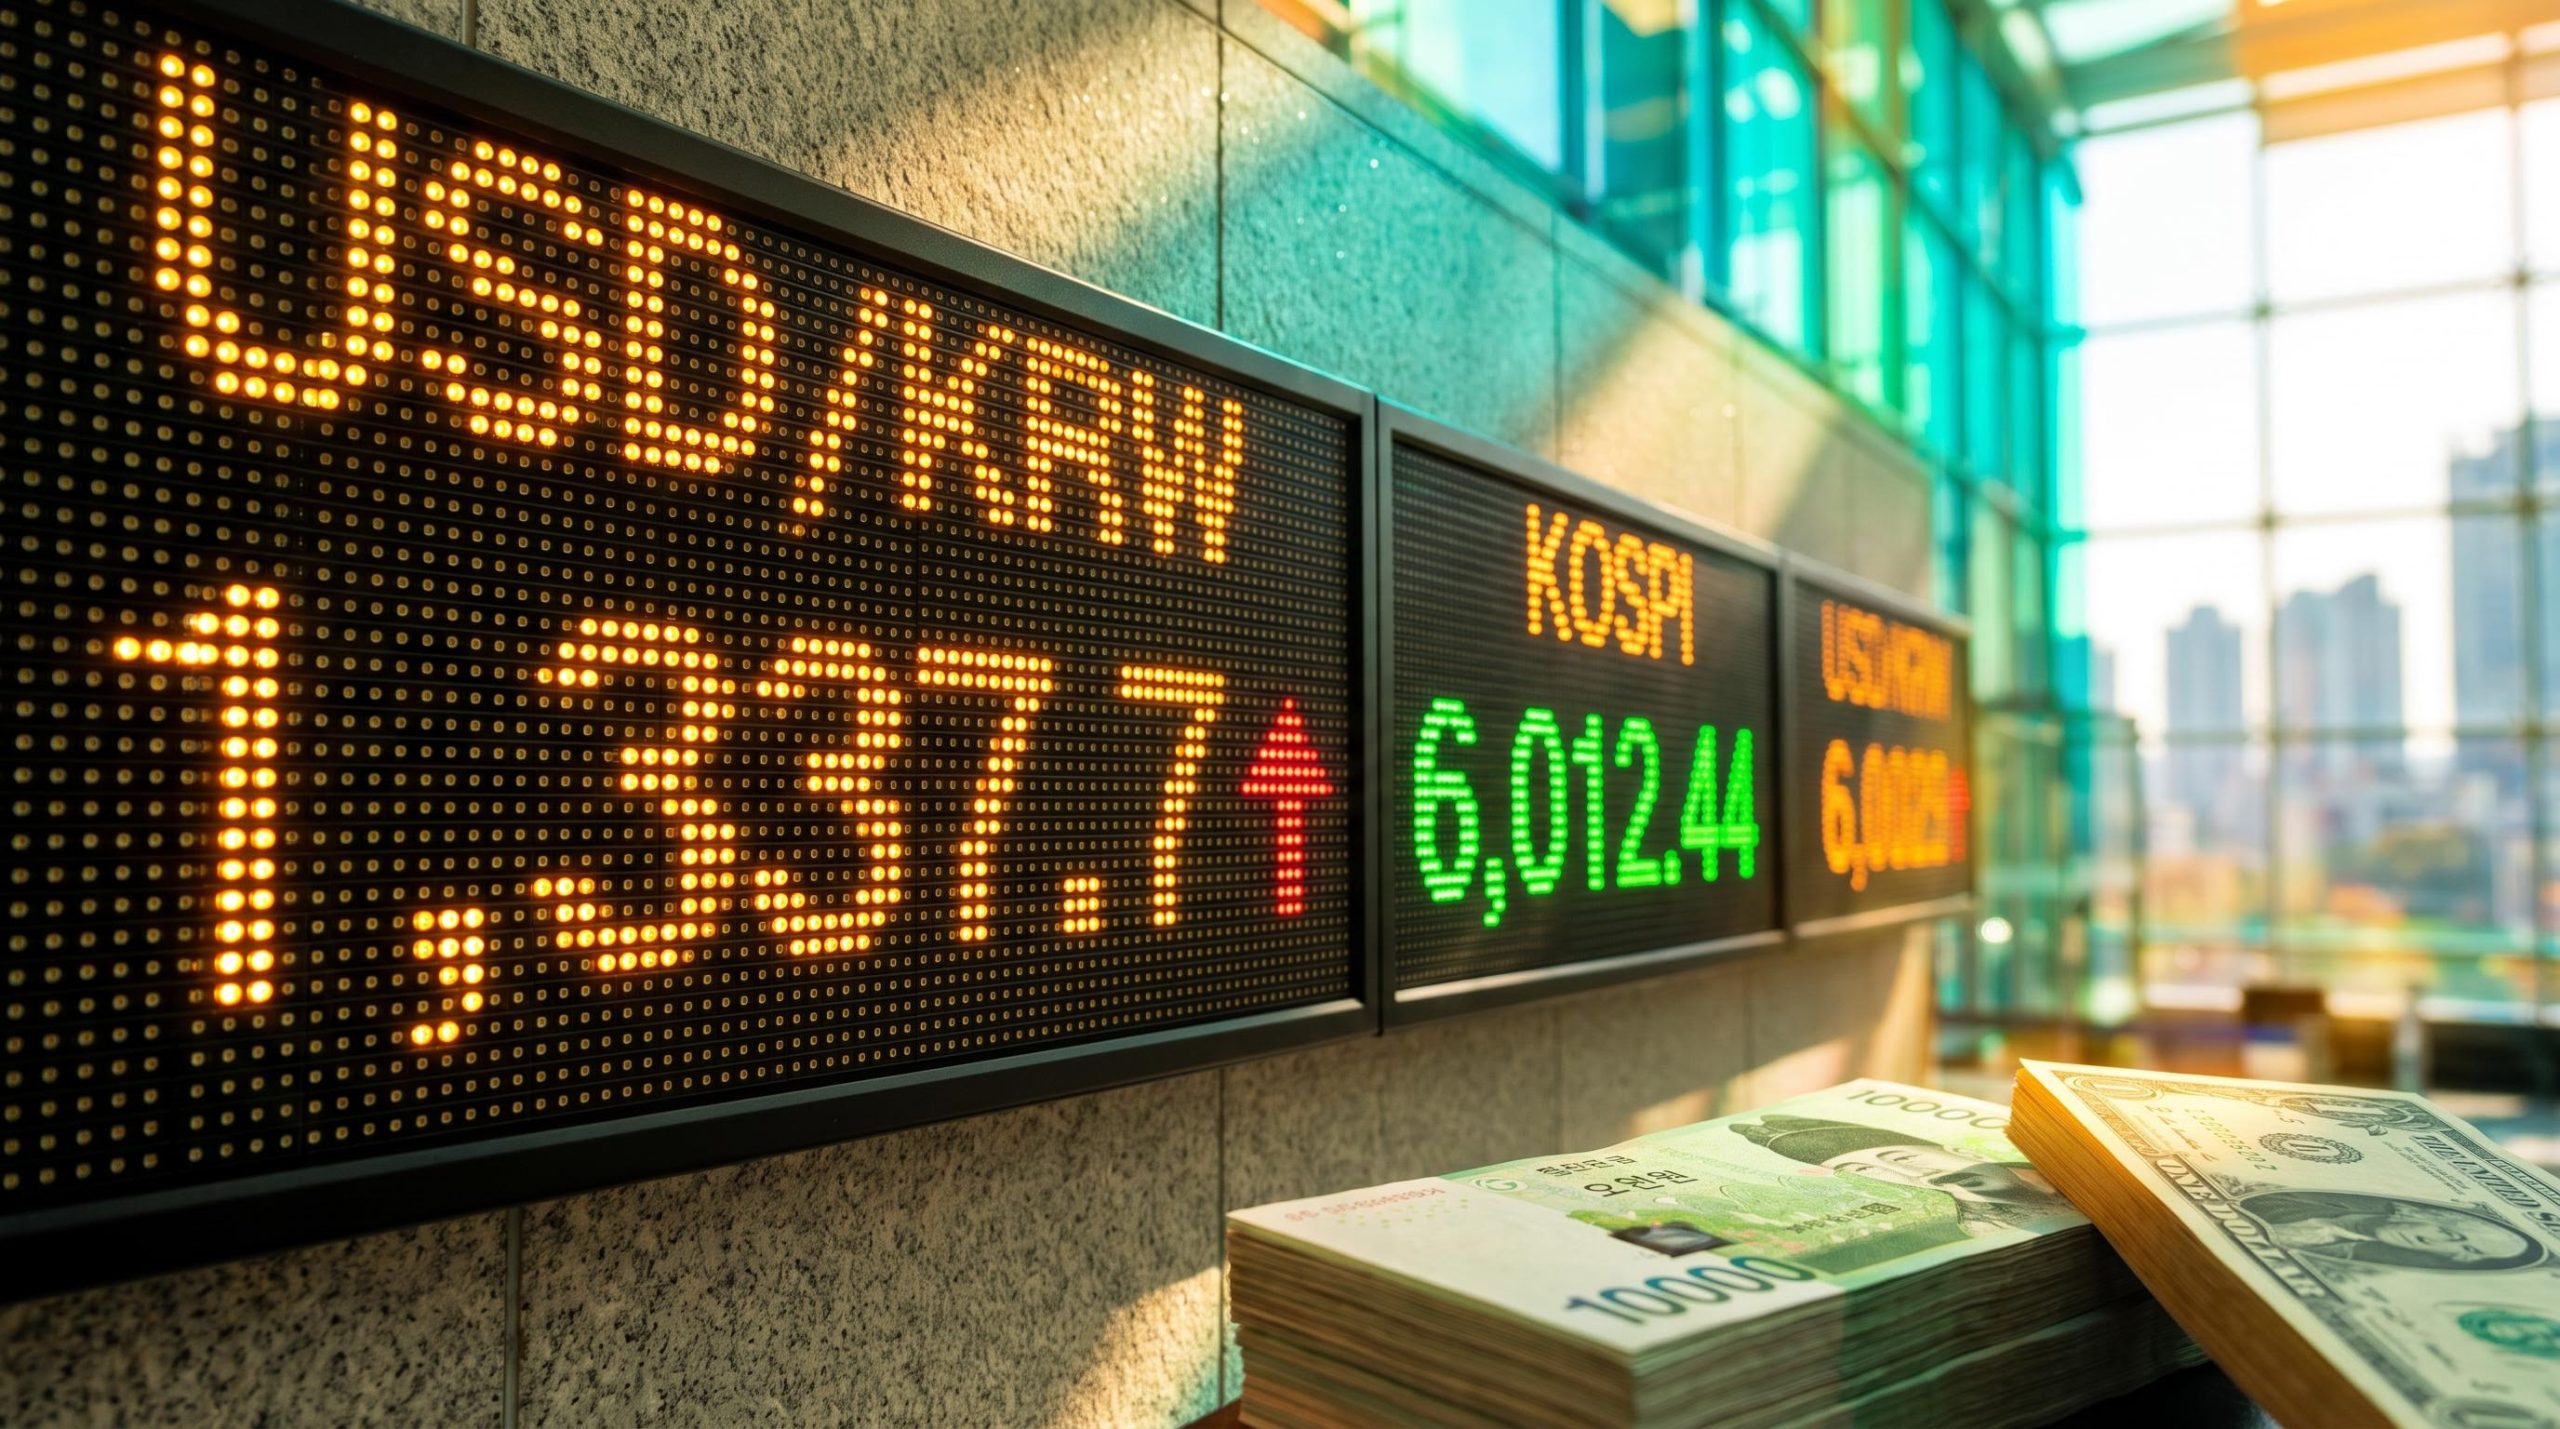
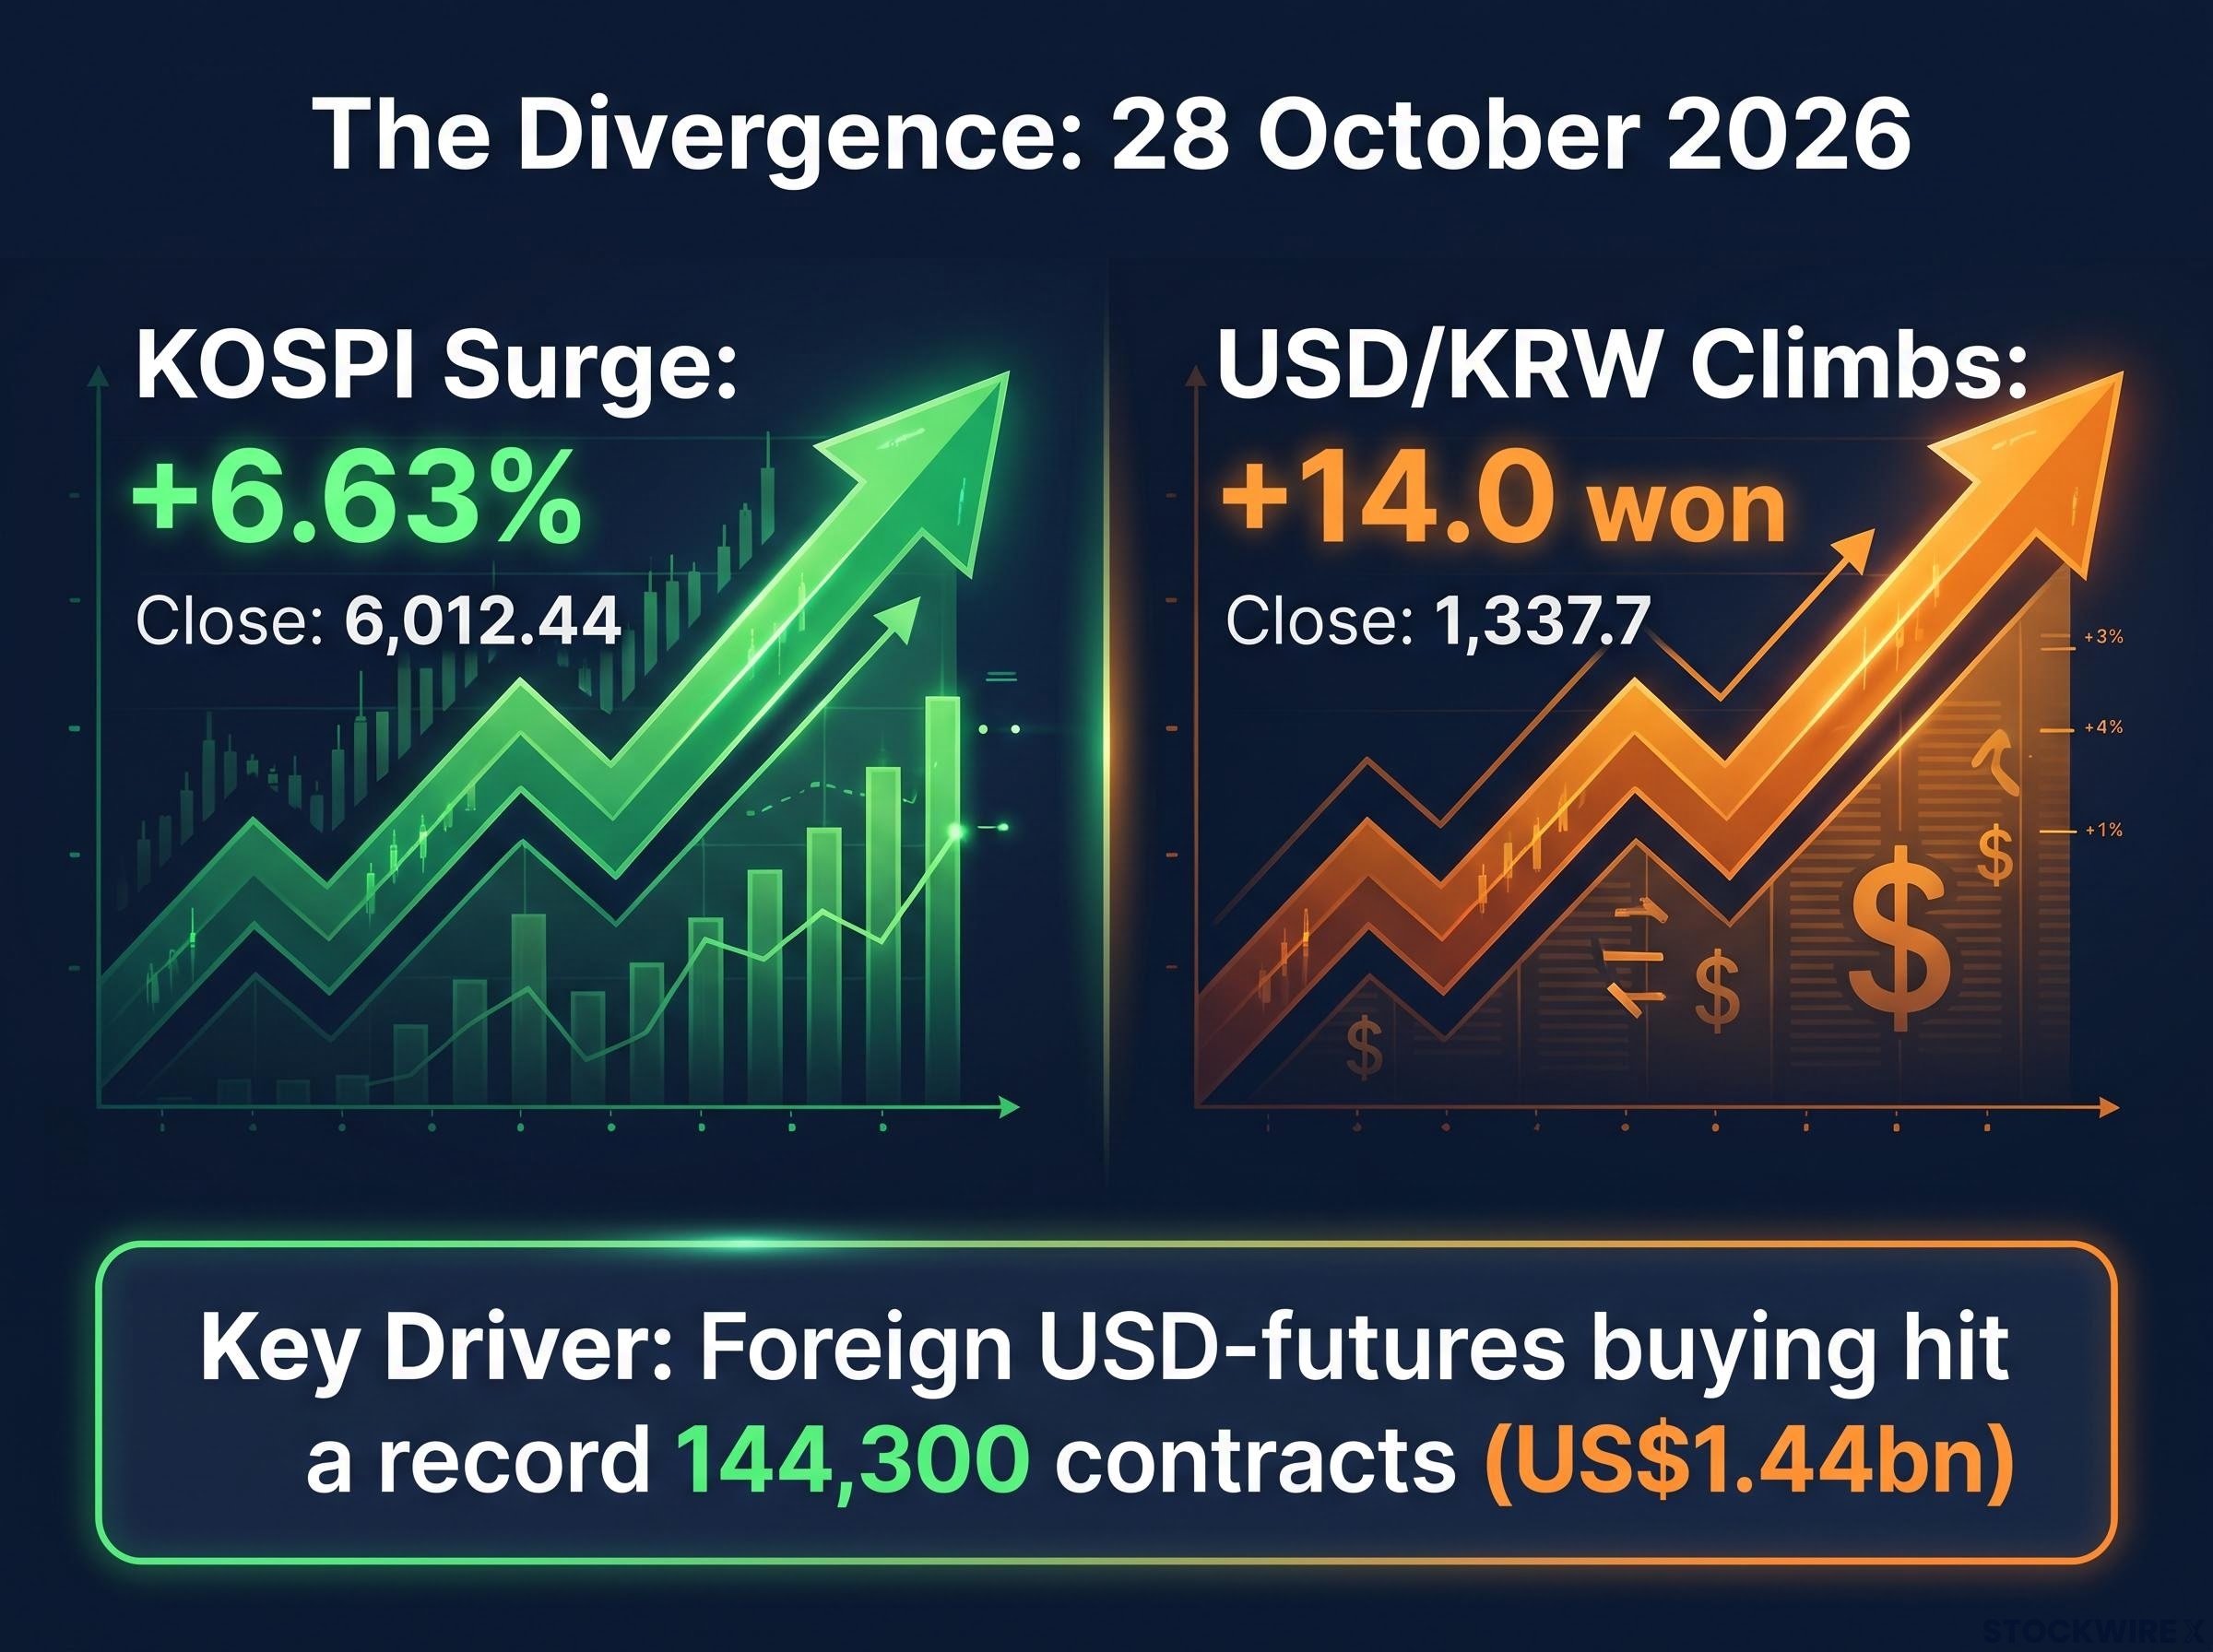
On Wednesday, the KOSPI jumped 6.63% to close at 6,012.44, one of its biggest single-day gains on record. If you assumed the won rallied with it, you would be wrong. USD/KRW climbed 14.0 won to 1,337.7, which means the Korean currency weakened on the same day its stock market boomed.
The two moves were linked. While foreigners piled into Korean semiconductor shares, they also bought a record 144,300 USD-futures contracts, roughly US$1.44bn in notional value, according to OCBC citing Yonhap Infomax.
That is a dollar bet sitting quietly alongside an equity bet. If you build a USD/KRW forecast from the direction of Korean stocks alone, you are missing the signal that mattered most yesterday.
Here is a working model of why stocks and the won can move in opposite directions, how often it has happened before, and what OCBC’s price levels say about where the pair may go next.
Why did the won weaken while Korean stocks surged?
Look at the closing screen from 28 October 2026 and the numbers seem to argue with each other:
- KOSPI: up 374.10 points (6.63%) to 6,012.44 (SBS)
- Leaders: SK hynix and Samsung Electronics, lifted by expectations of AI-driven chip demand
- USD/KRW close: 1,337.7, up 14.0 won (SBS)
- USD/KRW intraday: as high as about 1,341-1,344, according to OCBC commentary
- Foreign USD-futures buying: a record net 144,300 contracts (about US$1.44bn notional)
A stock market that rises this sharply usually draws in foreign money, and foreign money usually has to buy won to get in. So why did the currency fall?
Record foreign equity inflows have become a defining feature of the KOSPI this year, and the scale of those purchases is part of why you cannot read the won’s direction from the index alone.
The answer is flow composition. Foreign investors do not make a single transaction. They make several, and each one can push the currency in a different direction.
OCBC strategists Sim Moh Siong and Christopher Wong framed it this way in commentary republished by Mitrade and FXStreet:
OCBC’s core read: Futures flows appear to have outweighed the won support from equity inflows, so stronger Korean stocks did not automatically translate into a stronger currency.
One measurement point is worth flagging so the numbers do not trip you up. SBS reported about KRW144.7 billion of foreign buying in KOSPI 200 futures, which is a futures contract on the stock index itself. That appears to be a different instrument, or a different measure of exposure, from the USD-futures figure, so the two are not necessarily in conflict. The figures also come from published commentary reproducing OCBC’s note, not from the note itself.
What matters for you is this: a rising equity index tells you how foreigners feel about Korean shares. It does not tell you how those same foreigners are positioned on the dollar.
When big ASX news breaks, our subscribers know first
How equity flows, futures, hedging and dividends can break the stocks-currency link
Start with the simple version. When a foreign fund buys Korean shares, it normally sells dollars and buys won to settle the trade. That creates won demand, which supports the currency.
That link holds only when nothing else is going on. In practice, several other dollar-demand channels can run at the same time, and any one of them can overpower the equity flow.
| Mechanism | How it creates USD demand | Nature (structural or cyclical) |
|---|---|---|
| Foreign equity hedging | Investor buys Korean shares but sells won forward or buys dollars to protect the position | Both: cyclical in rallies, but recurring |
| USD-futures positioning | Dollar futures bought for exposure or to hedge Korean assets | Mainly cyclical; vulnerable to short covering |
| Retail purchases of US shares | Korean residents convert won into dollars | Largely structural |
| NPS overseas investment | Pension fund converts won to buy foreign stocks and bonds | Structural |
| NPS currency hedging | Selling dollars or forwards when the won weakens | Cyclical overlay on a structural allocation |
| Dividend repatriation | Foreign shareholders convert dividends into dollars and send them home | Cyclical and calendar-driven, but recurring |
Flows that move within a session
USD-futures buying creates dollar demand without a matching sale of dollars in the spot market (the market for immediate currency exchange). A futures contract is an agreement to buy or sell at a set price on a future date, so it lets an investor take a dollar view without touching won at all.
Hedging works alongside it. After a big run in chip stocks, a foreign fund may sell won forward to protect the currency value of its gains, so it ends up buying shares and selling won simultaneously.
Short covering is the accelerant. Traders who had bet against the dollar buy it back when the pair breaks higher, and OCBC noted that this risk grew once USD/KRW moved back above 1,330. All three can reverse just as quickly as they arrive.
Flows that build over months
Slower channels keep a steady bid under the dollar. The Bank of Korea has reportedly attributed won weakness to residents’ overseas investment and foreign selling of domestic securities, while Citigroup economist Kim Jin-wook has reportedly argued that retail and National Pension Service (NPS) flows can keep pressure on the won. The NPS has reportedly lowered its end-2026 foreign-stock target from 38.9% to 37.2%.
Dividends add a forward-looking layer. SK hynix announced on Wednesday:
- About KRW100 trillion in total 2026 shareholder returns
- A further KRW60 trillion programme after completing a KRW40 trillion buyback
- A KRW20,000 third-quarter dividend (KRW10,000 regular plus KRW10,000 special tied to Kioxia gains)
- A record date of 30 November 2026
That cash is not a flow yet, but the market can price the expected dollar demand today. When you see stocks and the won diverge, ask which channel is dominant rather than assuming the data is wrong.
Is this divergence new? What earlier episodes show
It is not. Run through recent history and the pattern keeps reappearing. The figures below draw on reporting attributed to Yonhap and the Bank of Korea and have not been independently verified, so treat them as indicative.
| Date | KOSPI move | Foreign equity flow | Won outcome |
|---|---|---|---|
| September 2025 | Up 9% | Net buying of US$4.34bn | Monthly average weakened from 1,390.1 to 1,402.9 |
| October 2025 | Up 19.9% | Foreigners remained net buyers | Average weakened to 1,424.4 |
| 10 October 2025 | Up 1.73% to record 3,610.60 | Bought KRW1.06tn | Weakened to 1,421 |
| 23 December 2025 | Rose | Bought about KRW955bn | Weakened to 1,483.6 |
| 20 October 2026 | Down 3.73% | Sold about KRW530bn | Strengthened to 1,328.1 |
Through late 2025, the sequence barely changed. Foreigners bought, the KOSPI climbed, and the won still slid as broader dollar demand and resident overseas investment absorbed the inflows.
Then, just eight days before Wednesday’s rally, the link snapped in the opposite direction.
The mirror image: On 20 October 2026, stocks fell and foreigners sold, yet the won posted its strongest close since October 2024 as exporter dollar selling outweighed equity outflows.
That reversal is the most useful row in the table. It shows the stocks-currency connection can fail both ways, which makes Wednesday look less like an anomaly and more like a recurring feature. OCBC still cautions against reading too much into one session.
The 20 October reversal shows how exporter dollar repatriation can lift the won even when foreigners are selling Korean shares, because corporate cash cycles are harder to unwind on a single headline than speculative positions.
For your own view, the lesson is that equity direction is a weak guide to USD/KRW on any given day. Flow data and the global dollar deserve more weight.
OCBC’s USD/KRW forecast: levels, squeeze risk and what could change the call
OCBC remains cautious on the won and favours fading the USD/KRW rebound, meaning it sees the dollar’s bounce as a move to sell into rather than chase. In the same breath, it warns that a further short squeeze is possible.
The technical map
The bank’s levels give you a range to work within. The 50-day moving average is the average closing price over the last 50 trading days, often used to gauge the medium-term trend.
| Level | Type | Significance |
|---|---|---|
| 1,354 | Resistance | 50-day moving average |
| 1,348 | Resistance | First upside hurdle |
| 1,332 | Support | A break lower could revive dollar selling |
| 1,321 | Support | Recent low |
Daily momentum has turned mildly bullish and the Relative Strength Index (RSI), a gauge of how fast prices are moving, has risen. OCBC says the rebound fits its earlier view that won bulls were showing fatigue.
The squeeze trigger is clear: if USD/KRW holds above the 1,330 area or pushes toward resistance, dollar shorts could be forced to cover. Once that buying is spent, a drop below 1,332 could open the door to renewed dollar selling.
The fade call and the squeeze warning can both be right, just over different time frames.
What could break the call
OCBC ties any won recovery to the broader dollar and to whether foreign USD-futures buying continues. Other risks include:
- Fed and global dollar: renewed dollar strength or higher US rate expectations can swamp Korea-specific inflows
- BOK policy: Reuters reported that in October 2025 a dovish Bank of Korea lifted stocks while weakening the won (unverified)
- Policy response: the government, BOK or NPS could change allocations, hedge more or supply dollars, reversing the pair quickly
- Uneven chip sentiment: Samsung’s dividend was reportedly disappointing relative to SK hynix’s
- One-session caution: the move was large and concentrated in semiconductors
Past performance does not guarantee future results, and these levels are subject to changing market conditions.
What the divergence changes, and what it does not
Wednesday’s session showed that foreign investors can be bullish on Korean equities and long the dollar at the same time. Equity strength, on its own, is not a reliable signal for the won.
When you form your own view, check futures positioning, hedging demand, resident outflows and dividend calendars alongside equity flows. Then watch whether 1,332 support holds and whether the 1,348-1,354 resistance zone caps any further rise.
Two variables remain unresolved: whether foreign USD-futures buying persists, and which way the broader dollar turns. OCBC’s levels are one house’s technical view, not a prediction.
This article is for informational purposes only and should not be considered financial advice. Investors should conduct their own research and consult with financial professionals before making investment decisions.